PROVISIONAL DATA SUBJECT TO REVISION
Click to hidestation-specific text
Funding for this site is provided by:
 Site Information
LOCATION.--Lat 42°57'01.6", long
74°22'15.6" referenced to North American Datum of
1983, Montgomery County, NY, Hydrologic Unit 02020004, on left
bank 410 ft upstream from bridge on State Highway 30A at
Fonda.
DRAINAGE AREA.--2,118 mi².
PERIOD OF RECORD.--October 2014 to current year.
GAGE.--Water-stage recorder, acoustic velocity meter, and crest-stage gage. Datum of gage is 257.39 ft above NAVD of 1988.
REMARKS.--Considerable regulation of stage by operation of Lock 13 (about 4.5 mi upstream) and Lock 12 (about 5.0 mi downstream) on the Erie (Barge) Canal.
Water Years 2015-17: Records poor. Water Years 2018-22: Records fair except those for estimated daily discharges and daily discharges below 1,000 ft³/s, which are poor.
EXTREMES FOR PERIOD OF RECORD.--Maximum discharge, 65,100 ft³/s, Nov. 1, 2019, gage height, 29.42 ft; minimum discharge not determined; minimum gage height, 8.62 ft, June 26, 2020.
EXTREMES OUTSIDE PERIOD OF RECORD.--Flood of Aug. 29, 2011 reached a stage of 33.46 ft, from floodmarks in downstream cabin of Lock 13 about 4.5 mi upstream, and a stage of 31.21 ft, from floodmarks in upstream cabin of Lock 12 about 5.0 mi downstream, from information provided by New York State Canal Corporation. Flood of June 28, 2006, reached a stage of 34.21 ft, from floodmarks on left bank about 330 ft downstream, and a stage of 33.91 ft, from floodmarks on right bank about 190 ft downstream.
 WaterAlert – get an
email or text (SMS) alert based on your chosen threshold.
WaterAlert – get an
email or text (SMS) alert based on your chosen threshold.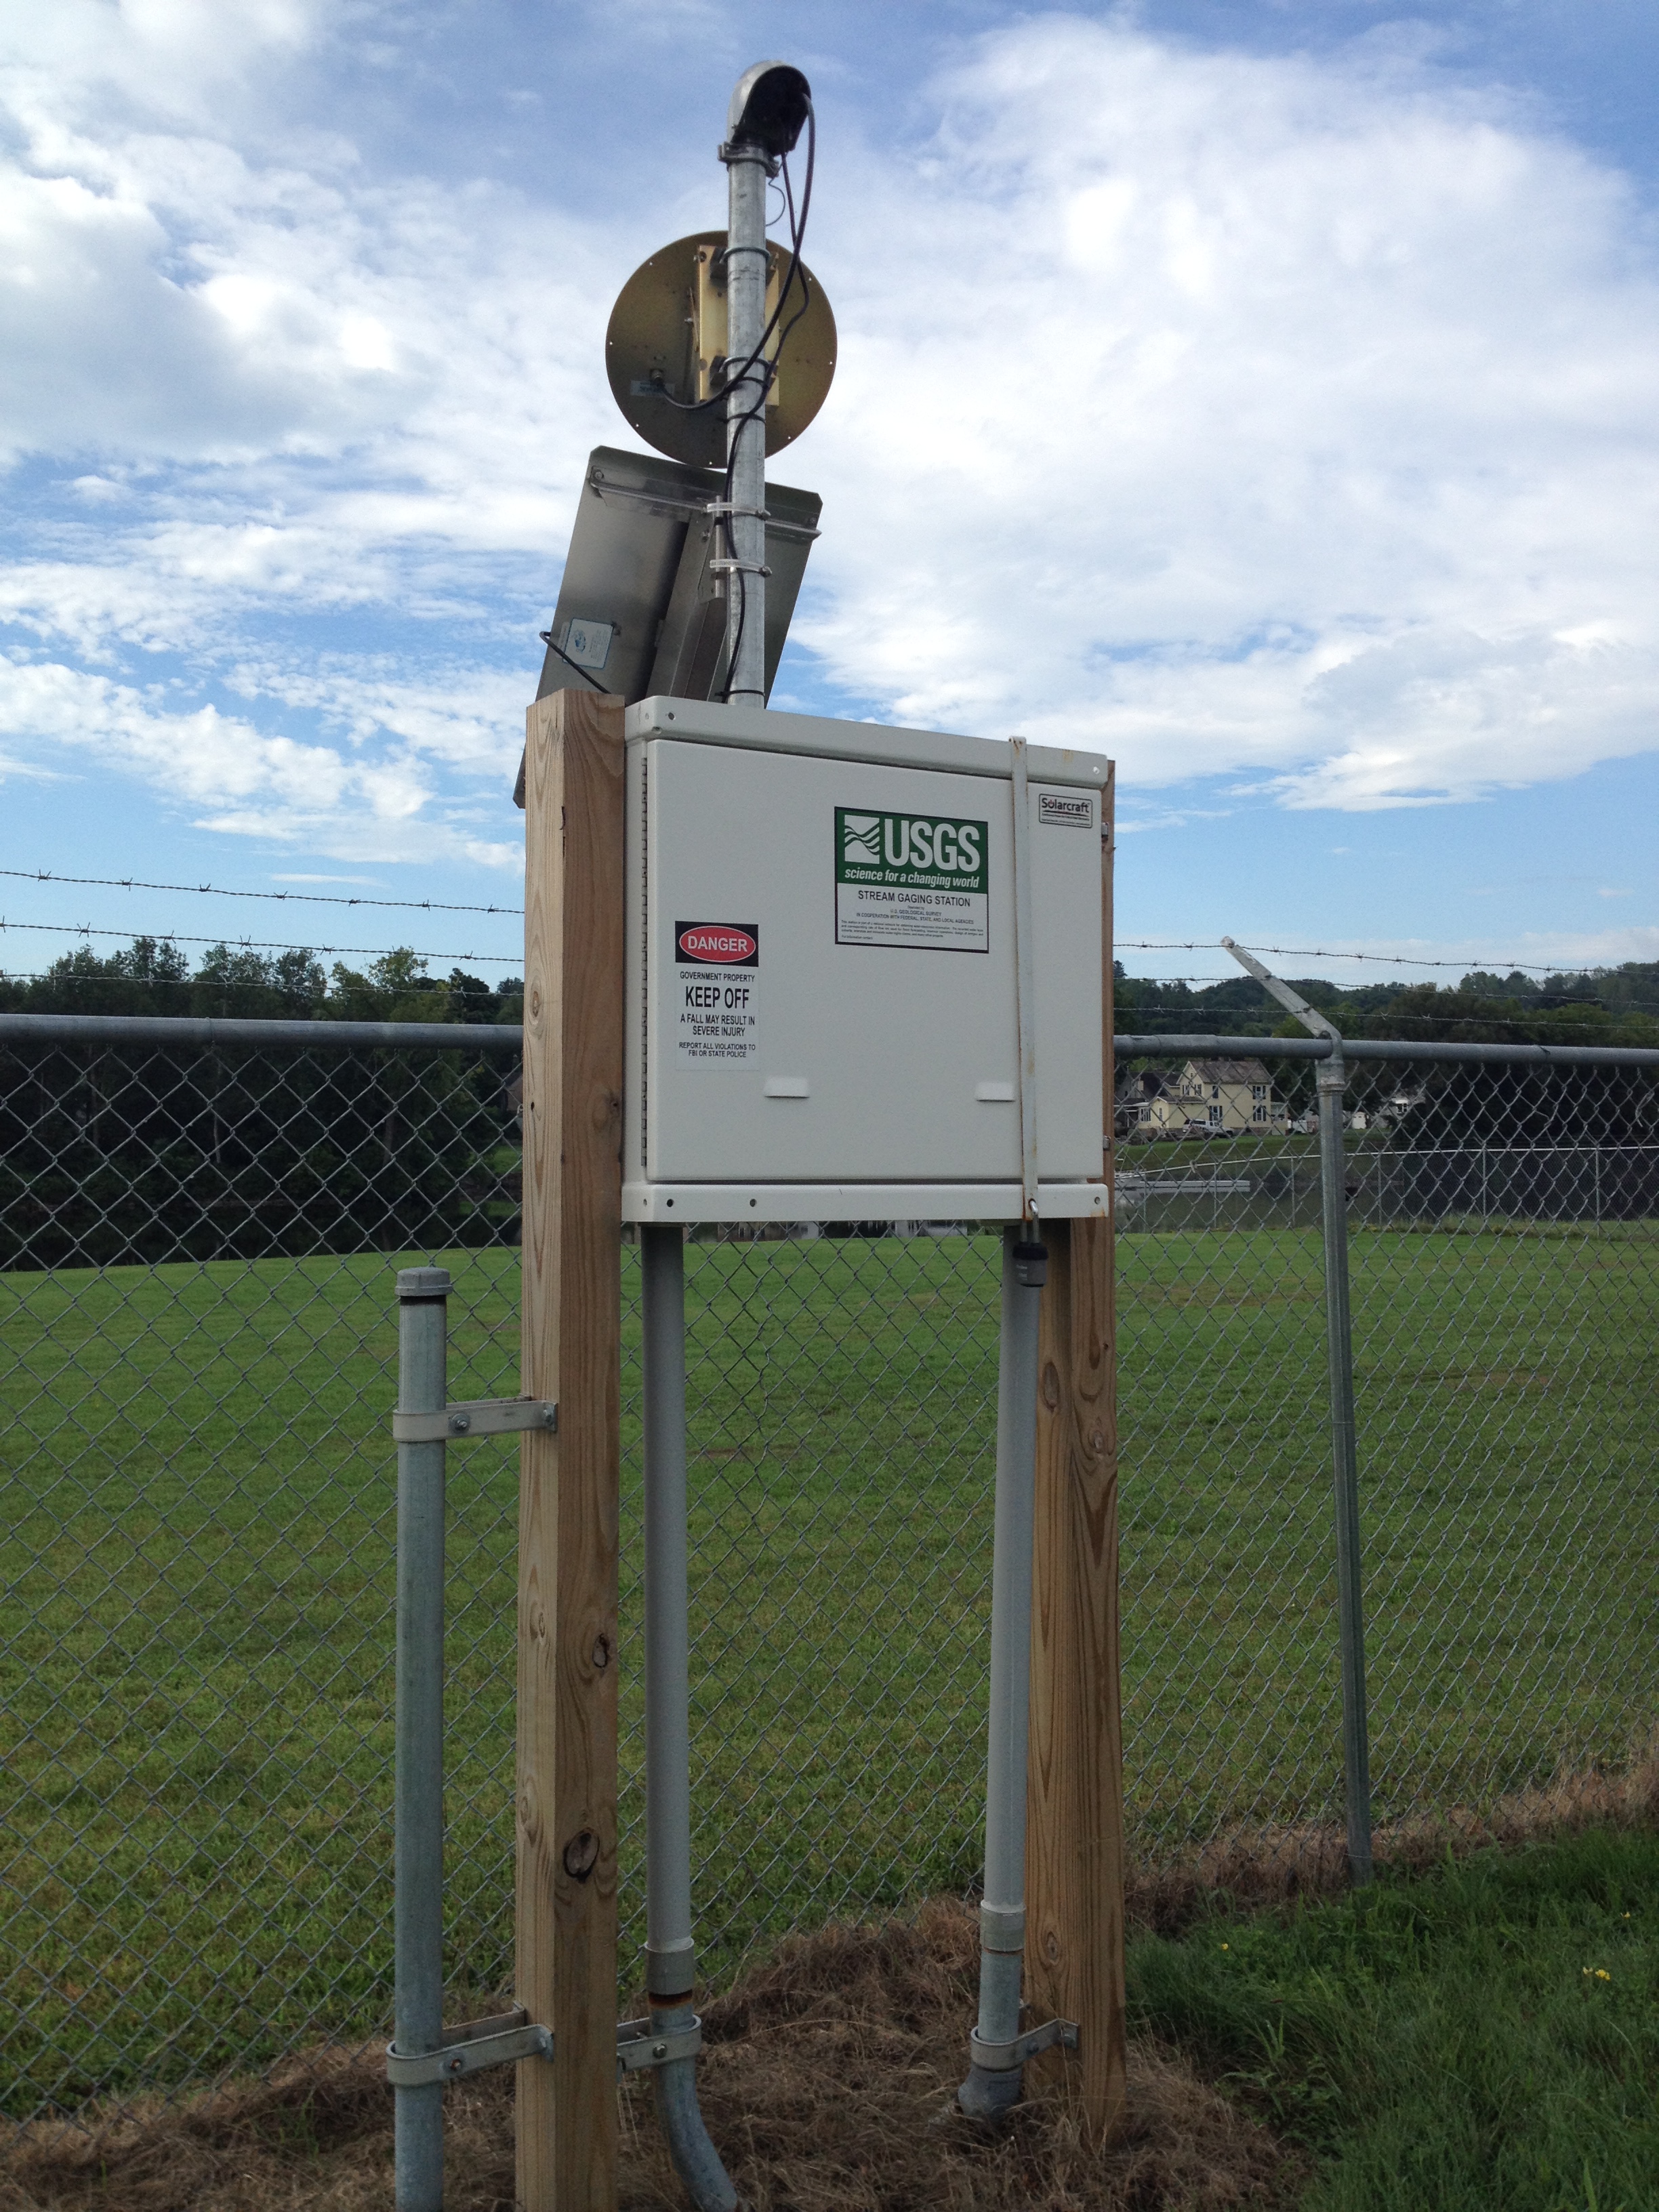 Station image
Summary of all available data for this site
Instantaneous-data availability statement


