|
Water Supply: Executing the Model |
|
Water Supply: Executing the Model |
To execute the model select File|Export|MODFLOW Input Files. If ModelMuse doesn't know where to find MODFLOW, it will prompt you for its location.
You may get an error message about some of the river cells being outside the grid. If so, you can ignore the problem for this model.
After ModelMuse exports the MODFLOW input files ModelMonitor will start running MODFLOW. The percent discrepancy in the water budget is displayed on the Results tab of ModelMonitor. If the percent discrepancy is greater than 1% in any time step, this is cause for concern.
When ModelMonitor is closed, the listing file will open in Notepad. Near the end of the listing file, MODFLOW will list the simulated values at the three observation wells. Compare those values to the observed values. If desired, it is possible to copy those values into the Observations spreadsheet and graph them together with the observed values to check their similarity.
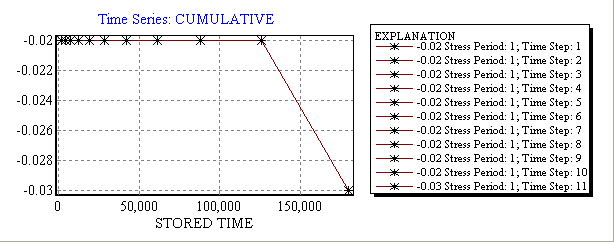
Another way to check the budget error in the model is by using GW_Chart. The listing file contains the volumetric budget for the model for each time step. Both the cumulative percent discrepancy and the percent discrepancy for the stress period are listed in the volumetric budget. It would be possible to check the budgets for all the time steps by looking at the list file but GW_Chart makes that easier. Start GW_Chart. (GW_Chart, can be obtained from http://water.usgs.gov/nrp/gwsoftware/GW_Chart/GW_Chart.html). In the GW_Chart menu, change the Chart Type to Water Budgets. Then change Read Data From to MODFLOW. Select File|Open and select the list file for your model. Uncheck all the check boxes except the one for Percent Discrepancy. The plot should be similar to the one in figure 136. Then change Zone from Cumulative to Rates to see a plot of the percent discrepancy for each time step. Next try unchecking the Percent Discrepancy checkbox and checking the Storage and River Leakage checkboxes under "In" Budget Items. Observe how the amount of water derived from the river increases over time.

Figure 136. Plot of percent discrepancy versus time generated by GW_Chart.
ModelMuse allows the user to import your model results but Model Viewer provides more options for viewing the data. (Model Viewer can be obtained from http://water.usgs.gov/nrp/gwsoftware/modelviewer/ModelViewer.html.) The following instructions show how to animate the model results with Model Viewer.
Start Model Viewer. Select File|New... Set the type of model to MODFLOW-2000/2005 and click OK. Click the Browse button for the name file, select the name file for your model and click the OK button. In the Data Selection dialog box click the OK button. Select Show|Solid. Select Toolbox|Animation and click the Run button.