Some of the objects that were imported from the DXF file define zones of different thickness in the aquifer. However, those objects are discontinuous. They will need to be merged into single objects in order to be used. The key in the DXF file indicates what the different colors of objects represents.
Color |
Thickness |
green |
10 ft |
blue |
20 ft |
aqua |
40 ft |
The colored grid makes it a little difficult to see the objects so it is helpful to hide the grid. First turn off the grid coloring by selecting Data|Color Grid...  , select "none" and click the Apply button. Then click on the Show 2-D gridlines button
  and select
  Show exterior. The grid lines in the 2-D view will disappear except for those that show the selected column, row, and layer.
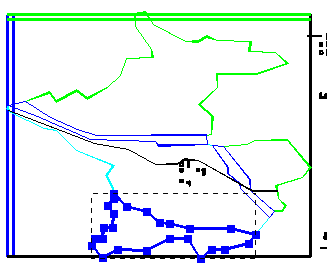
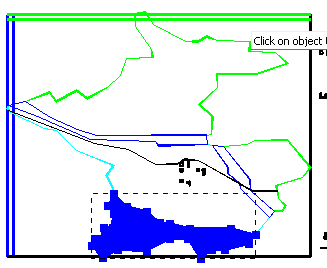
Next select the two blue objects near the south end of the model. (Click on the first one to select it then hold down the Shift key and click on the second one.) Then right click on the top view of the model and select Merge objects... to merge the objects (fig. 124). Hide the object after the objects have been merged.
 |
 |
A |
B |
Figure 124. Objects (A) before and (B) after merging. |
|
Repeat the process with the other blue objects and then with the green objects (figs. 125-126.).
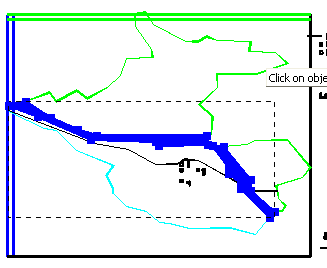
Figure 125. Additional blue objects after being merged.
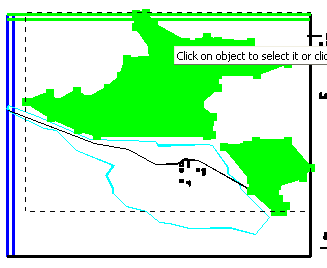
Figure 126. Green objects after being merged
Finally, repeat the process with the aqua objects( figs. 127-128). There is one very short section of aqua objects that is easy to miss (fig. 127). Be sure to get it.
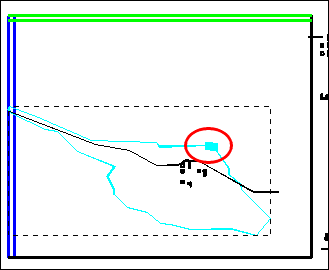
Figure 127. Small aqua-colored object selected.
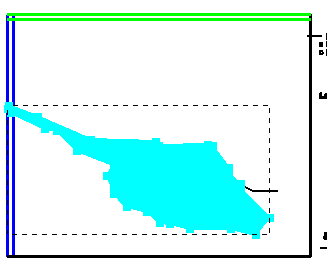
Figure 128. Aqua-colored objects merged.
Finally, click the Show or hide objects button  . Click on All Objects twice to show all the objects. Then uncheck on Set Grid Cell Size to hide the domain outline. The final result is illustrated in figure 129.
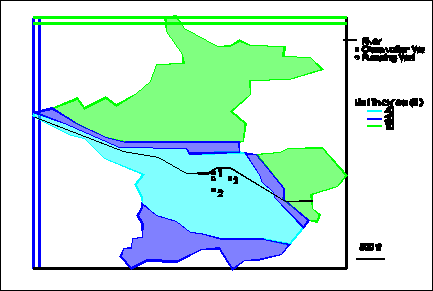
Figure 129. All merged objects.