|
Water Supply: Assigning Bottom Elevations |
|
Water Supply: Assigning Bottom Elevations |
In this model, the top of the aquifer is arbitrarily set at zero and the bottom of the aquifer is set so that the thickness of the aquifer is correct.
Double-click on each of the objects that is meant to set the thickness of the aquifer. Assign each one a meaningful new name. For each one check the Set values of enclosed cells checkbox. Then go to the Data Sets tab and select the Aquifer_Bottom data set (found under Required|Layer Definition). For the green objects set the formula to -10. For the blue objects, set the formula to -20. For the aqua object, set the formula to -40. Finally select Data|Edit Data Sets... and change the default formula for Aquifer_Bottom to -5.
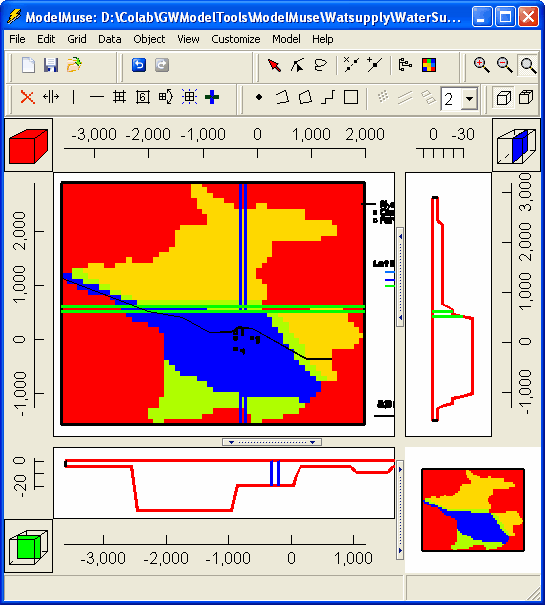
Try coloring the grid with the Aquifer_Bottom data set (fig. 130). (Use the Color Grid pane of the Data Visualization dialog box as was done before.) Try changing the Color adjustment so that the distribution of colors in the preview is satisfactory. Then click the apply button. Figure 130 was made after hiding all the objects and after setting the Color adjustment to 0.30. However, the appearance will vary from monitor to monitor so each user may need to use a different value. To see cross sections of the model, use the Selection cubes with the blue and green squares to change the selected row or column. The cross sections will appear on the front and side views of the model. Turn off coloring the grid when you are done by selecting "None" instead of "Aquifer_Bottom" in the the Color Grid pane of the Data Visualization dialog box.

Figure 130. Grid for Water Supply problem colored with the Aquifer_Bottom data set.