Vectors Pane |
Vectors Pane |
The Vectors pane is on the Data Visualization dialog box. It can only be used with SUTRA models. It is used to either display velocity vectors or the vectors for the maximum, middle, and minimum for permeability, hydraulic conductivity, longitudinal dispersivity or transverse dispersivity.
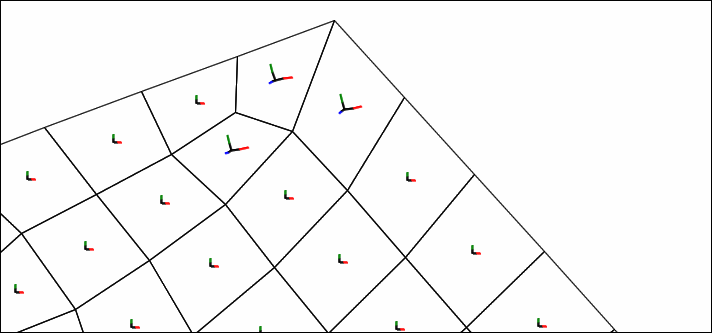
You choose the type of vector to plot in the Vector source combo box. To plot velocity vectors, you must first import the velocities via the Import SUTRA Model Results dialog box. If you import all the available velocity components for a time step, the velocities for that time step will be included in the Vector source combo box. The Scaling factor (2D) and Scaling factor (3D) can be used to control the length of the vectors on the two- and three-dimensional views respectively. Each vector type has a separate color that can be specified by the user as in the hydraulic conductivity vectors illustrated below. The first half of each vector is colored black and the other half is colored with the color specified by the user.

Hydraulic conductivity vectors. Red: maximum. Green: middle. Blue: minimum.