RmaMf2005: Visualize Modified Model Input |
RmaMf2005: Visualize Modified Model Input |
After running PEST, you can copy the model files to a new directory and then import the modified model into a new instance of ModelMuse and visual the modified hydraulic conductivity distribution and pumping rate. (Importing a model causes ModelMuse to overwrite the model output files so copy the files to a new directory to prevent that from happening.)
In the modified model the combined estimated pumping rates of the two wells making up the seepage pond is 0.023 m3/s which is less than the actual pumping rate of 0.025 m3/s.
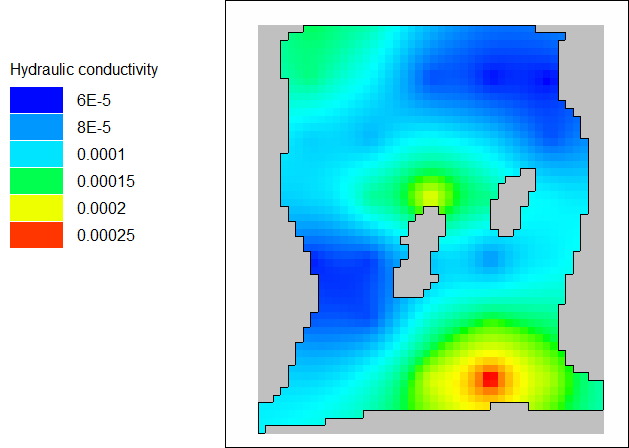
A diagram of the estimated distribution of Kx is shown below.

Diagram displaying the estimated distribution of Kx.
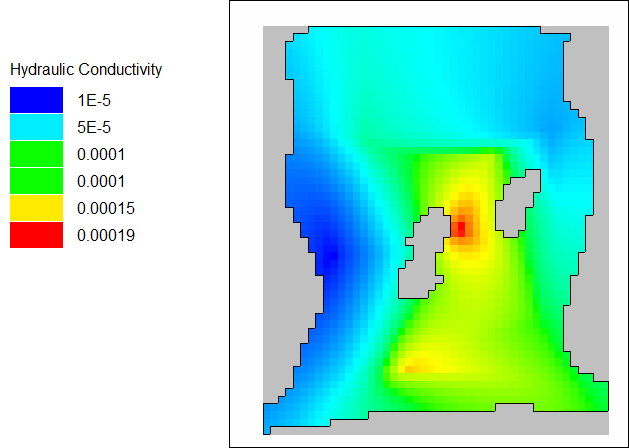
The true distribution from the model used to generate the observed values for the parameter estimation exercise is shown below.

Diagram displaying the true distribution of Kx.
The true hydraulic conductivity distribution has more extreme hydraulic conductivities than any of the estimated hydraulic conductivities.