RMA: Animating the MT3DMS Results |


RMA: Animating the MT3DMS Results |
 Scroll to Top of Page
 Print Topic
 Show/Hide Expanders
It can be interesting the animate the contours of the concentration. First select Data|Data Visualization and contour the first concentration data set. Then Set the Contour interval to 50. and click Apply.
Then click the Specify contours check box and then click the Edit contours button. In the Specify Contours dialog box, delete the 0 and 1000 contours. Select the Retain limits and legend option. Click Apply.
Next select File|Export|Image or click the Export Image button  .
.
On the Text pane, add the following as the Title
Transport Step: %TrS
Elapsed Time: %ET
This will display the transport step and elapsed time in the title. There is more information on this subject in the help.
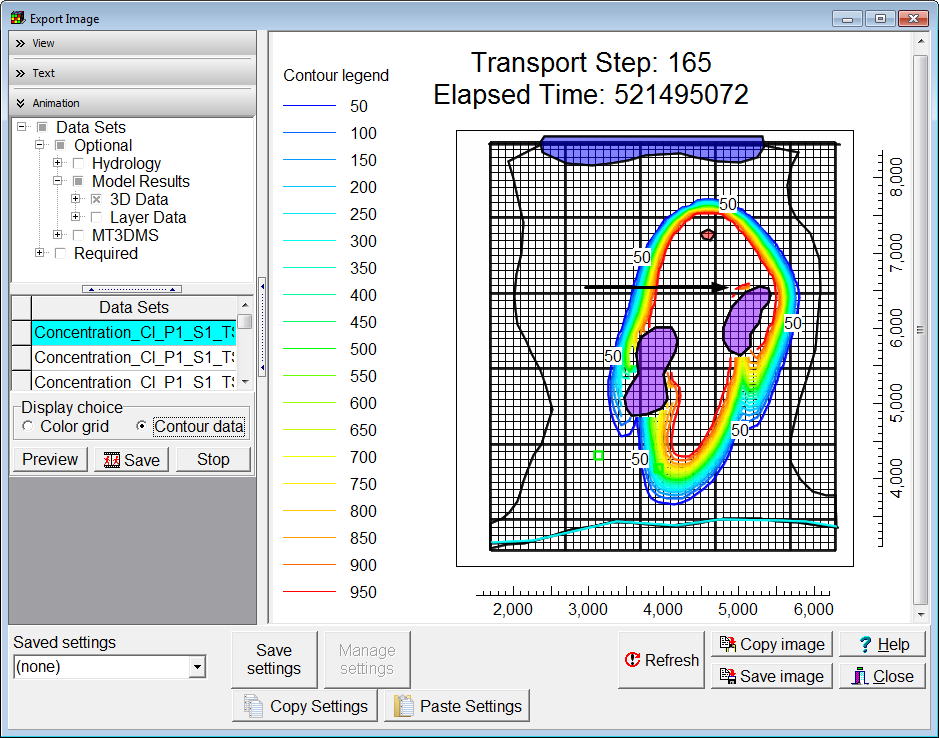
On the Animation pane, select all the data sets under the Optional|Model Results|3D Data. then click the Preview button. Notice around transport step 160 that high concentrations of solute remain trapped near a stagnation point as shown in the second illustration.