Riparian ET Plant Groups Dialog Box |
Riparian ET Plant Groups Dialog Box |
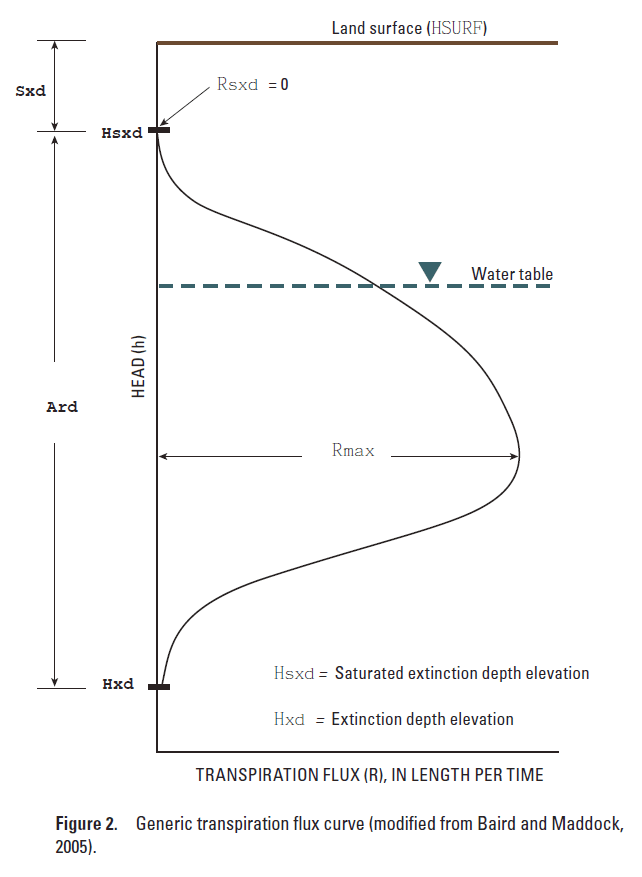
The Riparian ET Plant Groups dialog box is used to define the transpiration curves of riparian plant groups in the Riparian Evapotranspiration package. The Riparian Evapotranspiration package is included in MODFLOW-OWHM. The transpiration curve is used to define the rate of evapotranspiration fram the saturated zone as a function of head. Unlike the Evapotranspiration or Evapotranspiration Segments packages, the rate of evapotranspiration may decrease with increasing head in the Riparian Evapotranspiration package. This is because too high a water table can cause plant roots to become oxygen deficient.
The locations where each plant group exists is defined using Objects.
The left side of the dialog box contains a list of the riparian plant groups. When the user selects a plant group from the list, its properties appear in the two tabs on the right: the Properties tab, and the Transpiration Rate Curve tab.
The Properties tab is used to define the name and several values that determine overall size of the transpiration curve.
•Name (RIPNM) is a name for the riparian plant group. It may be up to 24 characters in length. Spaces are allowed.
•Saturated extinction depth (Sxd) is the distance from the land surface to the elevation at which transpiration is at a minimum due to saturation. Negative values represent a water table that is above the land surface.
•Active root depth (Ard) is the distance between the elevation where transpiration is at a minimum due to saturation and the elevation where transpiration is at a minimum due to too low a water table.
•Max ET flux (Rmax) is the maximum rate of evapotranspiration in units of Length/Time.
•Evaporative flux at saturated extinction depth (Rsxd) is the rate of evaporation (or evapotranspiration) when the evapotranspiration is at a minimum due to saturation. In the illustration, Rsxd is zero but it could be a positive number.
 |
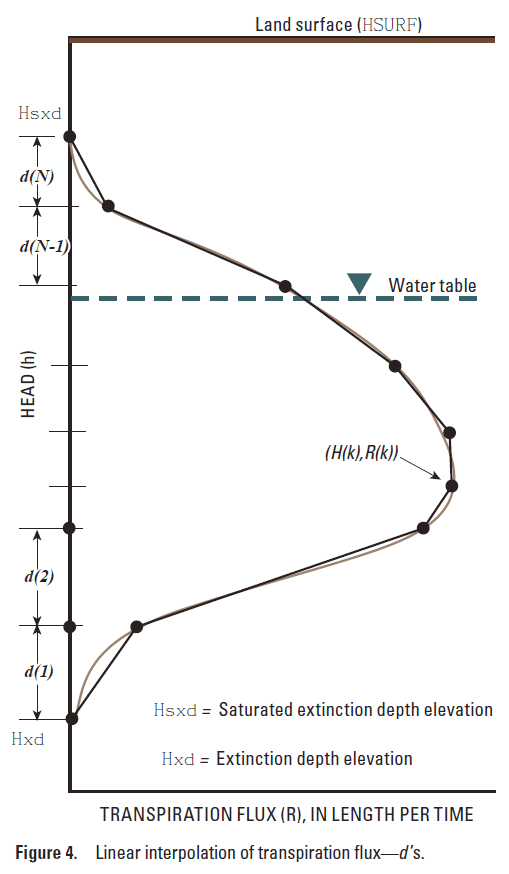
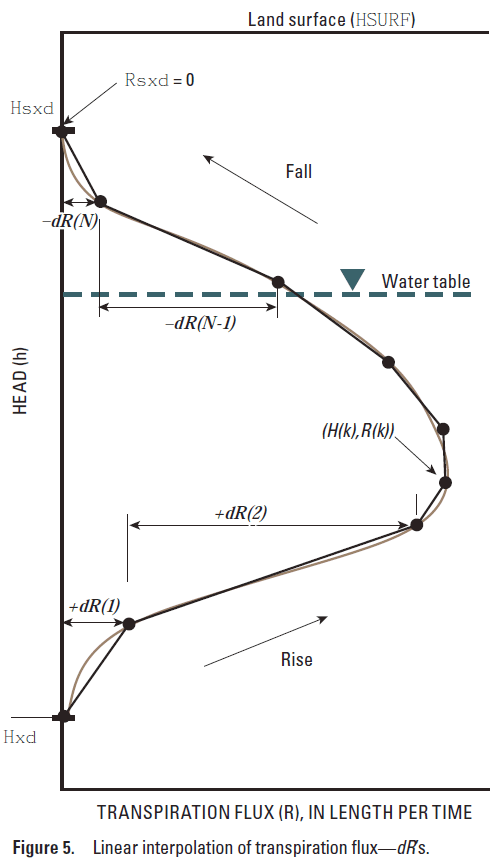
The Transpiration Rate Curve tab is used to define the shape of the transpiration curve. The tab has a table with columns labeled Dimensionless active root depth segment (fdh) and Dimensionless flux segment (fdR). Each row in the table defines one segment of the transpiration curve.
•Dimensionless active root depth segment (fdh) represents the length of the segment in the vertical elevation (Y) direction. The sum of the dimensionless depth segments should be equal to 1.
•Dimensionless flux segment (fdR) represents the length of the segment in the transpiration rate (X) direction. The highest total rate of dimensionless flux should be equal to 1.
A graph of the transpiration curve is plotted to the right of the table.
  Illustratoin of fdR |