In this model, the top surface of the model slopes from an elevation on the left of 500 m to an elevation of the right or 450 m. We will use interpolation to assign the slope of the top surface.
1.Select the "Create straight-line object" button  and click somewhere in the first column. Then double click in the last column to create and object that goes from left to right across the grid. The Object Properties dialog box will appear. For now, just click the OK button to close the dialog box.
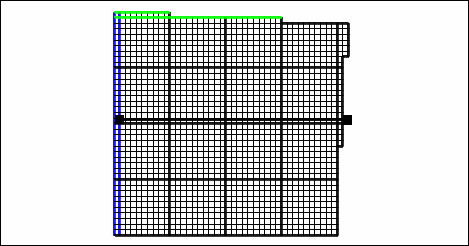
Object defining a straight-line across the top of the grid.
2.Now select the "Edit vertex values" button  and double-click on the vertex on the object on left side of the grid. The Vertex Values dialog box will appear. In it, specify "Top" as the key and "500" as the value. This will associate the value 500 with this vertex of the object. Click OK to close the dialog box. Notice that the vertex is now displayed as a diamond rather than a square. This indicates that one of more vertex values are associated with this object.
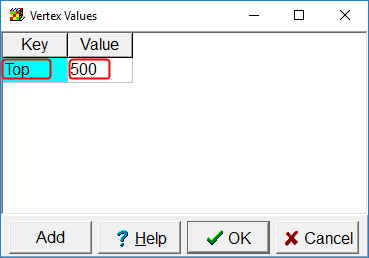
Vertex Values dialog box
3.Now double-click on the vertex on the right side of the grid. The Vertex Values dialog box will appear again. "Top" will already be specified as the key. This time specify the value as 450. Click OK to close the dialog box.
4.Now click the "Select objects" button  and double-click on the object we have just been working with to open it in the Object Properties dialog box.
5.We are going to use this object to specify the elevation of the top surface of the model. However, only objects that have zero Z formulas can be used to edit the properties of the data sets that define the layer elevations. The reason for that is because if the object has either one or two Z formulas, the object will depend on the elevations of the model layers which is the very thing that the object is being used to specify. Therefore, set the number of Z formulas to zero. For convenience, change the name of the object to "Model_Top_Slope."
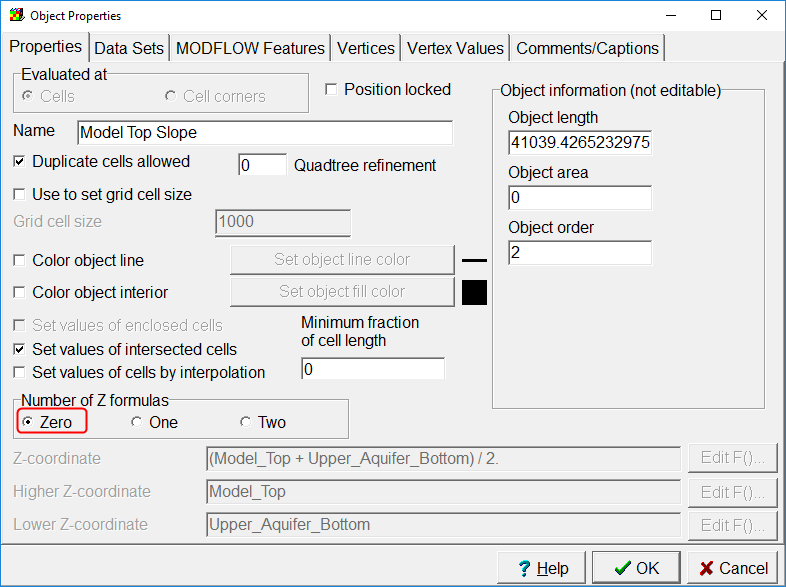
Object Properties dialog box with the number of Z formulas set to zero.
6.Now switch to the "Data Sets" tab, expand "Required|Layer Definition," and check the check box for the "Model_Top" data set. By default, the formula for the Model_Top is set to 500 because that's what we specified when we originally created the grid.
7.Above the edit box for the formula is a button labeled "Edit F()." This will open the Formula Editor. In the list at the right, expand "Functions|Object_VertexValues" and double-click on "InterpolatedVertexValue" to insert it into the formula edit box. In the formula replace "Key" with "Top." Be sure to enclose "Top" in double-quotes in the formula. Recall that "Top" was the name of the key we specified earlier in the Vertex Values dialog box. To find out more about the InterpolatedVertexValue function, select it on the list at the right and then click on the "Function Help" button which will open the ModelMuse help with a description of the function. Click OK to close the Formula Editor. Then click OK in the Object Properties dialog box to close it too.
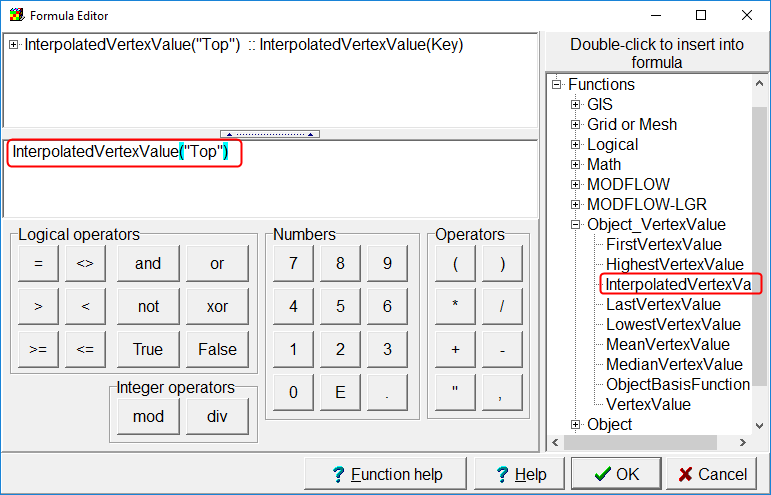
Formula Editor with "InterpolatedVertexValue("Top") specified as the formula
8.To see how what we have done has affected the top of the grid, click the "Data visualization" button  . Select "Color Grid" on the left and select the Model_Top data set. Then click the Apply button.
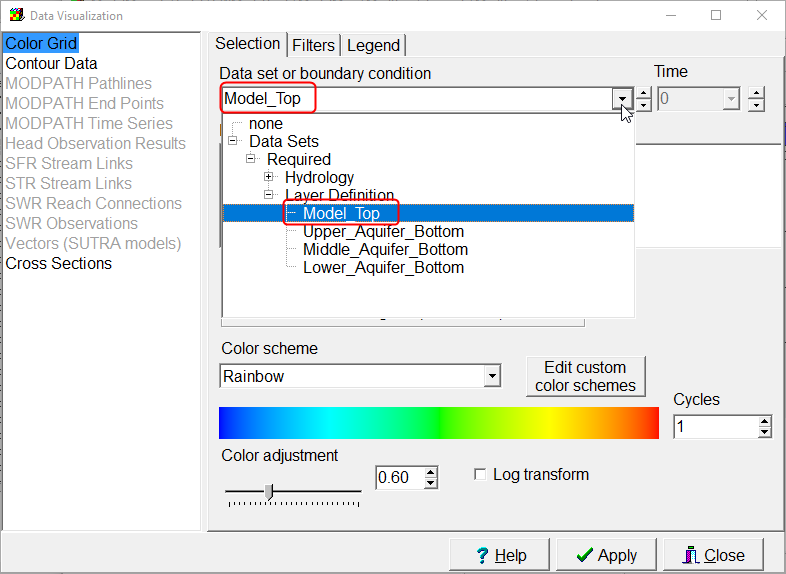
Specifying the Model_Top as the data set used to color the grid.
9.The result is only part way to what we want. In the cells, intersected by the object, the top of the model slopes from left to right but the rest of the model has a uniform elevation of 500. You can see the elevation for any cell on the status bar if you move the cursor over the cell.
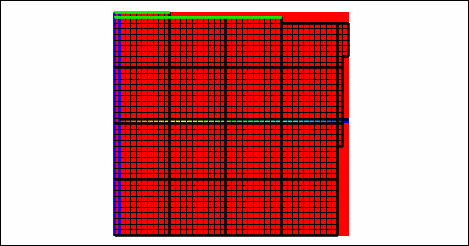
Visualization of the elevation of the top of the model.
10.To specify the elevations of the rest of the cells, we need to apply interpolation for the entire data set. To do that select "Data|Edit Data Sets" and select the "Model_Top" data set. Set its interpolation method to "Nearest" and click the Apply and Close buttons. To find out more about interpolation methods, see Interpolation Methods.
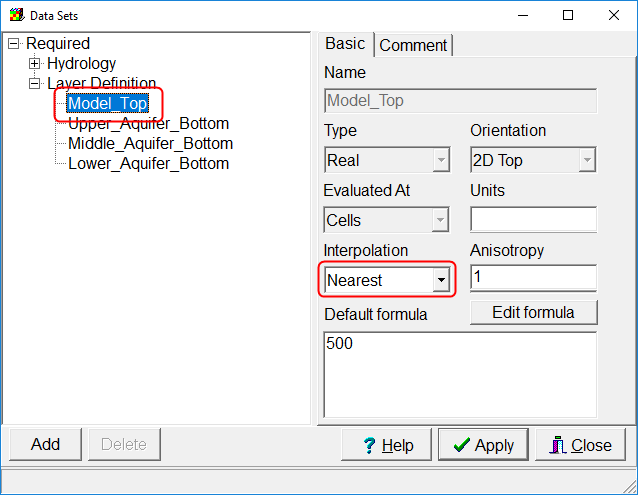
Specifying the "Nearest" interpolation method for the Model_Top data set.
11.This doesn't change the values of the Model_Top data set - at least not yet. Now double click on the Model_Top_Slope object to open it in the Object Properties dialog box again. In it uncheck the "Set values of intersected cells" and check "Set values of cells by interpolation." Click the OK button.
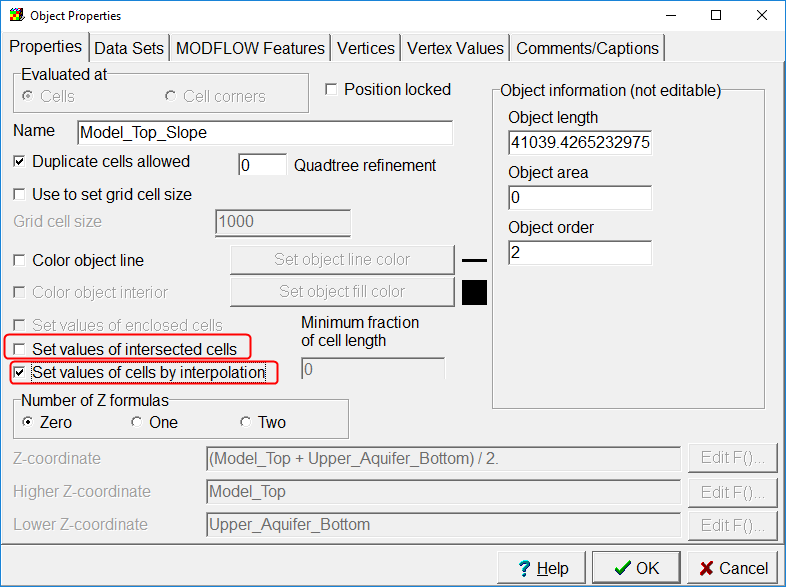
Changing the Model_Top_Slope object to set values by interpolation.
12.Now the top of the model slopes to the right the way we want it to slope.
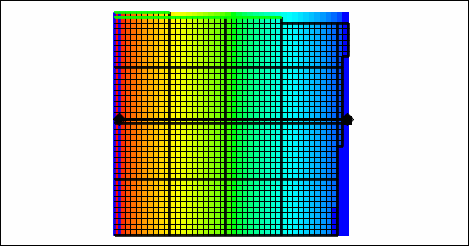
Elevation of the top of the model.