How do I plot head, drawdown or concentration vs. time? |


How do I plot head, drawdown or concentration vs. time? |
 Scroll to Top of Page
 Print Topic
 Show/Hide Expanders
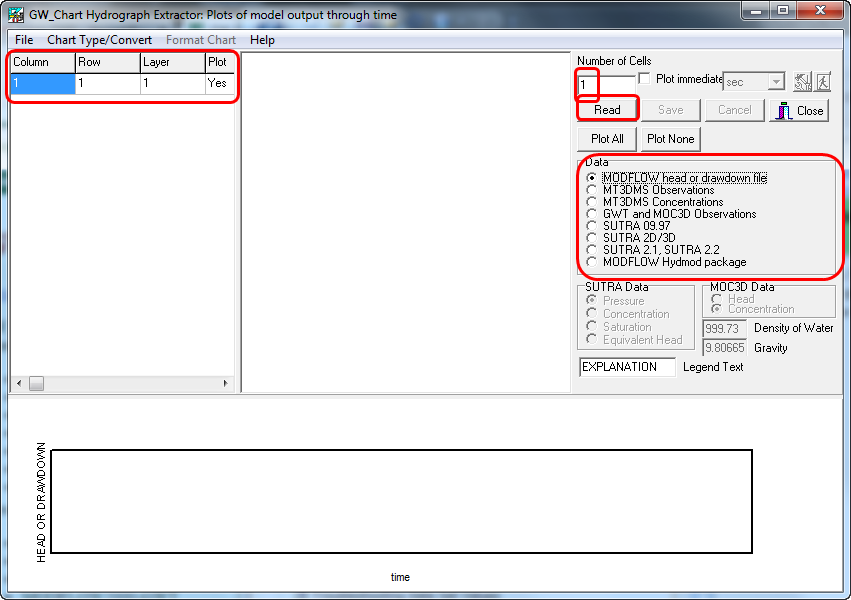
A separate program, GW_Chart, can be used to plot a number of types of data vs. time. GW_Chart is available from https://water.usgs.gov/nrp/gwsoftware/GW_Chart/GW_Chart.html. To plot the data, first select Chart Type/Convert|Hydrographs. Then select the type of data, such as a MODFLOW head or drawdown file and other required data such as the column, row, and layer number. Finally, click the Read button to select the file and make the plot.