|
HFB: Horizontal Flow Barrier Package Pane |
|
HFB: Horizontal Flow Barrier Package Pane |
The HFB: Horizontal Flow Barrier package pane is on the MODFLOW Features tab of the Object Properties dialog box. This pane is only visible if the HFB package is selected and a polyline or polygon object is being edited.
The data that can be specified on this pane include the Parameter name (if any), the Barrier hydraulic conductivity (or Barrier hydraulic conductivity factor), the Barrier thickness and the Angle adjustment method.
In MODFLOW 6 models, barriers can change in each stress period. In earlier versions of MODFLOW barriers are specified for the entire duration of the model. the layout of this pane varies depending on whether MODFLOW 6 or an earlier version of MODFLOW is selected.
The Parameter name can be set to either "none" or the names of one of the HFB parameters specified in the MODFLOW Packages and Programs dialog box.
The Barrier hydraulic conductivity and Barrier thickness are used to calculate the hydraulic characteristic of the horizontal-flow barrier. The hydraulic characteristic determines how much resistance to flow the barrier provides. The hydraulic characteristic is the hydraulic conductivity of the barrier divided by its thickness. If an HFB parameter is being used to help specify the hydraulic characteristic, the barrier hydraulic conductivity will be set equal to the Barrier hydraulic conductivity factor times the parameter value specified in the MODFLOW Packages and Programs dialog box.
Setting up the flow barrier properly can be a little tricky if the barriers are not aligned with the grid. The Angle adjustment method provides a method for adjusting the hydraulic characteristic when the barrier is not aligned with the grid.
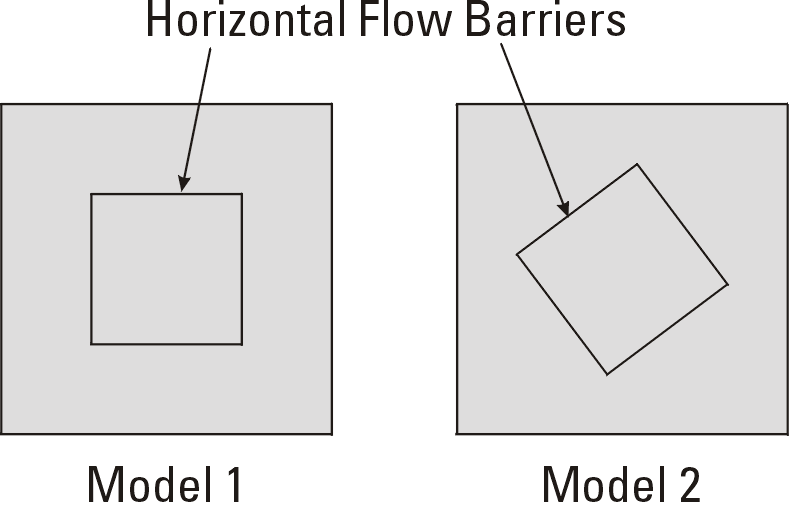
The problem is illustrated in the figure 30 below. The only difference between the two models is that in one the area surrounded by the horizontal-flow barrier is rotated 36 degrees. However, when the models were executed, the leakage through the flow barrier in model 2 was much higher than it was in model 1.
 |
Figure 30. Two models that differ only in the orientation of the area surrounded by a horizontal-flow barrier. |
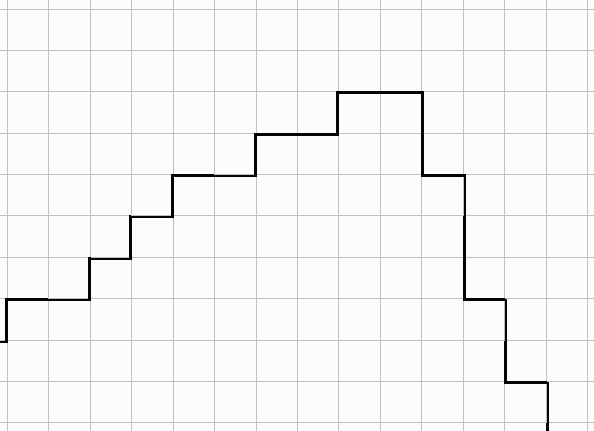
If model 2 is examined more closely, as illustrated in figure 31 below, the problem is evident. MODFLOW doesn't have any way to specify a flow barrier that is at an angle to the grid so the flow barrier must be approximated by a zigzag line of flow barriers. The total length of the flow barriers in the model is thus much longer than the angled flow barrier they represent. Thus, there is more area through which flow could occur in the numerical model than in the conceptual model.
 |
Figure 31. Close up of a section of the horizontal-flow barrier in model 2. |
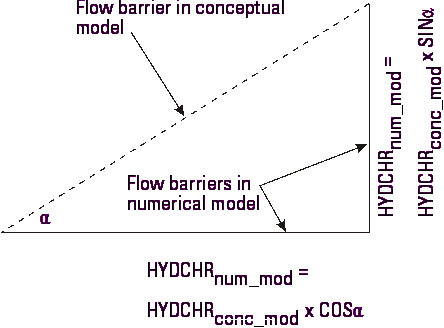
To compensate for the excessive flow barrier length in the numerical model, the hydraulic characteristic of the barriers (HYDCHR) can be reduced by a factor of Sin(a) or Cos(a) as illustrated in figure 32. This method corresponds to the choice Distribute conductivity among all sections in ModelMuse.
 |
Figure 32. How to calculate the reduction of HYDCHR when the horizontal-flow barriers are at an angle to the grid. HYDCHRnum_mod = Hydraulic characteristic of numerical model. HYDCHRconc_mod = Hydraulic characteristic of conceptual model. |
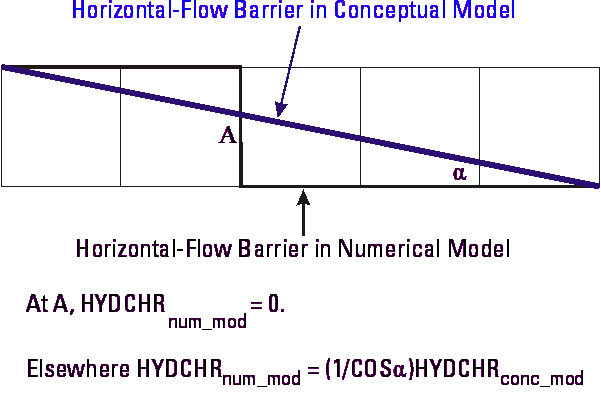
Another problem can occur if the barrier is nearly parallel with the grid. In the conceptual model, in the illustration below, the horizontal-flow barrier is at a small angle with the grid resulting in six horizontal-flow barriers. Of the five cells on the downstream side of the barriers, four receive flow from one cell each and the fifth receives flow from two cells. The net result is that the cell that receives flow from two cells, receives too much flow and the other cells receive too little. The total amount of flow is correct (assuming that the hydraulic gradient across the flow barrier is the same everywhere) but the location of flow is not quite correct. One way we could correct the flow locations is to give the barrier at "A" in figure 33 a hydraulic characteristic of 0. The hydraulic characteristics of the other barriers would be multiplied by 1/Cos(α) to compensate for their shorter length. This results in all the downstream cells receiving the same amount of flow and makes the total amount of flow correct. There is no flow across the barrier at A. This method of adjusting the hydraulic characteristic corresponds to the choice Distribute conductivity among sections most nearly parallel to the grid in ModelMuse.
 |
Figure 33. Another method to calculate HYDCHR. |