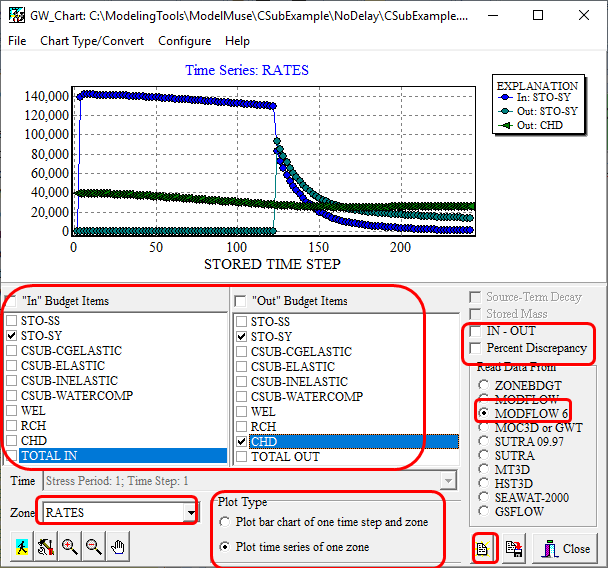
There are some other tools that can be helpful for viewing the CSUB output. First of all, there are other ways of using GW_Chart. For example, select Chart Type/Convert|Water Budgets, set Read Data From to MODFLOW 6, and click the Open File button  . Select the MODFLOW 6 Listing file. GW_Chart will initially plot all the CUMULATIVE amounts. You can change CUMULATIVE to RATES and select the budget terms that are of most interest to you.

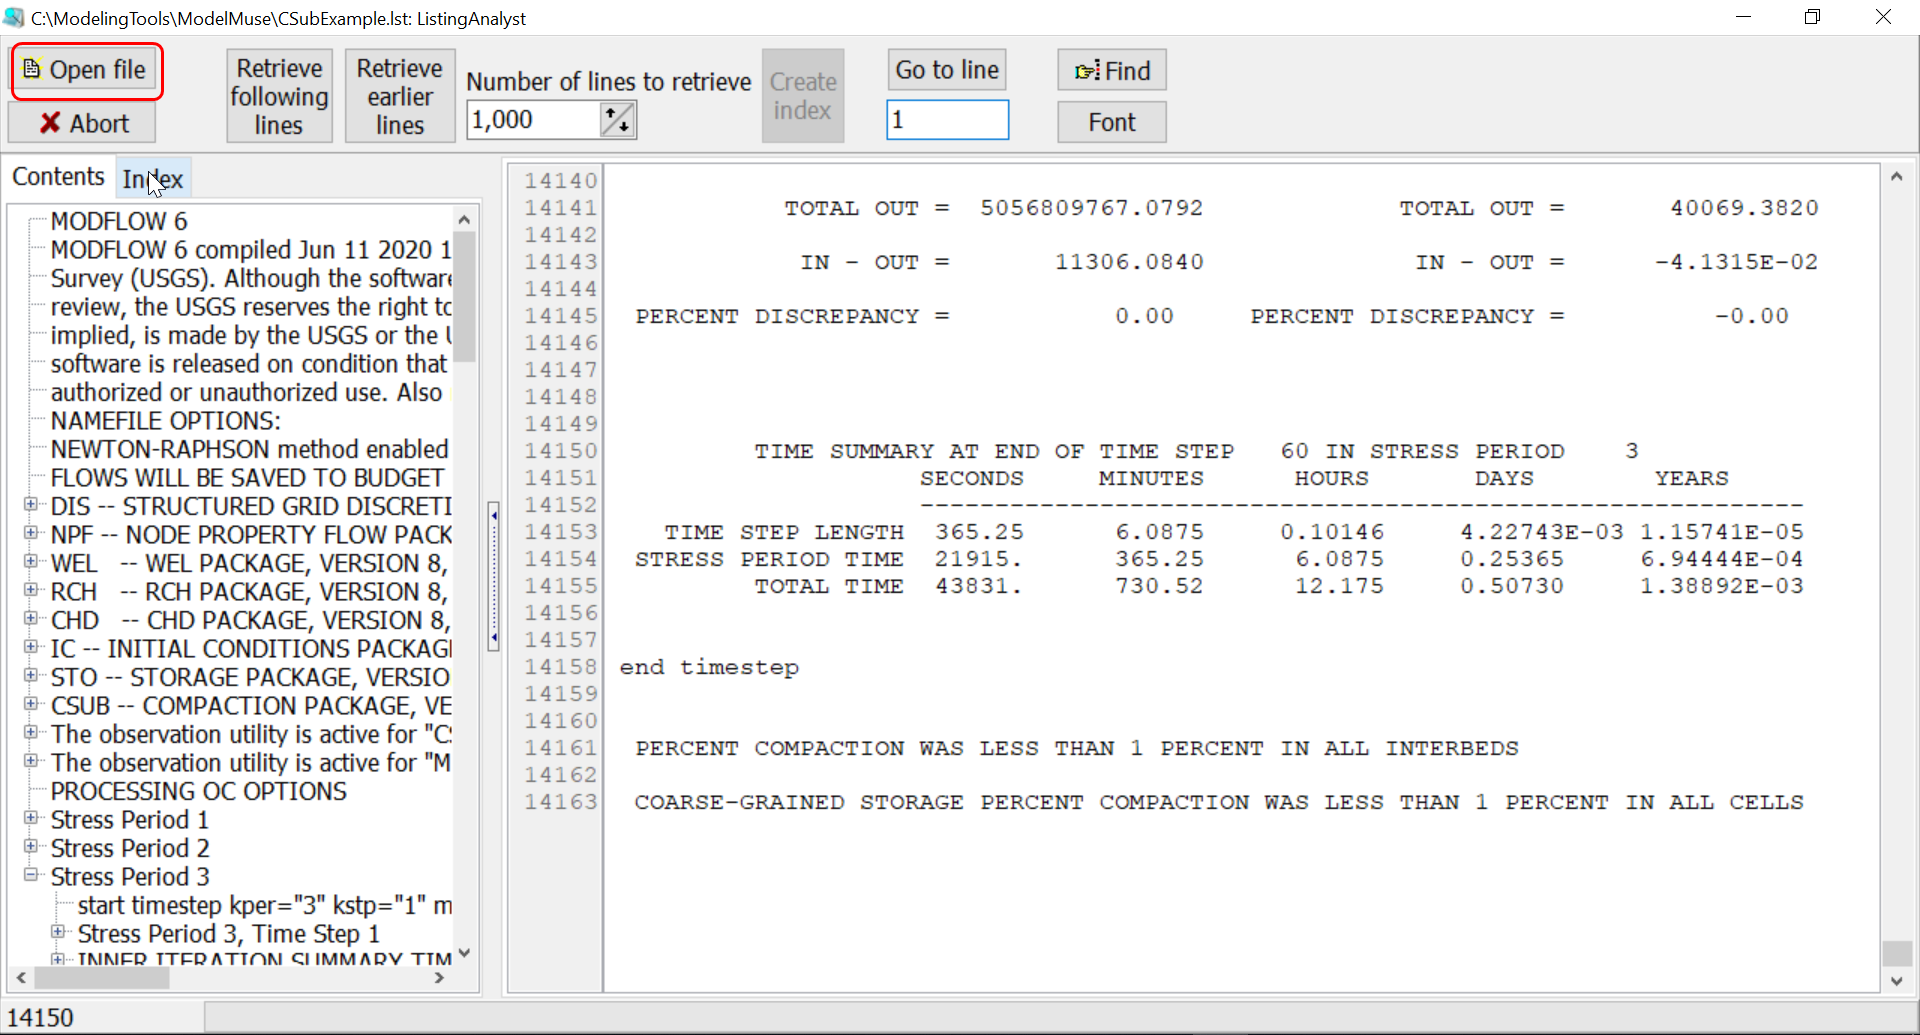
Another tool you can use is ListingAnalyst. It produces what is essentially a table of contents and index of the MODFLOW listing file. Just click the Open file button and select the listing file.
