CSUB Example: CSUB Observation Results |
CSUB Example: CSUB Observation Results |
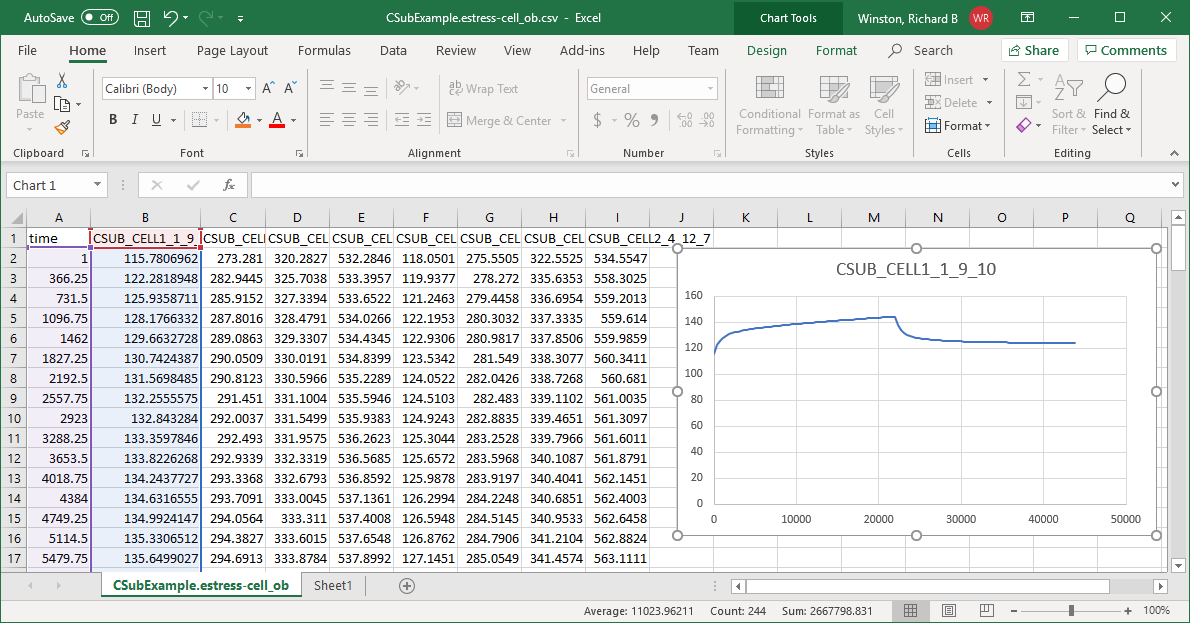
We specified a number of CSUB observations in the Observation Utilities option in MODFLOW 6. The simulated value for each observation type are saved in text files with the extension .csv. These files can be opened in text editors or spreadsheet programs. If opened in spreadsheet programs, the data can easily be separated into separate columns in the spreadsheet and easily plotted. For example, in csubexamples.pdf, figure 15 shows the preconsolidation sterss, effective stress, and geostatic stress in two cells. The data for those cell are included in files with the extensions .preconstress-cell_ob.csv (preconsolidations stress) .estress-cell_ob.csv (effective stress), and .gstress-cell_ob.csv (geostatic stress). You can plot the values at specific cells versus time using the spreadsheet plotting capability. Note that the label for each observation can help identify the location of the observation. In this case. the "1_9_10" in the name indicates that the observation is in layer 1, row 9, column 10.

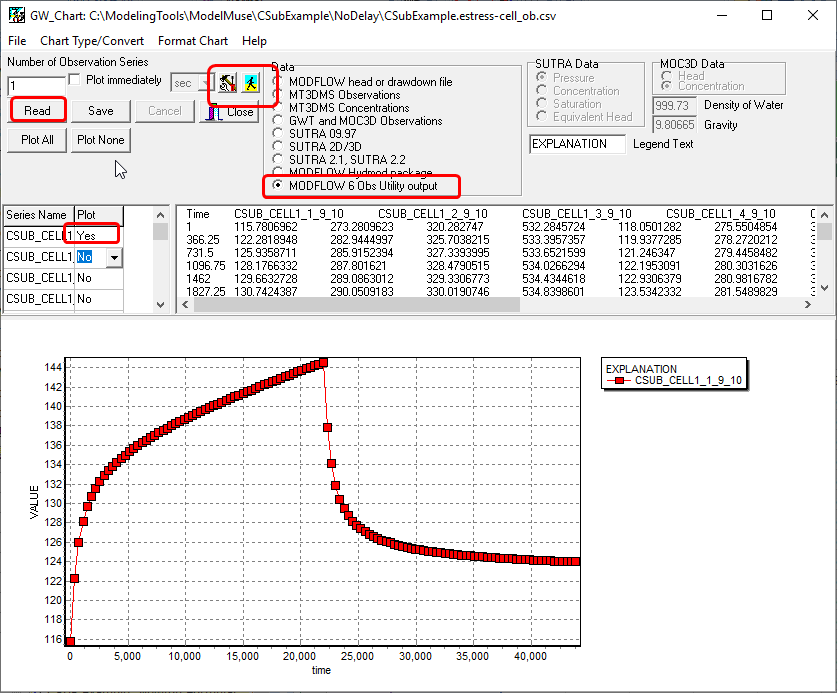
You can also use GW_Chart to graph data from the MODFLOW 6 Observation Utility. To do so, first select Chart Type/Convert|Hydrographs from the menu. Then select the MODFLOW 6 Obs Utility radio button and click the Read button. Select the file for which you wish to display data. Next select "Yes" for any series that you want to plot. GW_Chart can plot data from both binary and text-based output files. The data is also shown in a text box in which values on a line are separated by tab characters. If this data is copied from the text box and pasted directly in a spreadsheet, each data value will be in a separate cell. The chart can be customized by clicking the Format Chart  button. The graph can be saved by clicking the Save as image
  button.

You can also plot the heads directly from the MODFLOW binary head file. To do that, you would select MODFLOW head or drawdown file as the source of the data, select the binary head file, and specify the cell for which you wished to plot data.