|
Boundary Conditions |
|
Boundary Conditions |
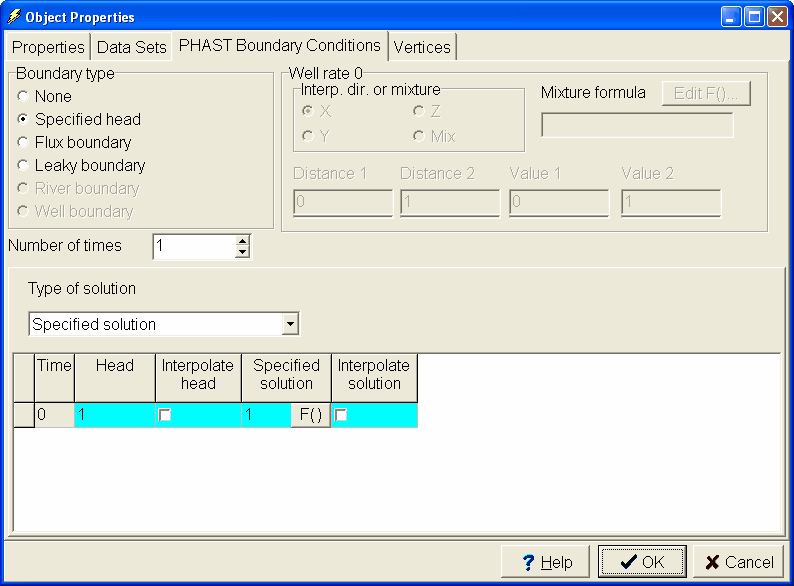
14.The next step is to define the specified head boundaries. On the side view of the model, draw a polygon completely surrounding the grid. In the Object Properties dialog box, select the Nodes radio button. Set the Name of the object to “Left_Specified_Head_Boundary”, and check the Set values of intersected nodes checkbox. Uncheck the Set value of enclosed nodes checkbox. Set Number of X formulas to One. Set the X-coordinate to 0. On the PHAST Boundary Conditions tab, select a Specified head boundary. Change the Type of solution to Specified solution. In the table enter a value of 1 for both Head and Specified solution (fig. 51). Click OK to close the dialog box.

Figure 51. Object Properties dialog box. specified-head boundary condition.
15.Now color the grid (Data|Data Visualization|Color Grid…) with the Specified_Head (under "Boundary Conditions|PHAST Specified Head"). The left end of the model should be specified head cells.
16.Right-click on the side view of the model and select Hide Selected Objects from the popup menu to hide the previous object. (The object must be selected.) Hiding an object does not deactivate it; it just makes the Working Area less cluttered. On the side view of the model, draw another polygon completely surrounding the grid. In the Object Properties dialog box, select the Nodes radio button. Set its name to “Right_Specified_Head_Boundary.” Check the Set values of intersected nodes checkbox. Uncheck the Set value of enclosed nodes checkbox. Set Number of X formulas to One. Set X-coordinate to 100. On the PHAST Boundary Conditions tab, select a Specified head boundary. Leave the Type of solution at Associated solution. In the table enter a value of 0 for Head and 1 for Associated solution. Click OK to close the dialog box. Now both the left and right ends of the model should be specified head boundaries.
17.Hide all the objects created so far by selecting Object|Show or Hide Objects… Then in the dialog box, uncheck the checkbox for All Objects. If desired, click Close to close the dialog box.
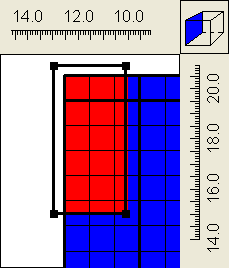
18.The next step is to create a specified concentration boundary on the left end of the model. On the side view of the model, draw another polygon. This should enclose only part of the grid. It should extend from approximately (Y’, Z) = (15, 10) to (21, 13) (fig. 52). In the Object Properties dialog box, select the Nodes radio button. Set its Name to “Specified_Concentration_Boundary.” Make sure that the Set values of enclosed nodes checkbox is checked. Set Number of X formulas to One. Change the X-coordinate to 0. On the PHAST Boundary Conditions tab, select a Specified head boundary. Change the Type of solution to Specified solution. In the table enter a value of 1 for Head and 2 for Specified solution. Click OK to close the dialog box. Now color the grid with the Specified_Head_Solution (fig. 52) (under "Boundary Conditions|PHAST Specified head"). The left end of the model should be specified head cells. The cells with a specified head solution of 1 will be colored red and those with a specified head solution of 0 will be colored blue.

Figure 52. Location of the specified concentration boundary. The grid has been colored by the specified head solution.