National Water-Quality Assessment
Web pages with photos:
http://www.istockphoto.com
http://photogallery.nrcs.usda.gov/
http://libraryphoto.cr.usgs.gov/
http://gallery.usgs.gov/collections.asp
http://www.chesapeakebay.net/photos.aspx?menuitem=16851
Photo credits: Photos_captions_credits.pdf
Some credits may have more detail than shown in the report (sometimes the author name didn’t quite make it into print).
Cover
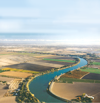 |
Cover: Cover_Sacramento-scan-place.tif. Aerial view of the Sacramento River in the Sacramento Valley, California. Credit: Photograph taken by Ran Schall, PhD., pilot and photographer. |
Chapter 2
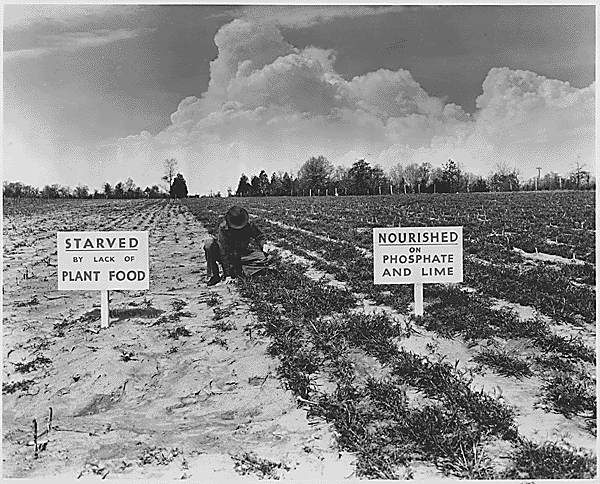 |
Page 21: TVA: chapter2_TVA_Results_of_Fertilizer.gif. No caption. Credit: Photograph from Franklin D. Roosevelt Presidential Library Museum |
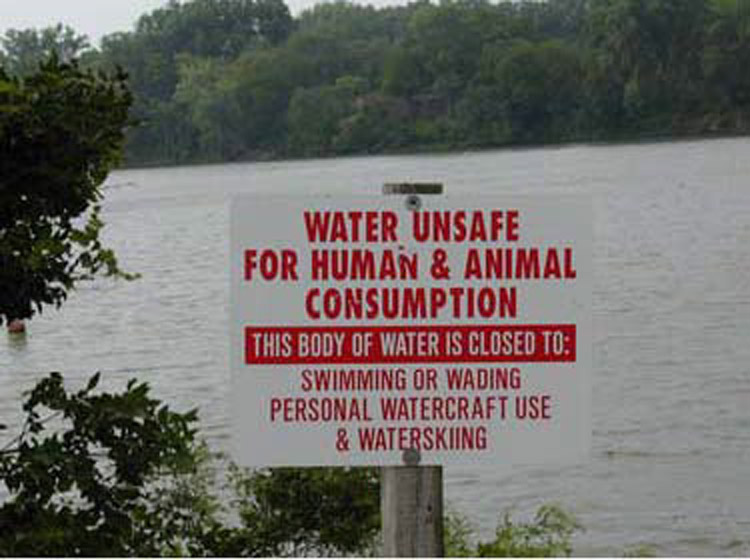 |
Page 22: chapter2_Photo_2-2.jpg. Caption: In Nebraska, the Department of Environmental Quality posts health alerts to warn residents when algal toxins in lakes reach levels that make them unfit for recreational activities. Photograph courtesy of Tadd Barrow, University of Nebraska, Lincoln. |
 |
Page 23: chapter2_Photo_2-1.ai. Caption: Fish kill associated with a bloom of the golden algae, Prymnesium parvam, on Lake Whitney in Texas forms a silver band of dead fish along the shoreline. Photograph courtesy of Joan Glass, Texas Parks and Wildlife Department, from Lopez and others (2008). |
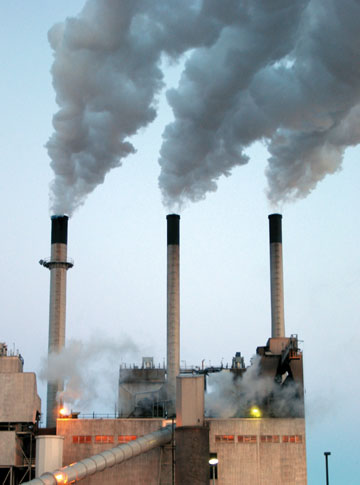 |
Page 25: coalplant.jpg. Caption: Coal-fired power plants are sources of nitrogen in atmospheric deposition. Photograph by U.S. Geological Survey. |
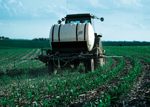 |
Page 26: NRCSIA99240.tiff. Caption: Fertilizer is used extensively in corn and soybean growing areas of Iowa. Photograph by Lynn Betts, U.S. Department of Agriculture, Natural Resources Conservation Service. |
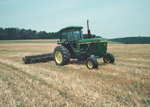 |
Page 33: NRCSMD80006.tiff. Caption: Conservation tillage allows for double-cropping of soybeans in the residue left by winter wheat, yielding two crops during a single growing season and protecting the land from erosion. Photograph by Joseph Larson, U.S. Department of Agriculture, Natural Resources Conservation Service. |
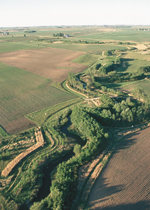 |
Page 33: NRCSIA00040.tiff. Caption: Multiple rows of trees and shrubs, as well as a native grass strip, combine in a riparian conservation buffer to protect Bear Creek in Story County, Iowa. The buffer is a nationally designated demonstration area for riparian buffers. Photograph by Lynn Betts, U.S. Department of Agriculture, Natural Resources Conservation Service |
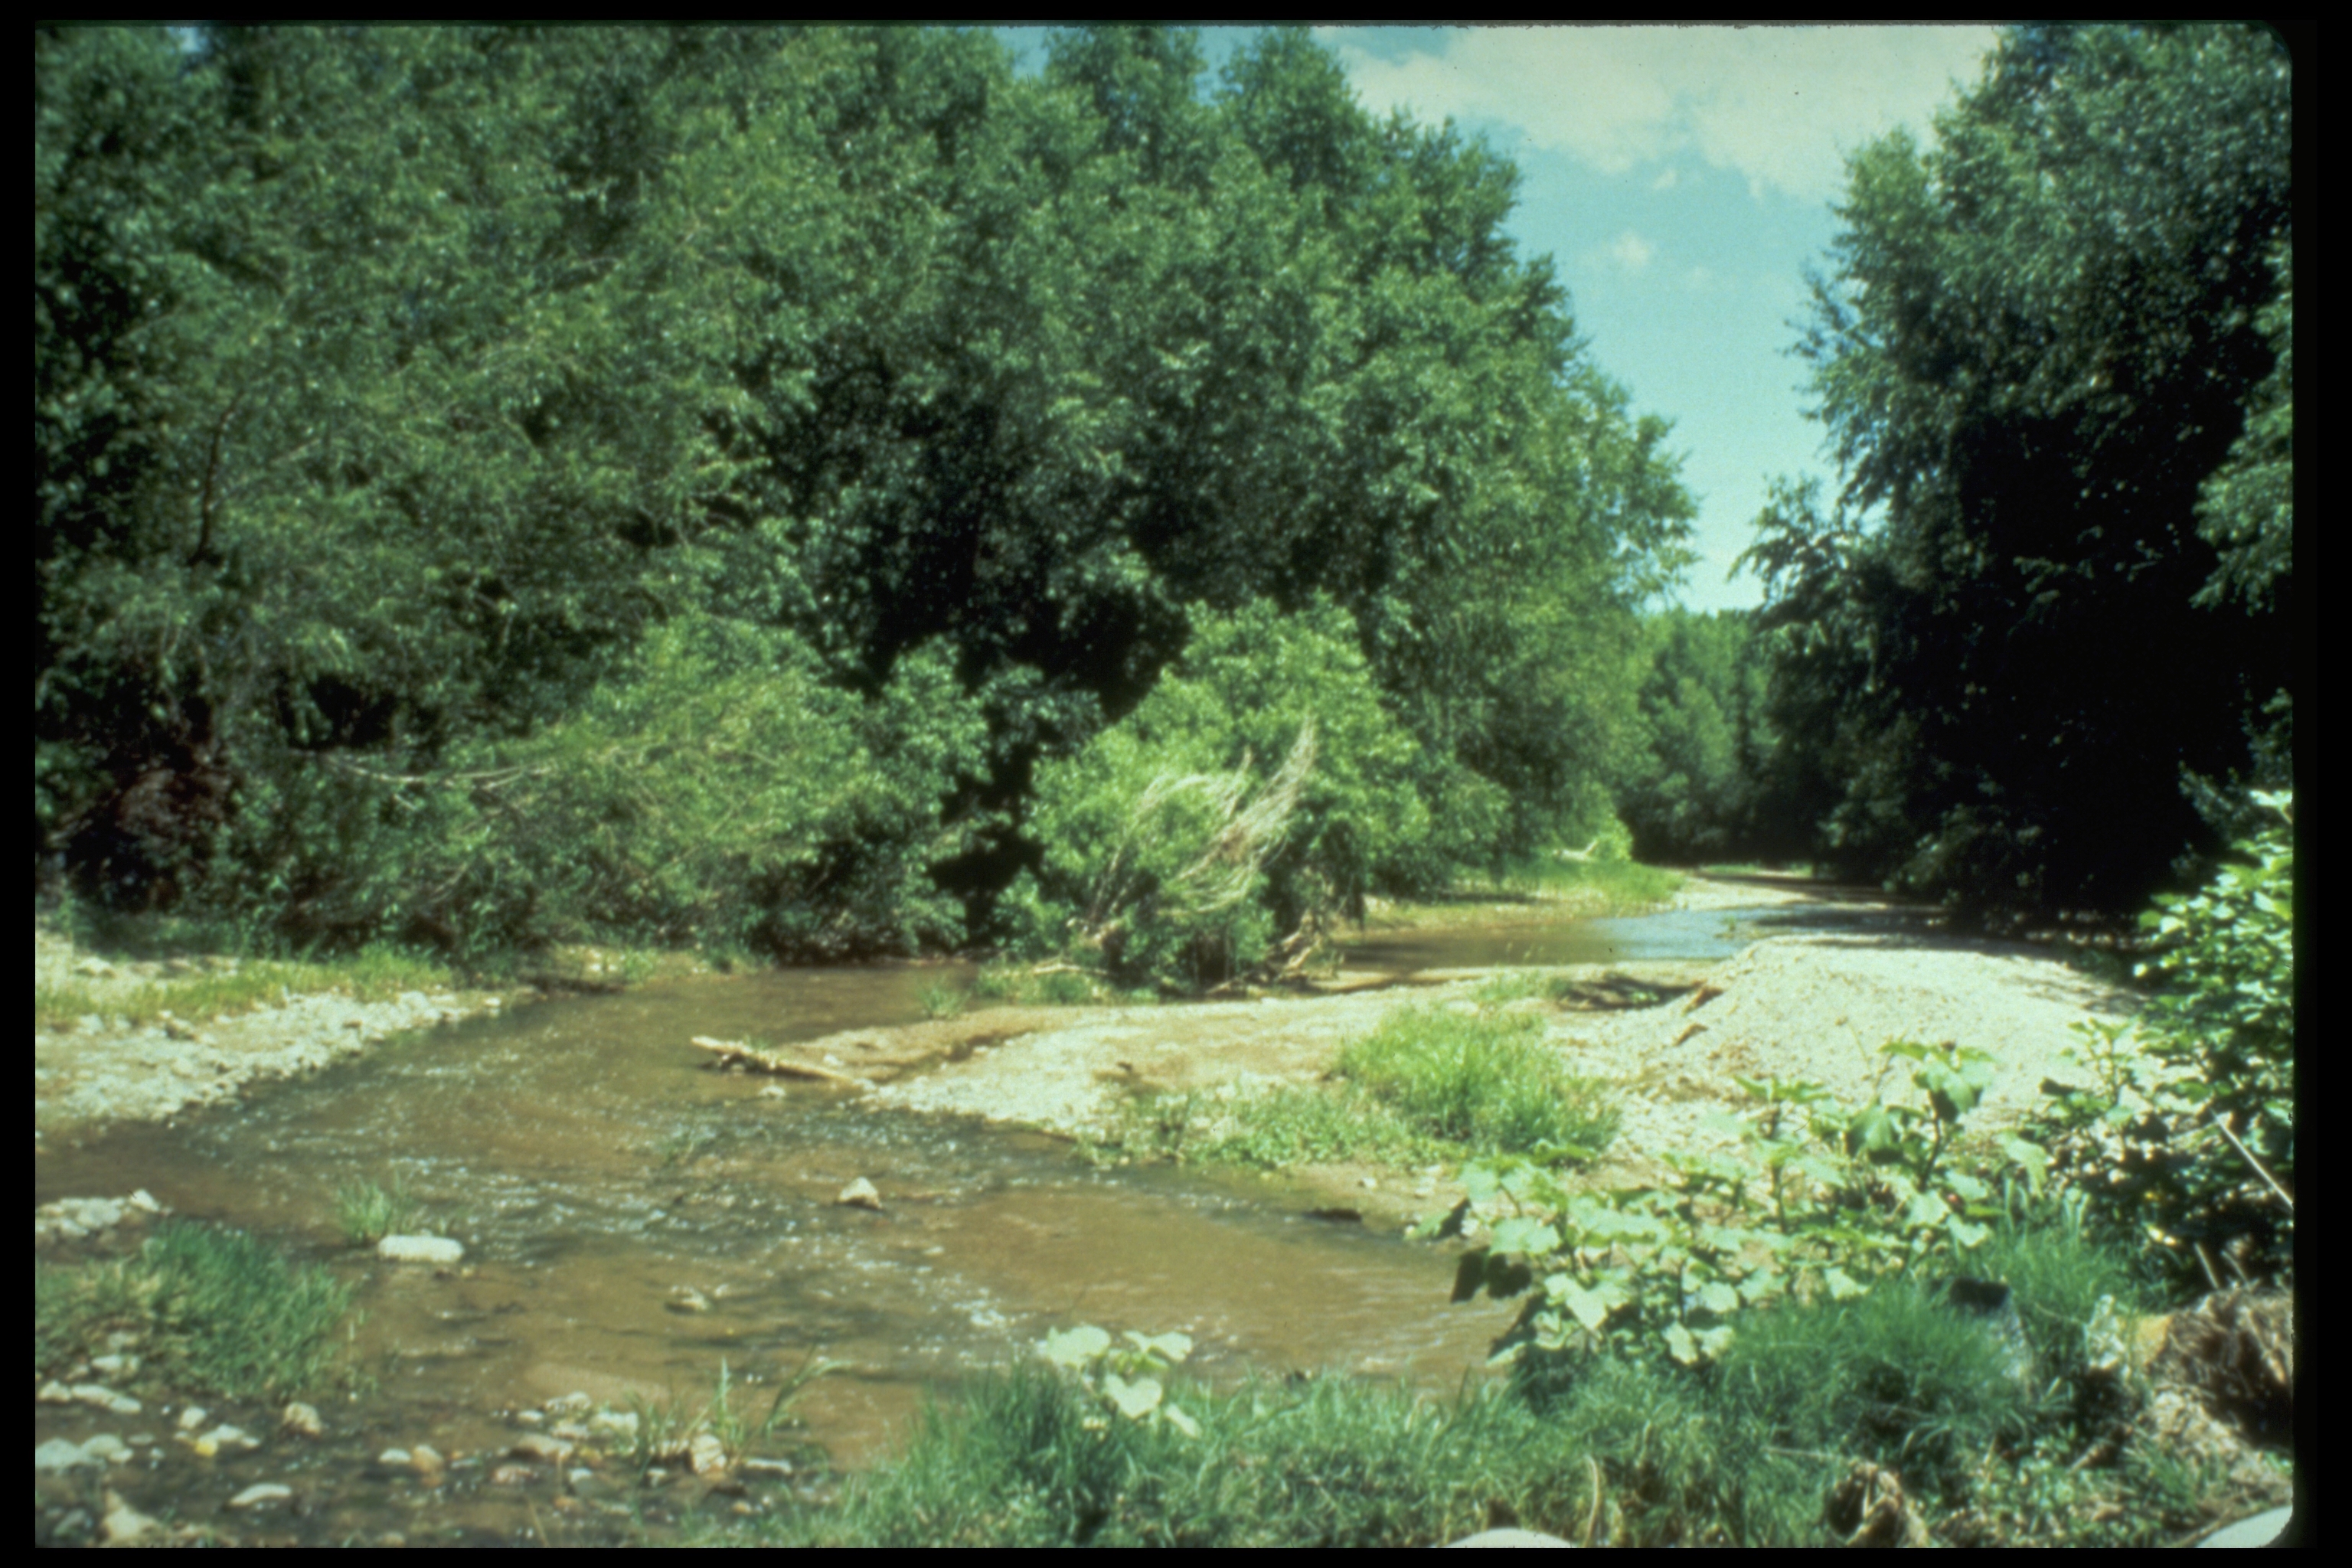 |
Page 34: 2-stream_habitat.JPG. Caption: Physical characteristics of streams, such as the amount of shading, influence nutrient transport. Photograph by U.S. Geological Survey. |
 |
Page 37: Yakima_HenryNgam.tif. Caption: Part of the flow of the Yakima River is diverted to provide irrigation water for crops in Central Washington. Photograph by Henry Ngam, U.S. Geological Survey. |
Chapter 3
 |
Page 42, top: sacramento.tiff (Photograph by Rand Schal, Ph.D., pilot and photographer) |
 |
Page 42, middle: NRCSIA00004.tiff (Photograph by Lynn Betts, U.S. Department of Agriculture, Natural Resources Conservation Service) |
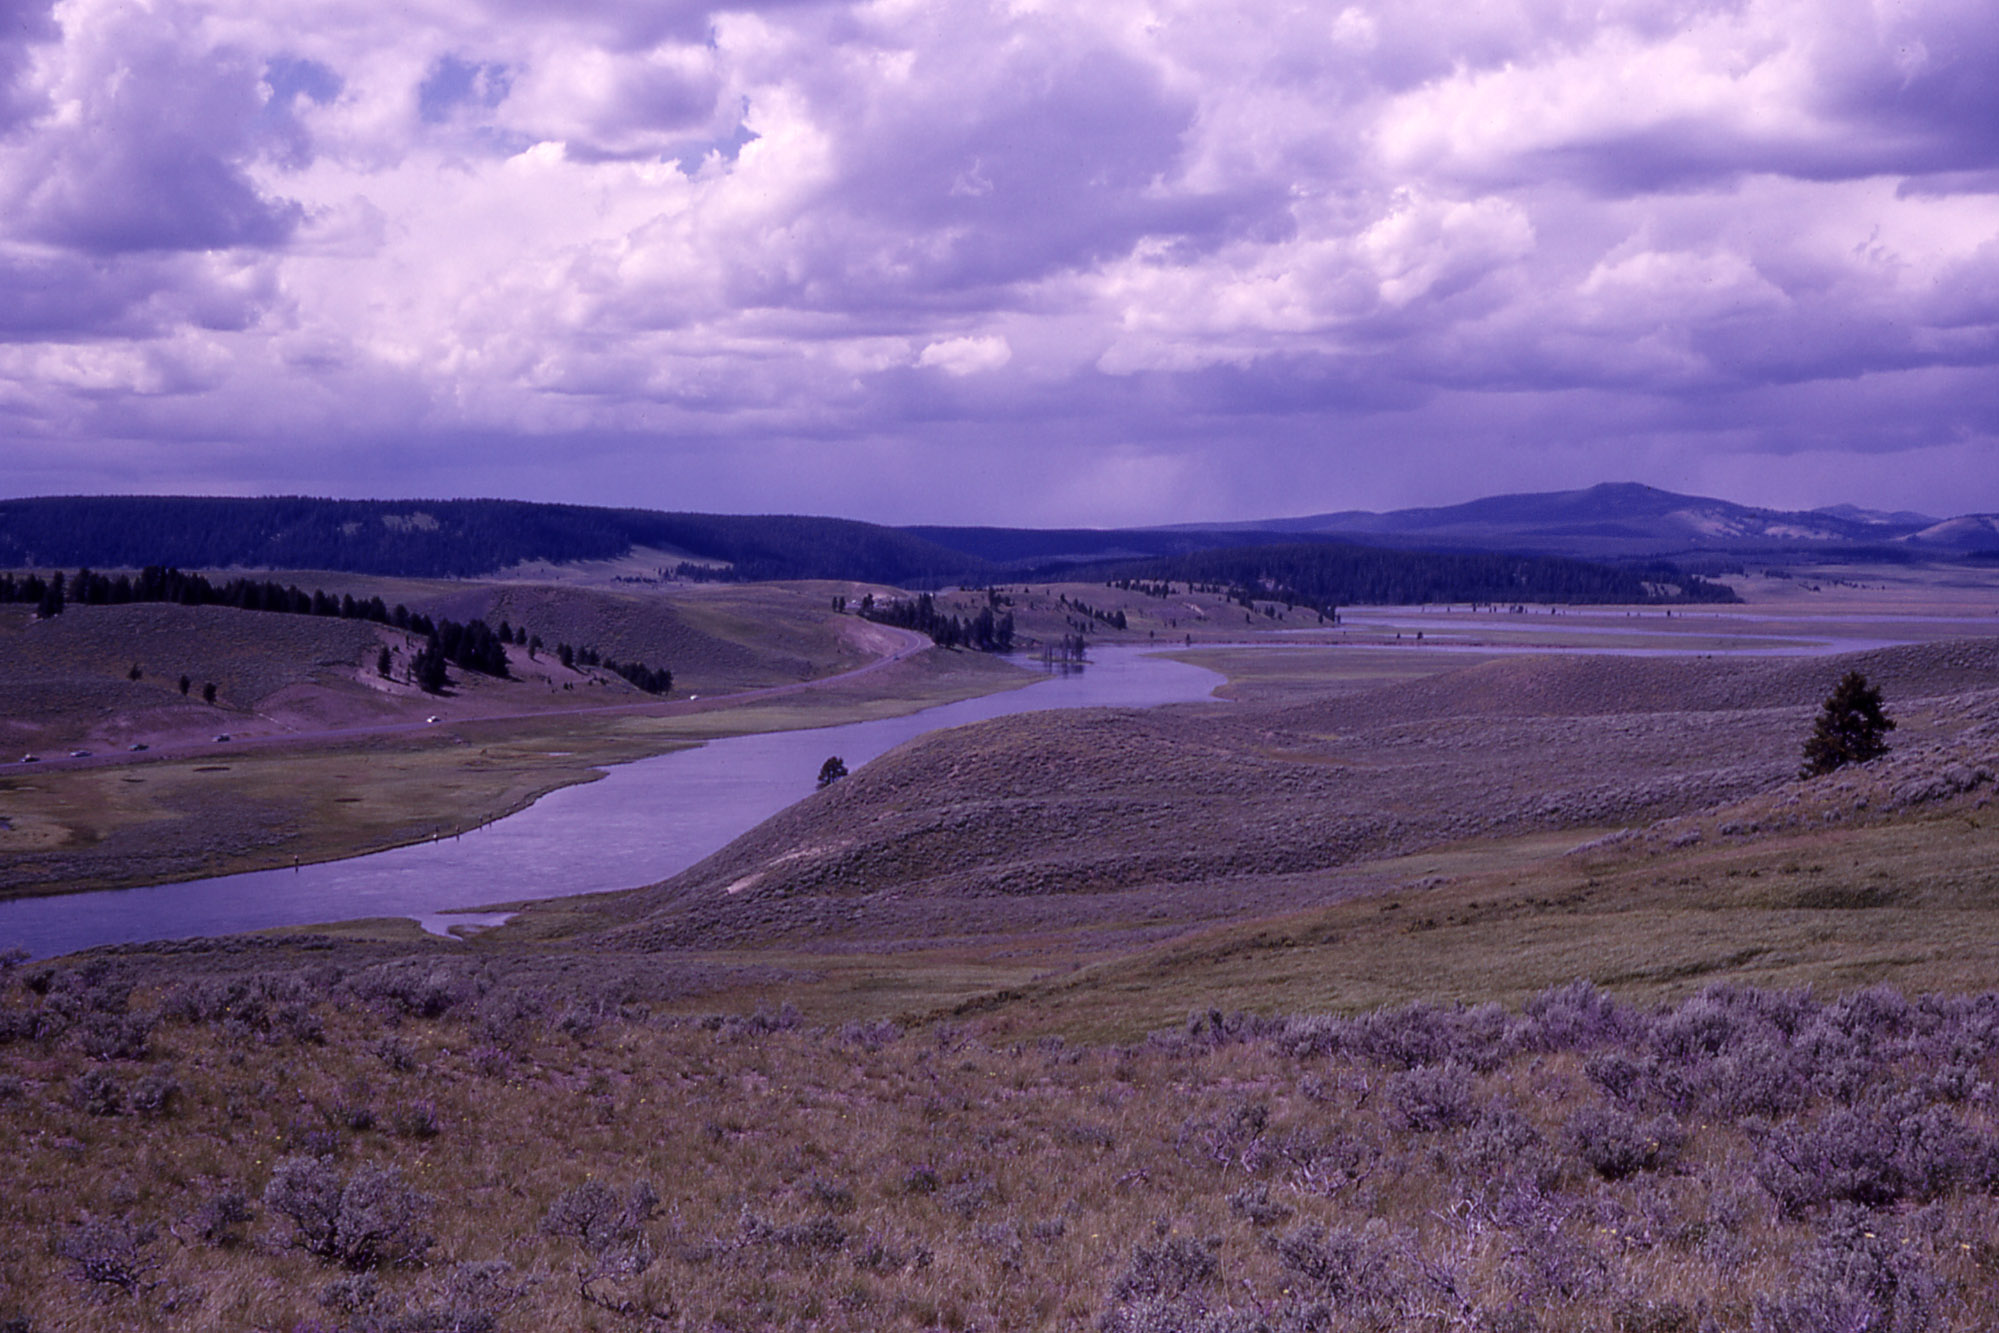 |
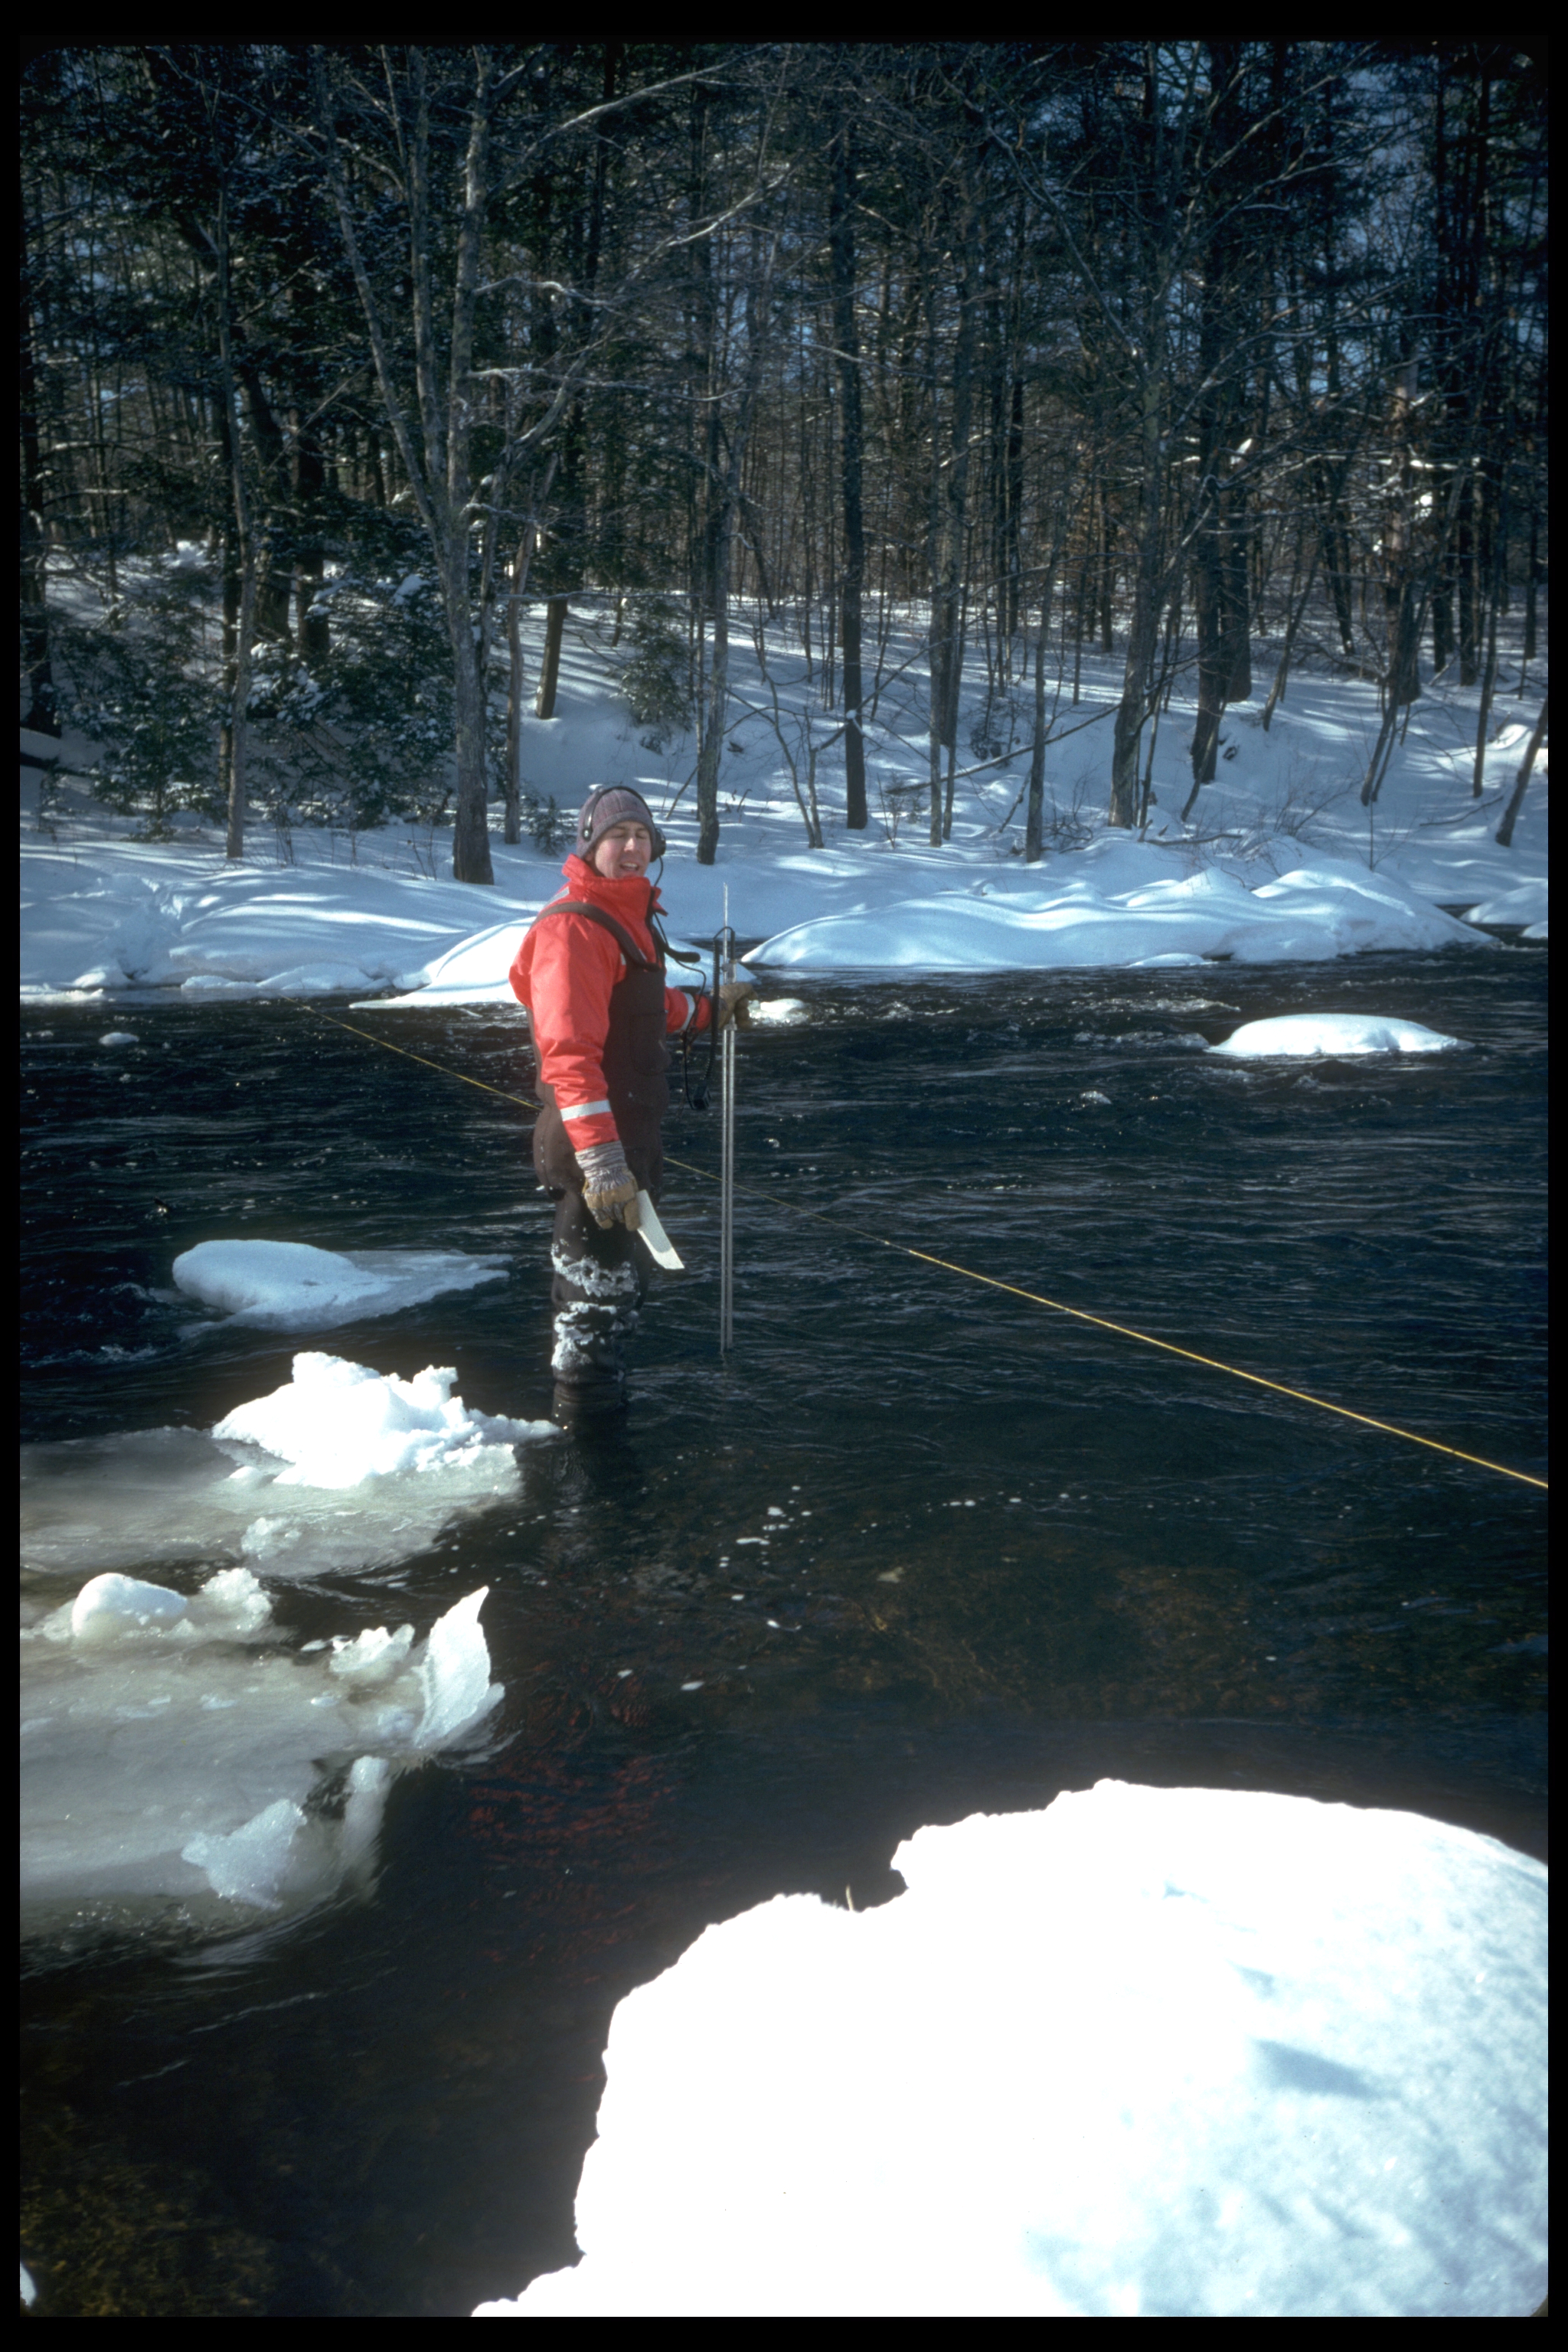
Page 42, bottom: 04092.jpg (Photograph by R. G. Johnson, U.S. National Park Service). Caption: Sampling by NAWQA targeted specific land uses including agricultural (top), urban (middle), and undeveloped (bottom) lands. |
 |
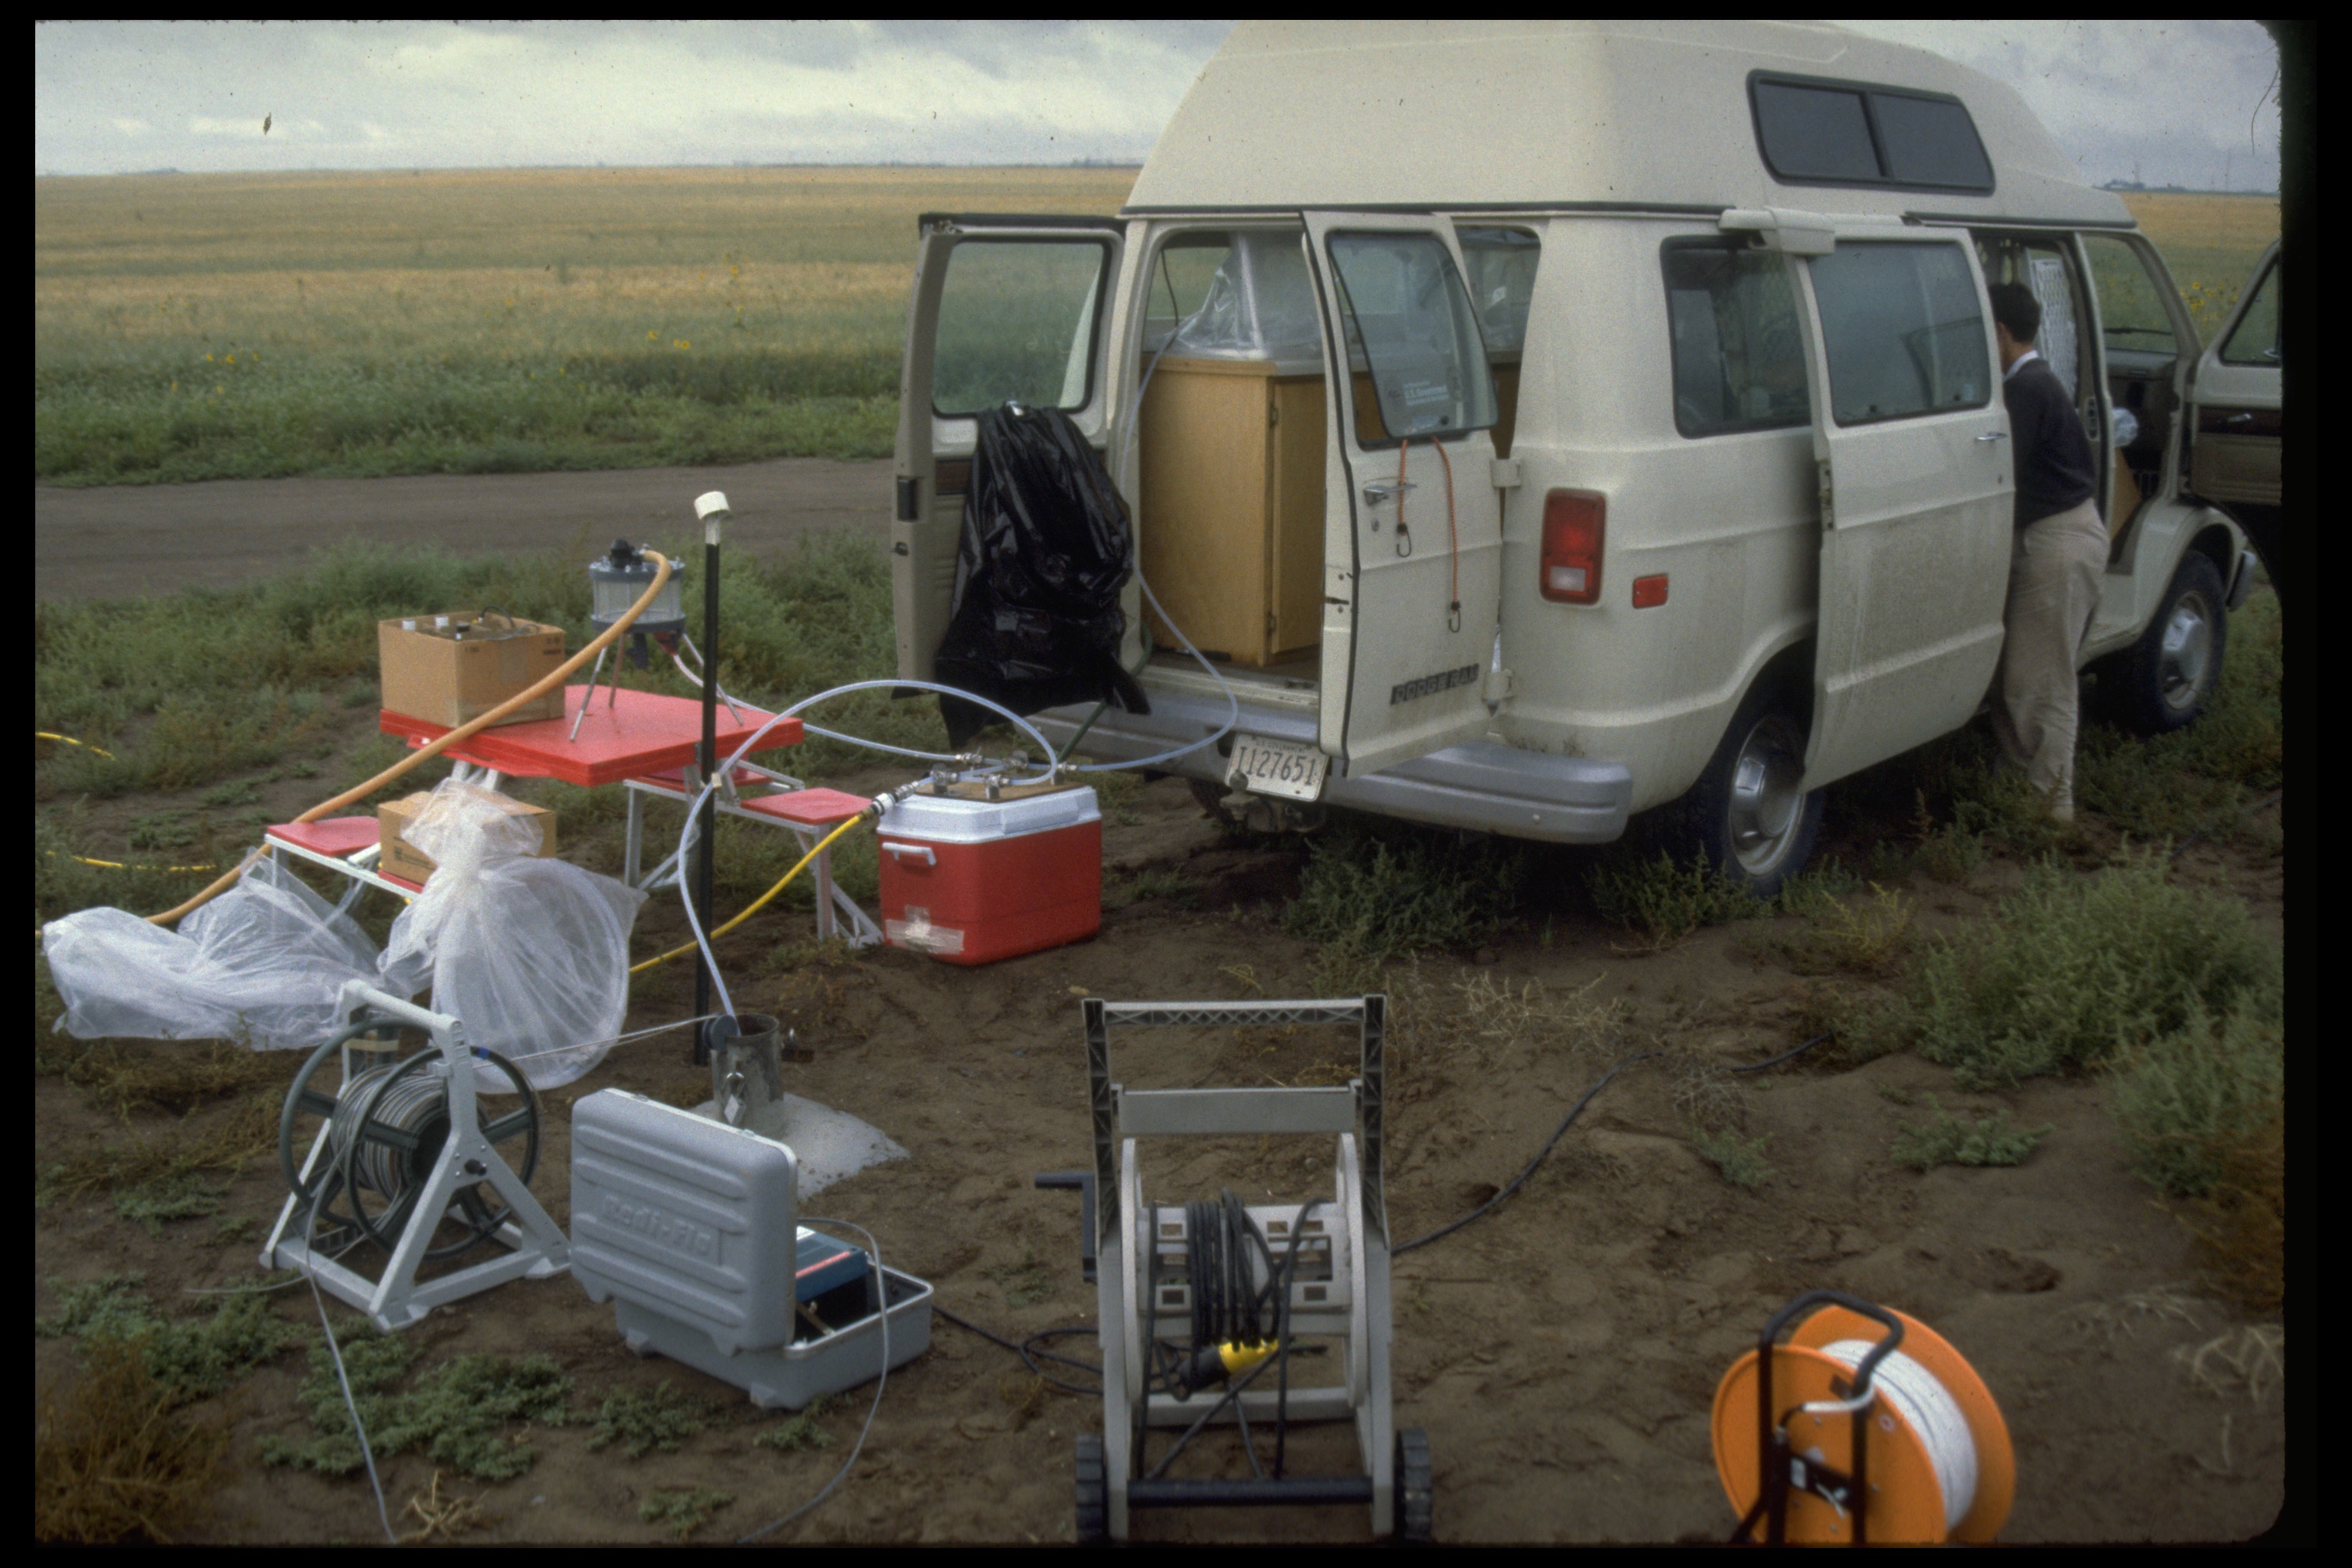
Page 44: image96.jpg. Caption: Stream discharge and water-quality samples were collected throughout the year. Photograph by U.S. Geological Survey. |
 |
Page 46: image7.jpg. Caption: Most of the wells sampled as part of land-use studies were new or existing observation wells. Photograph by U.S. Geological Survey. |
 |
Page 49: SpokaneRiver_LanTornes.tiff. Caption: The Spokane River near Spokane, Washington. Photograph by Lan Tornes, U.S. Geological Survey. |
Chapter 4
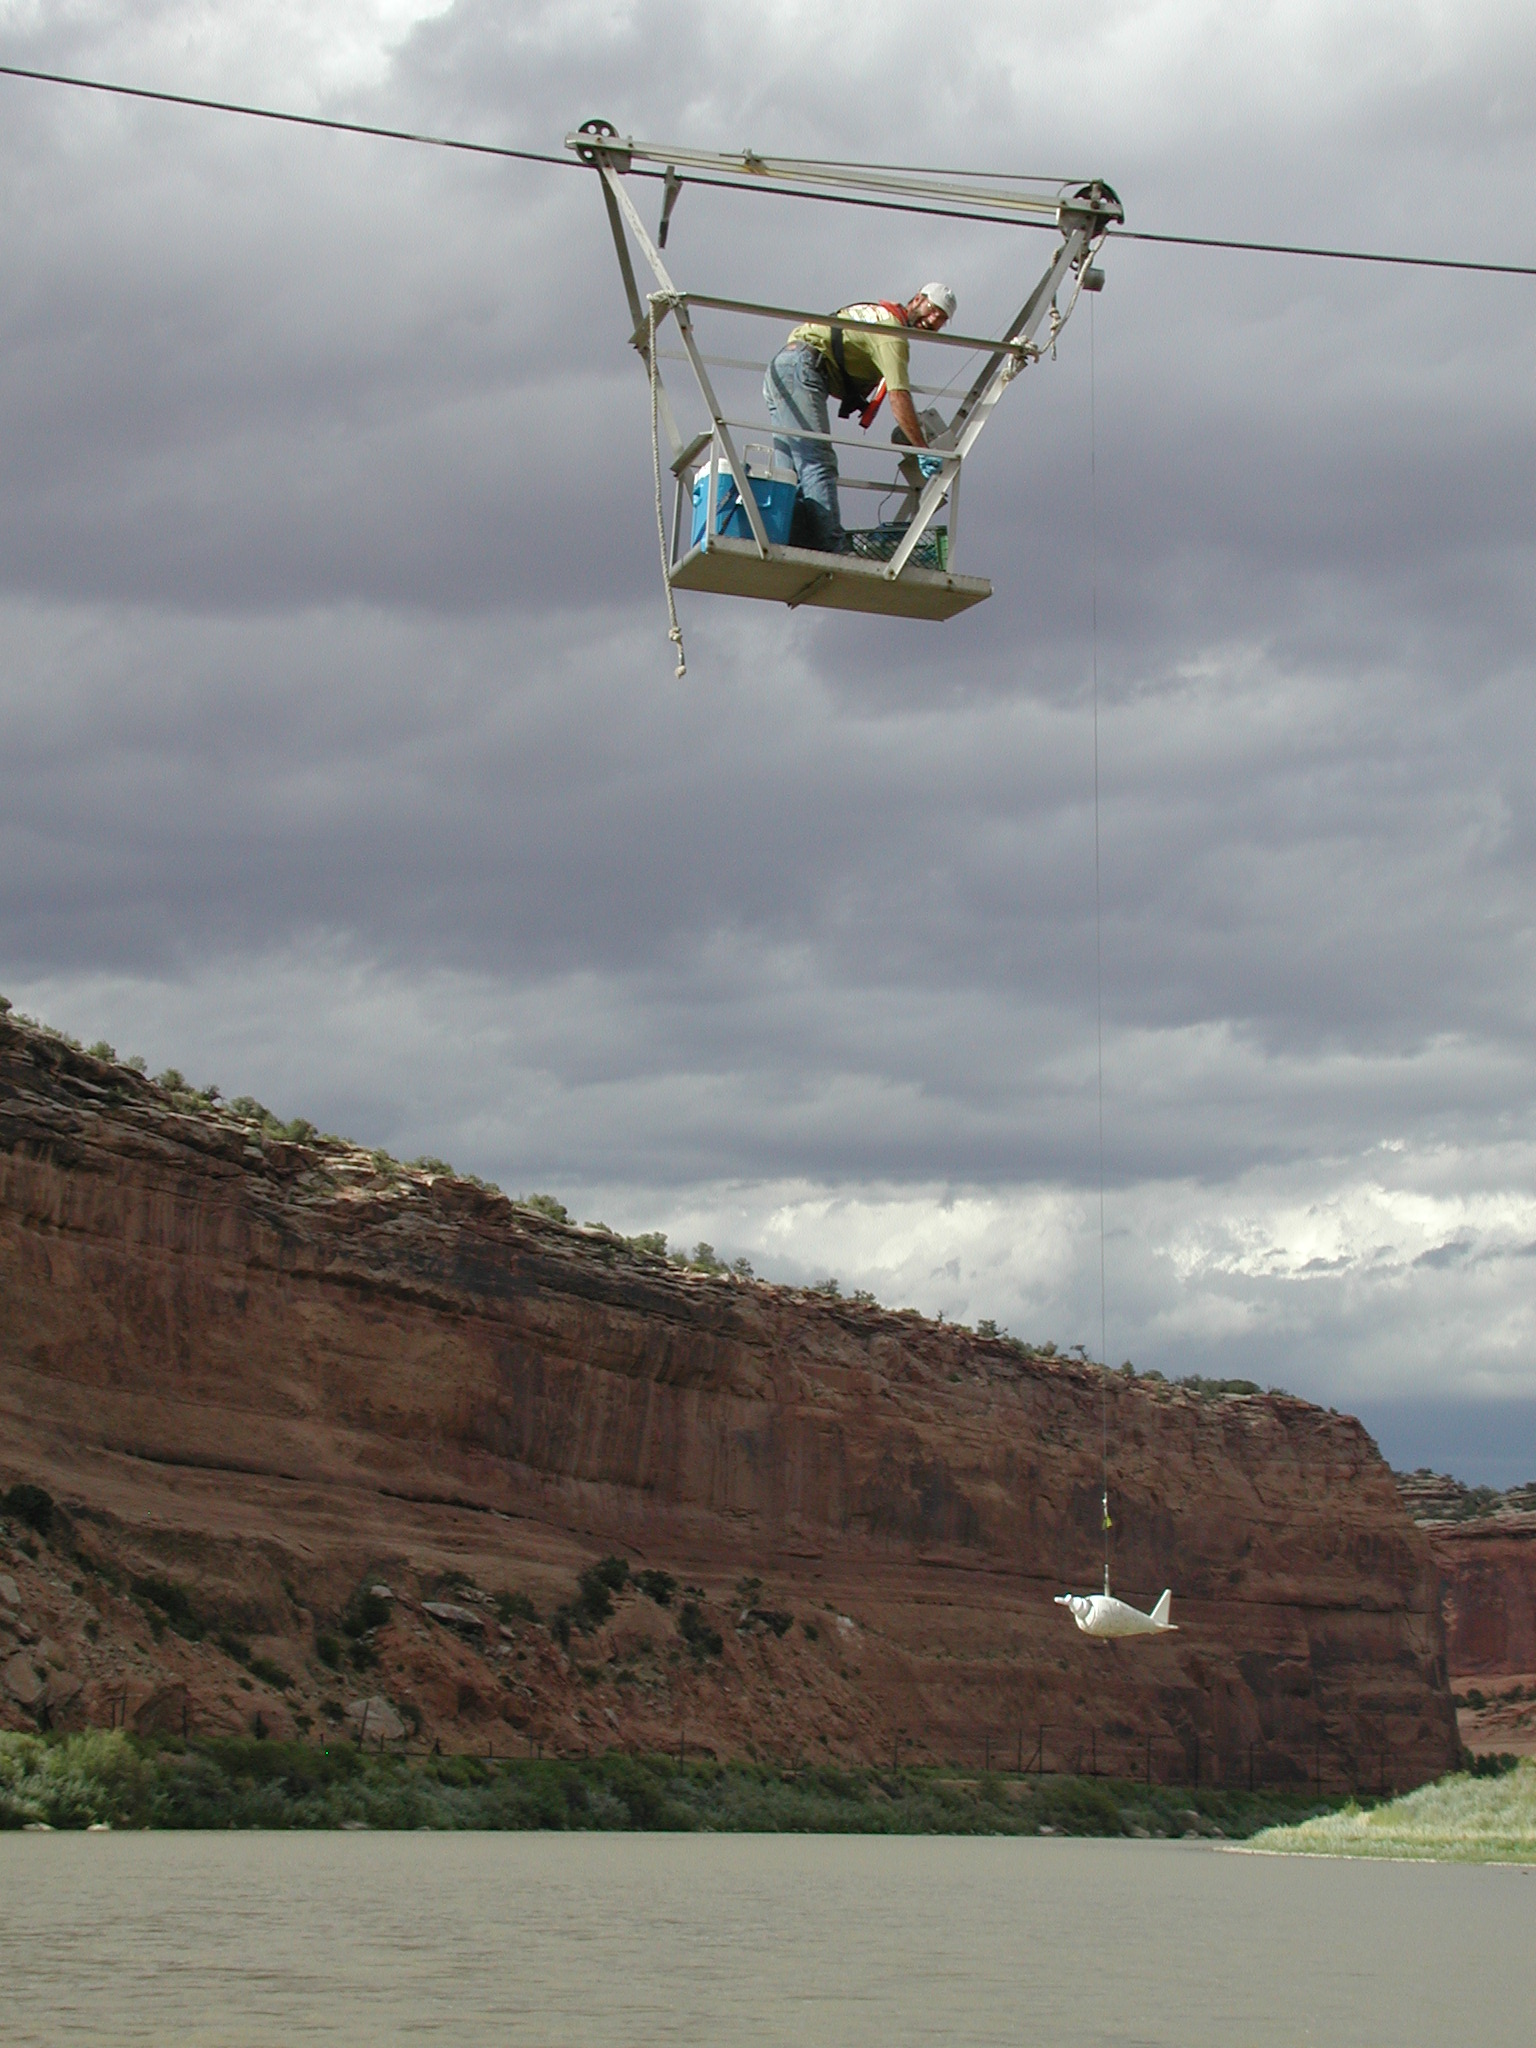 |
Page 51: cableway_sampling.JPG. No caption. Credit: Photograph by Norman Spahr, U.S. Geological Survey. |
 |
Page 52: sampling_RMNP.tif. Caption: Sites with minimal human impact, such as the Colorado River in Rocky Mountain National Park, were chosen to represent background nutrient conditions. Photograph by J.R. Deacon, U.S. Geological Survey. |
 |
Page 54: CAFO_AZ.tif. Caption: Concentrated animal feeding operations, also referred to as “CAFOs,” are potential sources of nutrients to streams and groundwater. Photograph by Jeff Vanuga, U.S. Department of Agriculture, Natural Resources Conservation Service. |
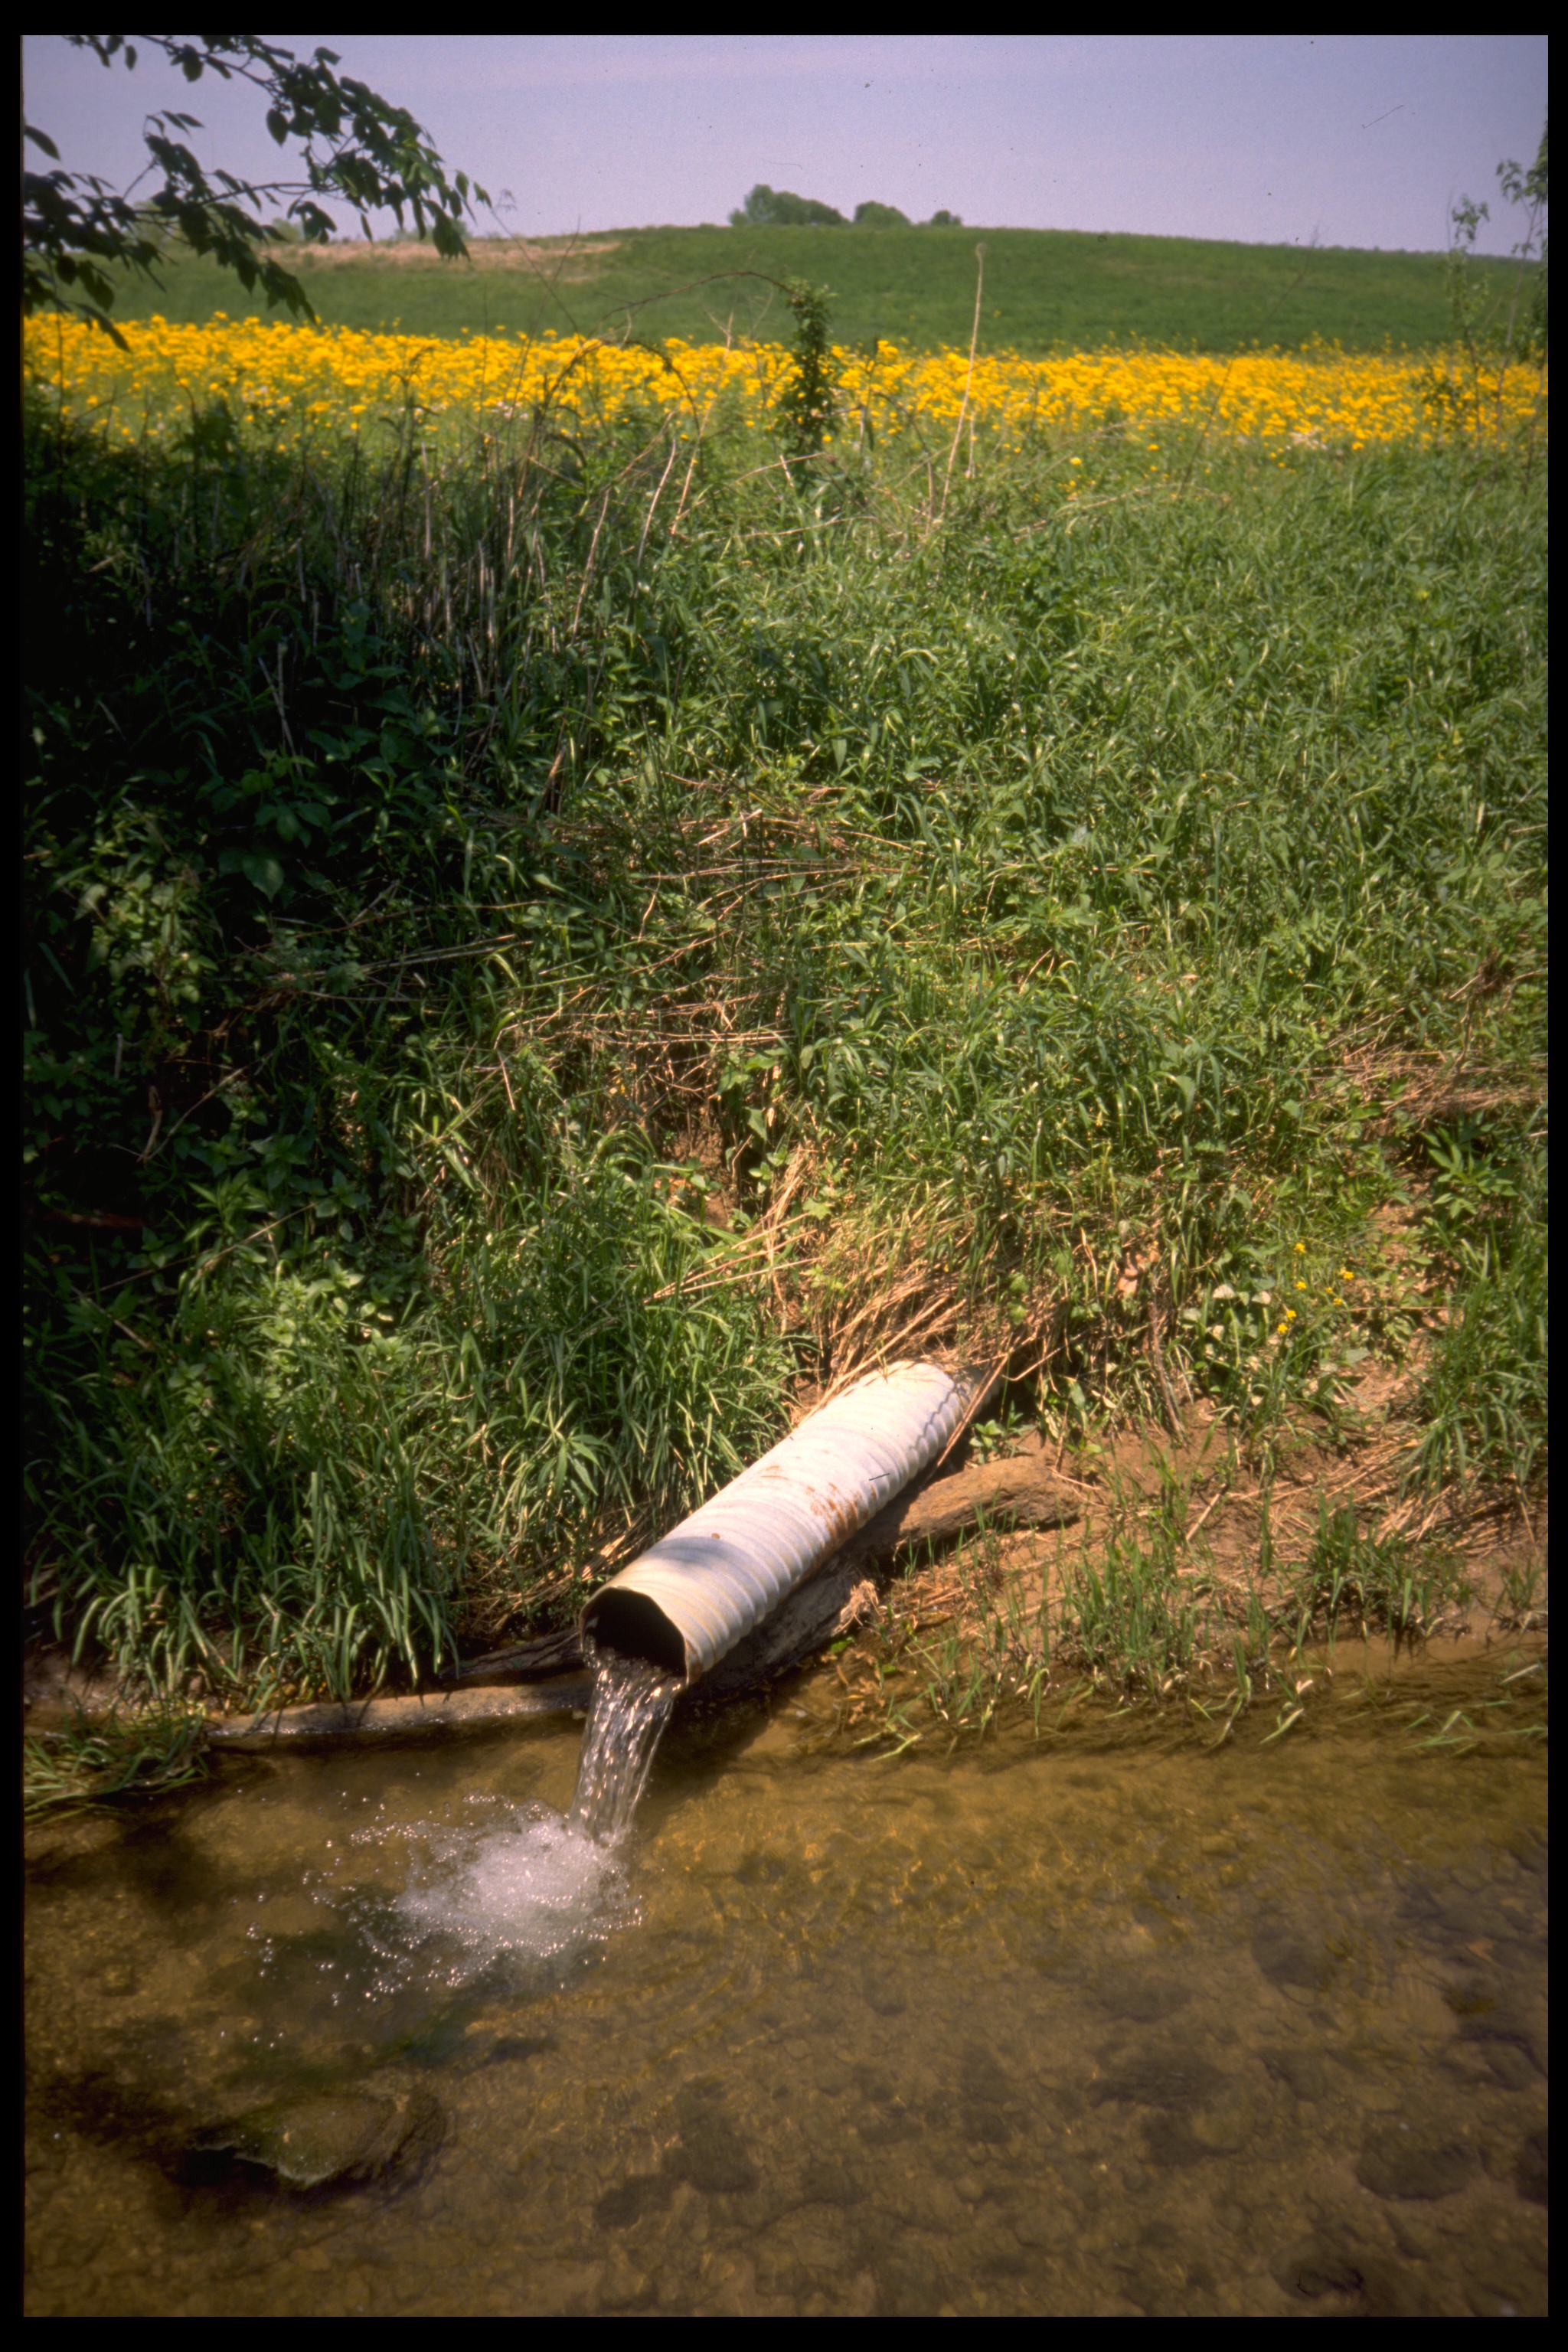 |
Page 59: image40.jpg. Caption: Tile drains buried at shallow depths reduce the water content of poorly drained soils and divert shallow groundwater to nearby streams. Photograph by Jeffrey Martin and Nancy Baker, U.S. Geological Survey. |
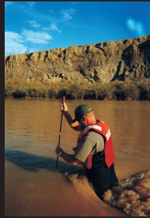 |
Page 59: yell_sediment.tiff OR Yellowstone_new_ch-4_p_59.tif. Caption: The Bighorn River, Wyoming, displays the high concentration of suspended sediment characteristic of streams that drain rangelands with highly erosive soils. Photograph by Nate Majerus, U.S. Geological Survey. |
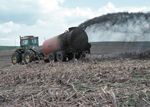 |
Page 68: manure_spray.tif. Caption: Manure from concentrated animal feeding operations that is used to fertilize crops can be a source of nutrients to nearby streams. Photograph by Tim McCabe, U.S. Department of Agriculture, Natural Resources Conservation Service. |
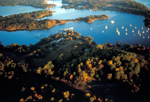 |
Page 70: cbp_4122.tif. Caption: Excess nutrients are the main cause of water-quality impairment in the Chesapeake Bay. Photograph from Chesapeake Bay Program. |
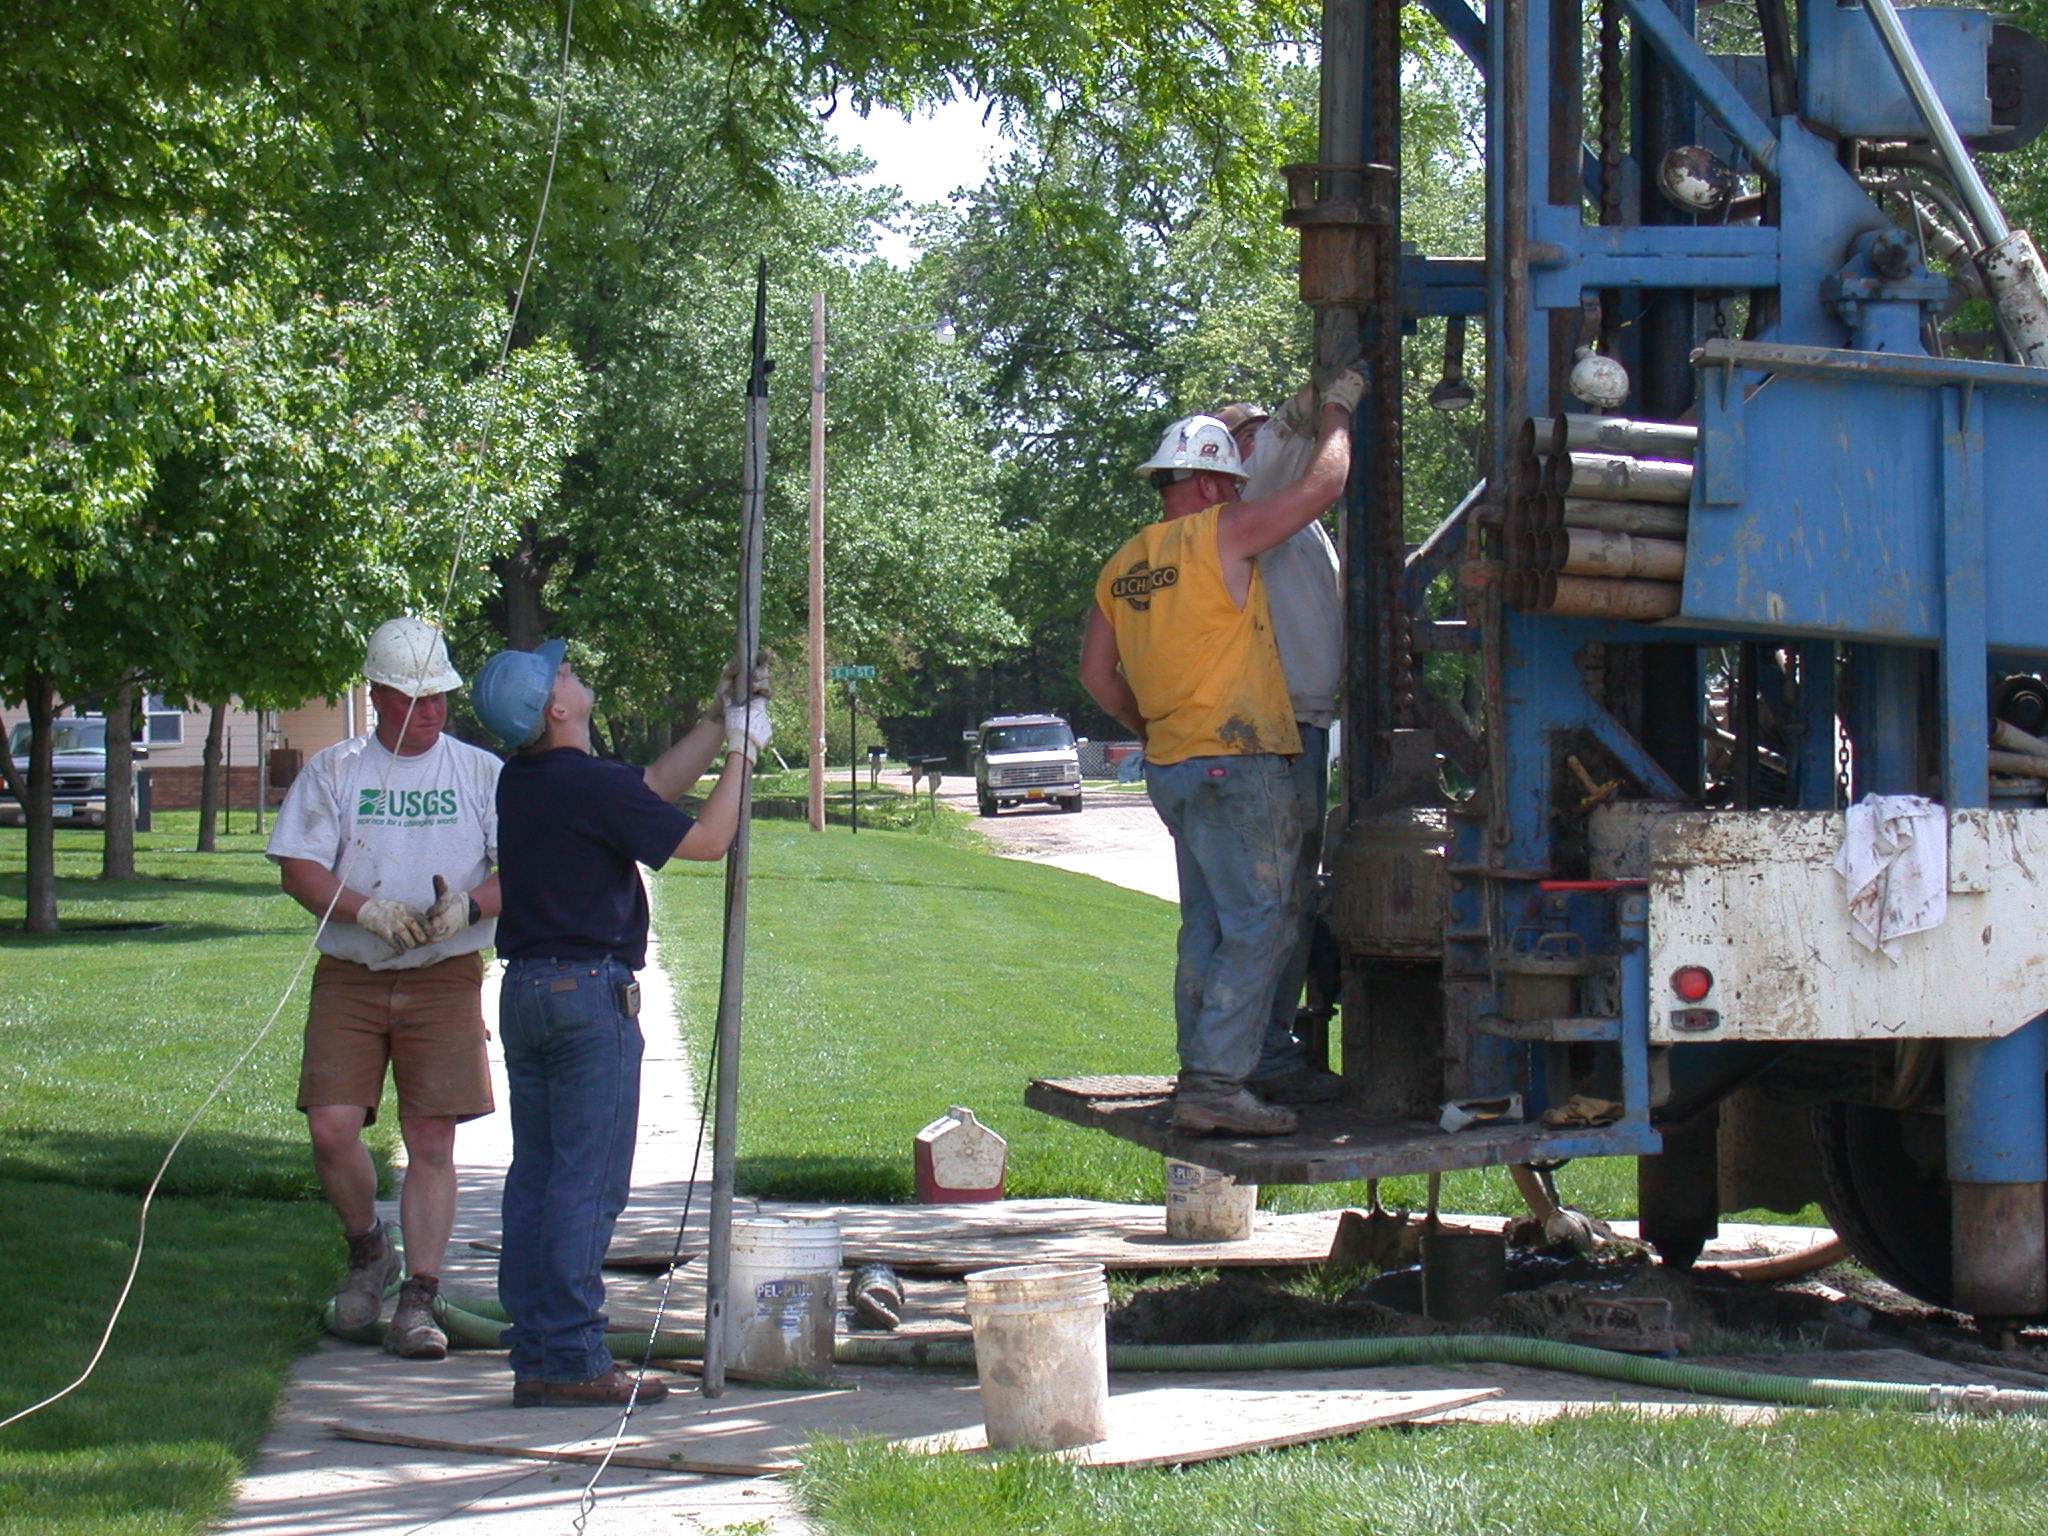 |
Page 71: HPGW5.JPG. Caption: Most wells sampled for agricultural and urban land-use studies were monitoring wells installed by NAWQA. Photograph by U.S. Geological Survey. |
 |
Page 74: GSL.tiff. Caption: Salt Lake City was among the locations where the quality of shallow groundwater beneath residential urban land was studied. Photograph by Steven Gerner, U.S. Geological Survey. |
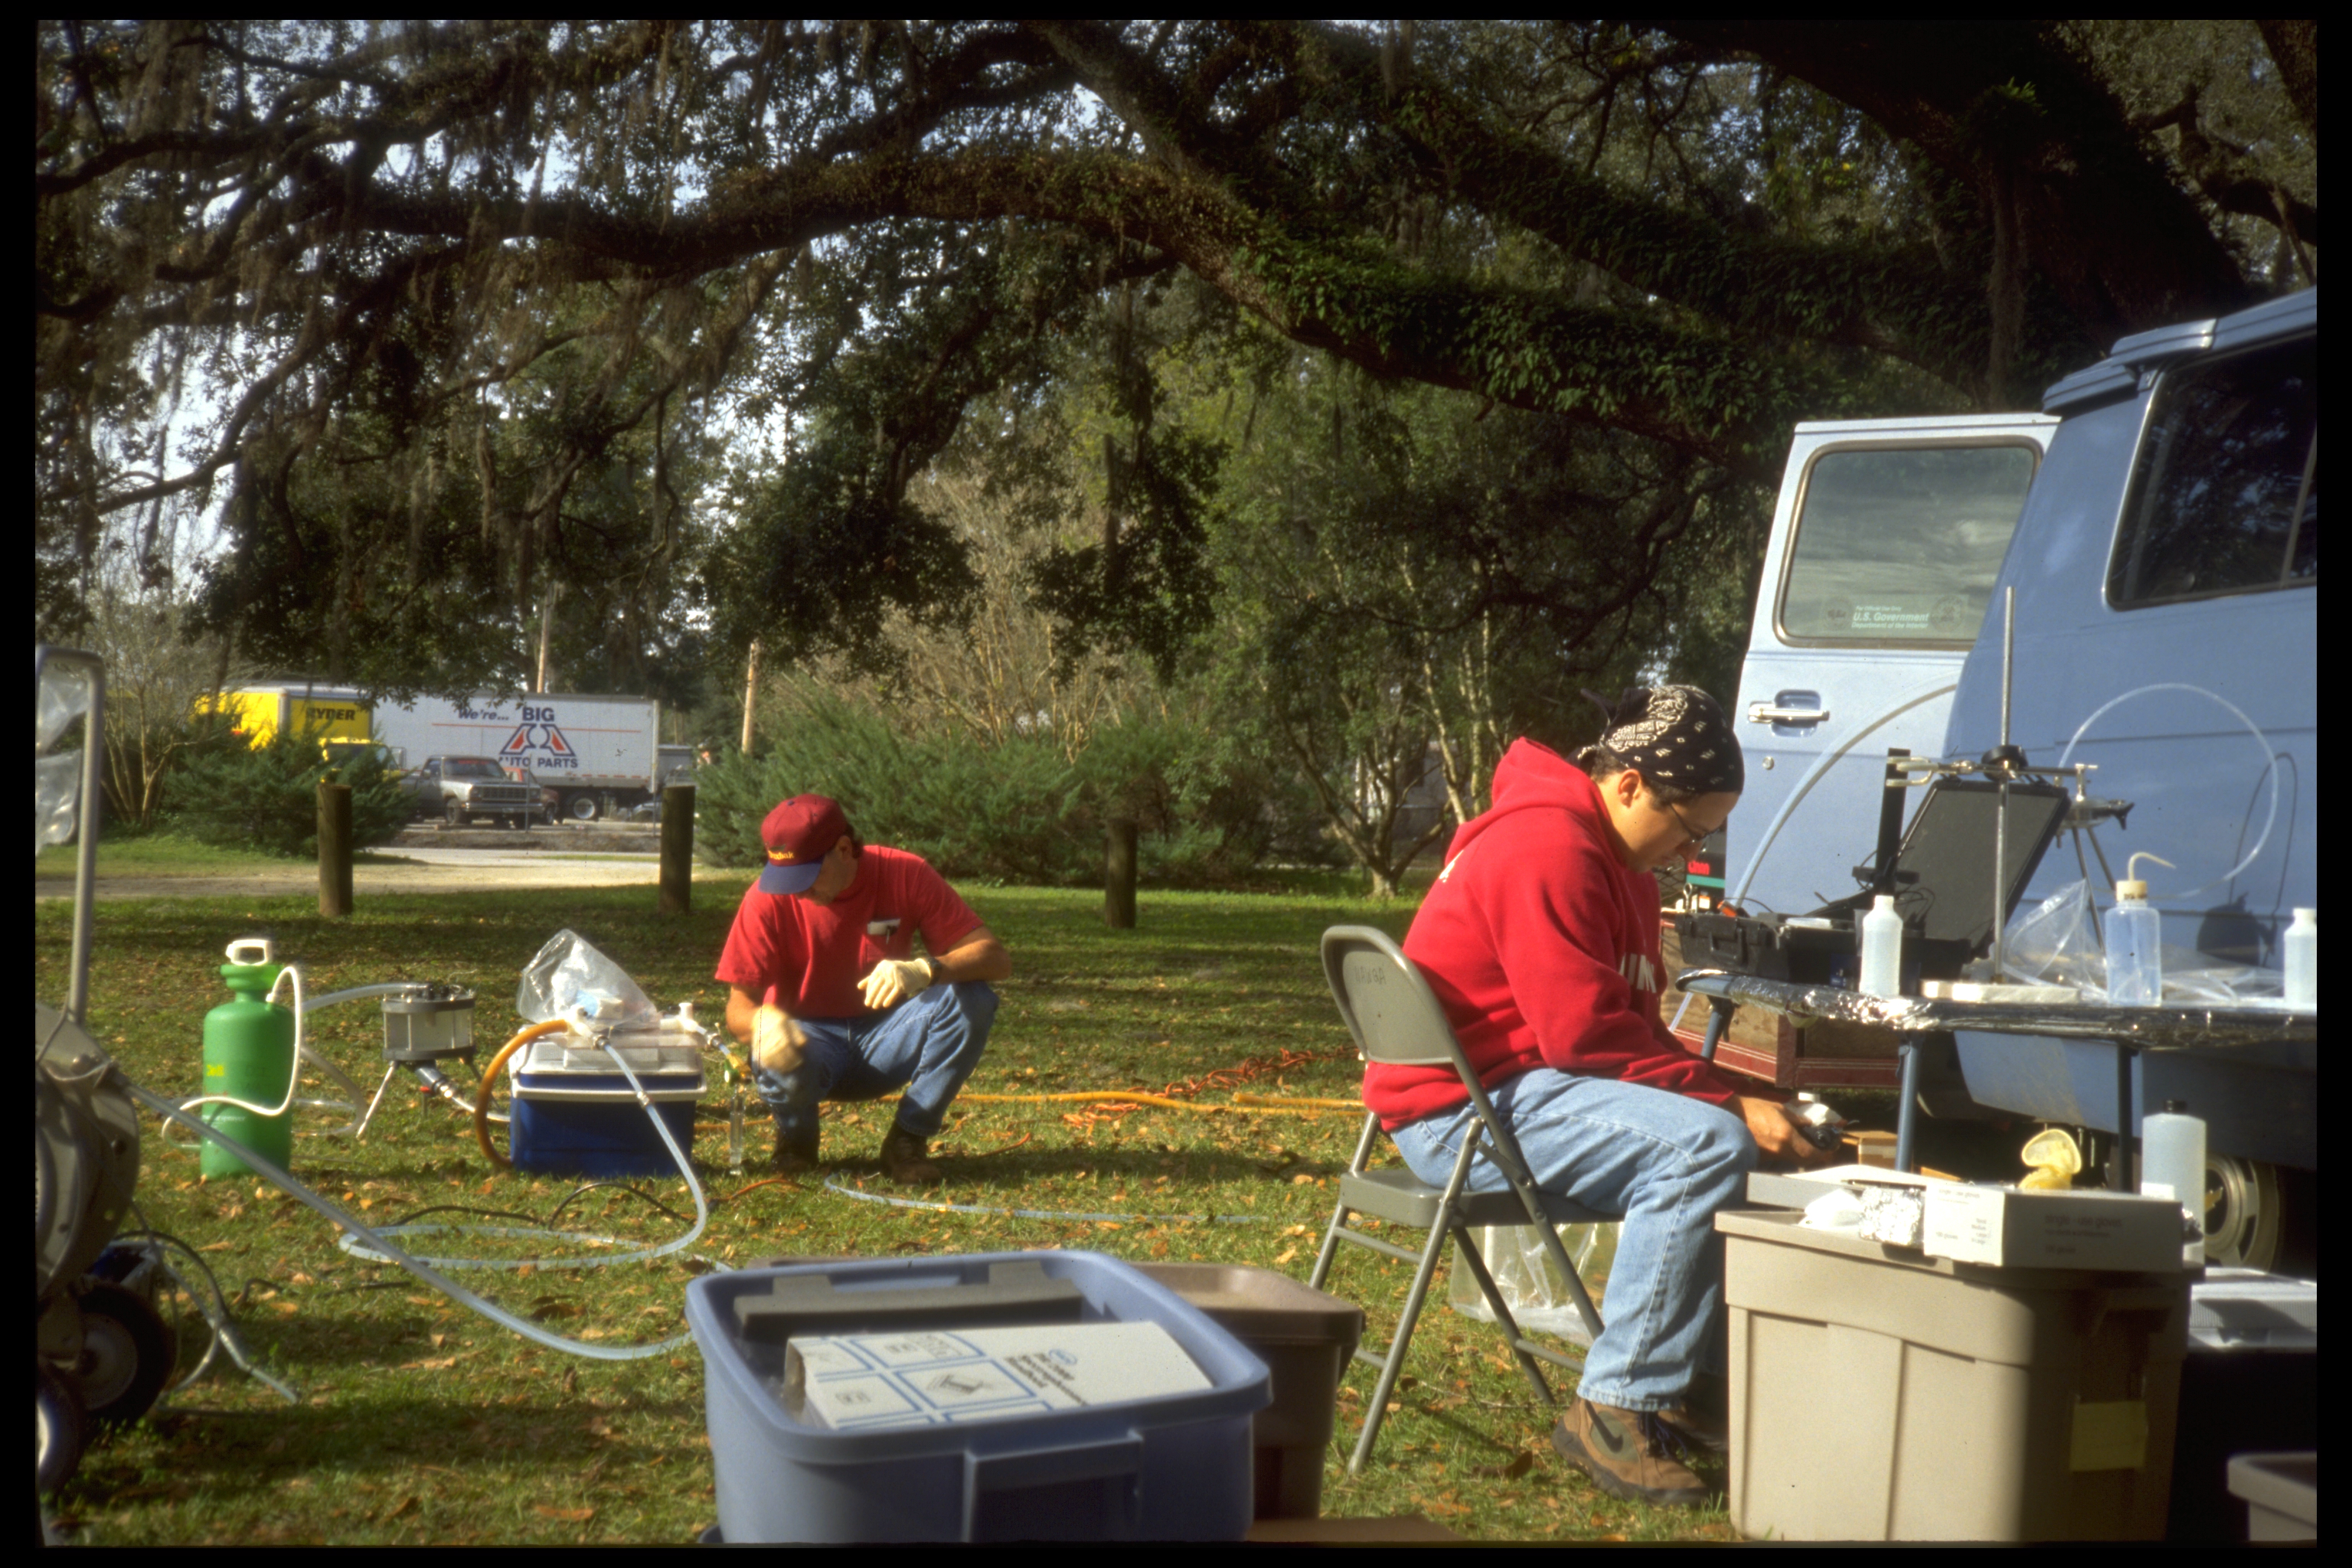 |
Page 76: image6.jpg. Caption: Water-quality characteristics are measured at the site as samples are collected for laboratory analysis. Photograph by U.S. Geological Survey. |
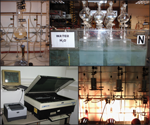 |
Page 78: Tritium_lab_ch-4_p78.tif. Caption: Groundwater samples are analyzed for environmental tracers, such as tritium and chlorofluorocarbons, to determine the time elapsed since recharge. Tritium is analyzed by (clockwise from upper left) distillation, electrolytic enrichment, secondary distillation, and scintillation counting. Photographs by A. Abedini, U.S. Geological Survey. |
Chapter 5
 |
Page 85: buffer.tif. No caption. Credit: Photograph by Lynn Betts, U.S. Department of Agriculture, Natural Resources Conservation Service. |
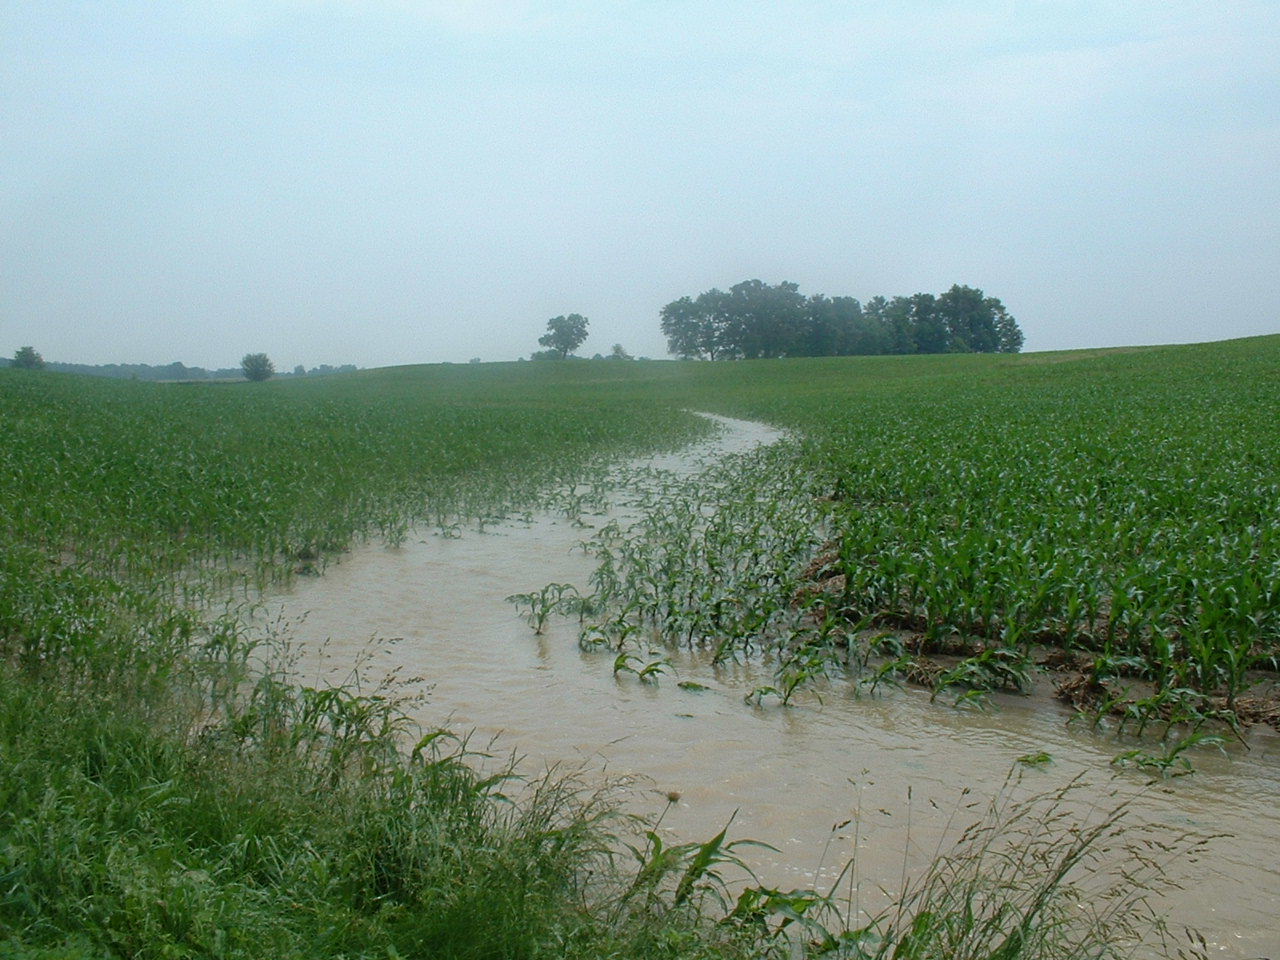 |
Page 90: fieldflow193.jpg. Caption: Overland flow is the dominant source of streamflow in landscapes in which both soils and bedrock are impermeable. Photograph by John T. Wilson, U.S. Geological Survey. |
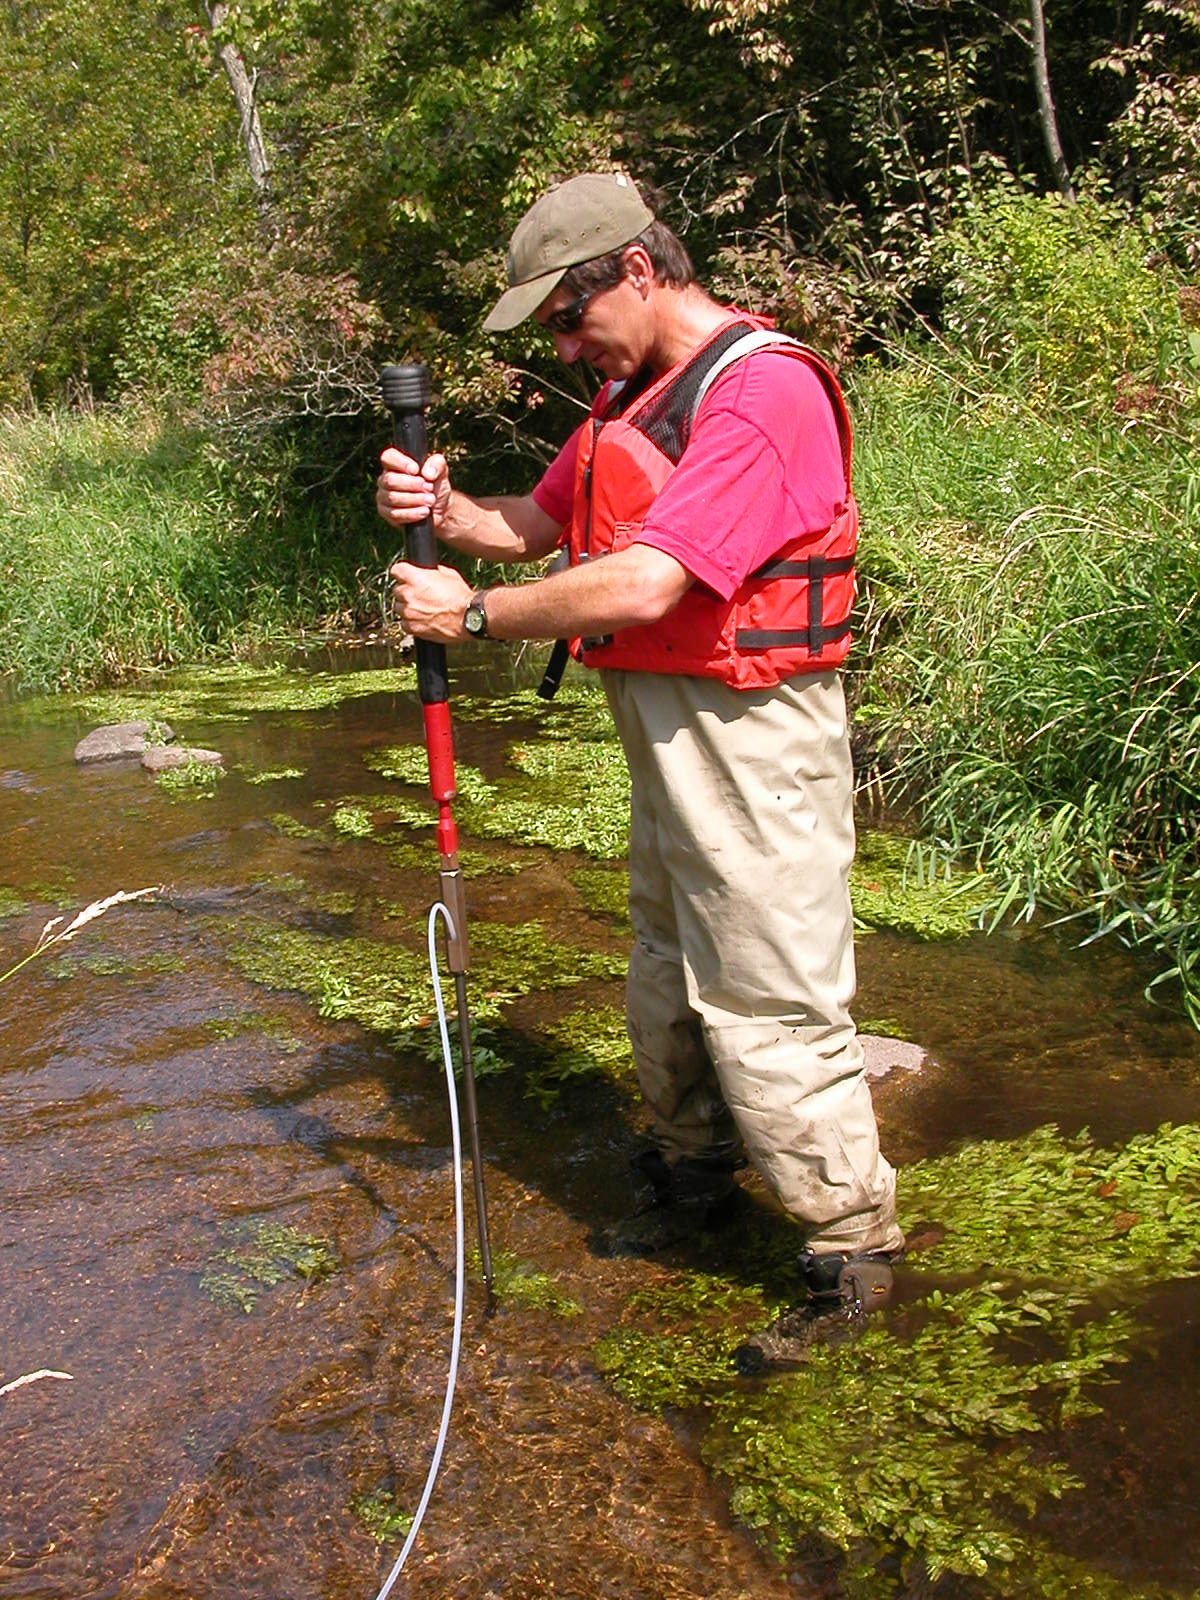 |
Page 96: DCSN1644.JPG. Caption: Shallow sampling points were installed in streambeds to assess the chemistry of groundwater discharging to streams. Photograph by U.S. Geological Survey. |
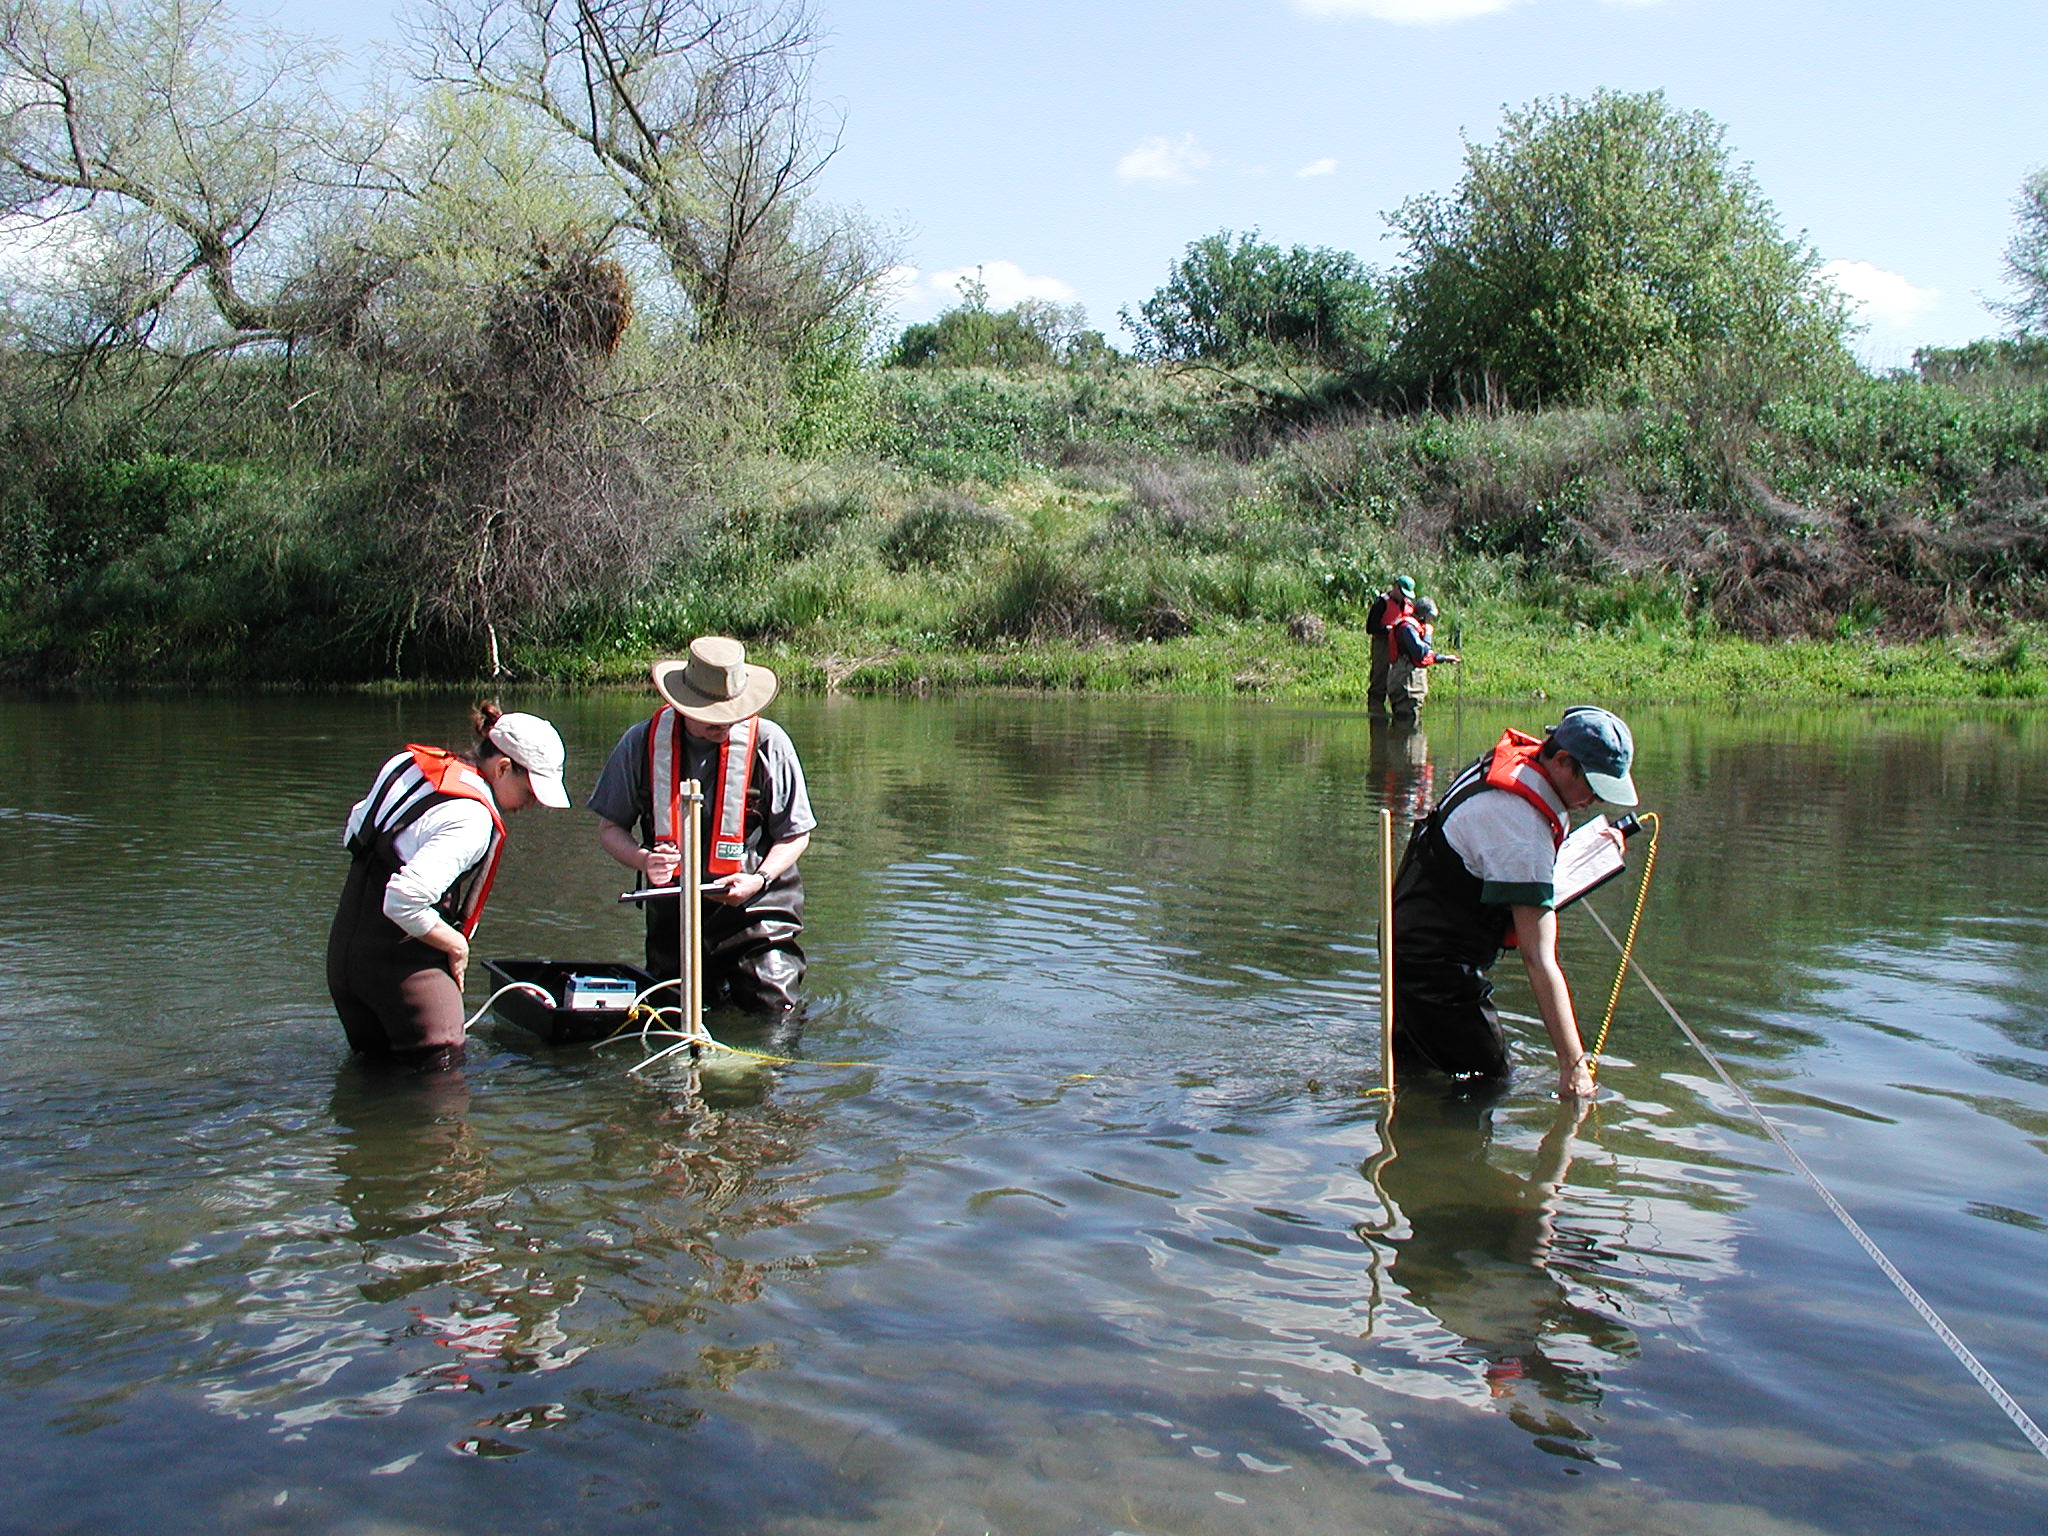 |
Page 97: P4030009.JPG. Caption: The nitrate load in groundwater discharging to a stream (being measured at left) can make a substantial contribution to the total nitrate load in a stream (being measured at right). Photograph by Joseph Domagalski, U.S. Geological Survey. |
Chapter 6
 |
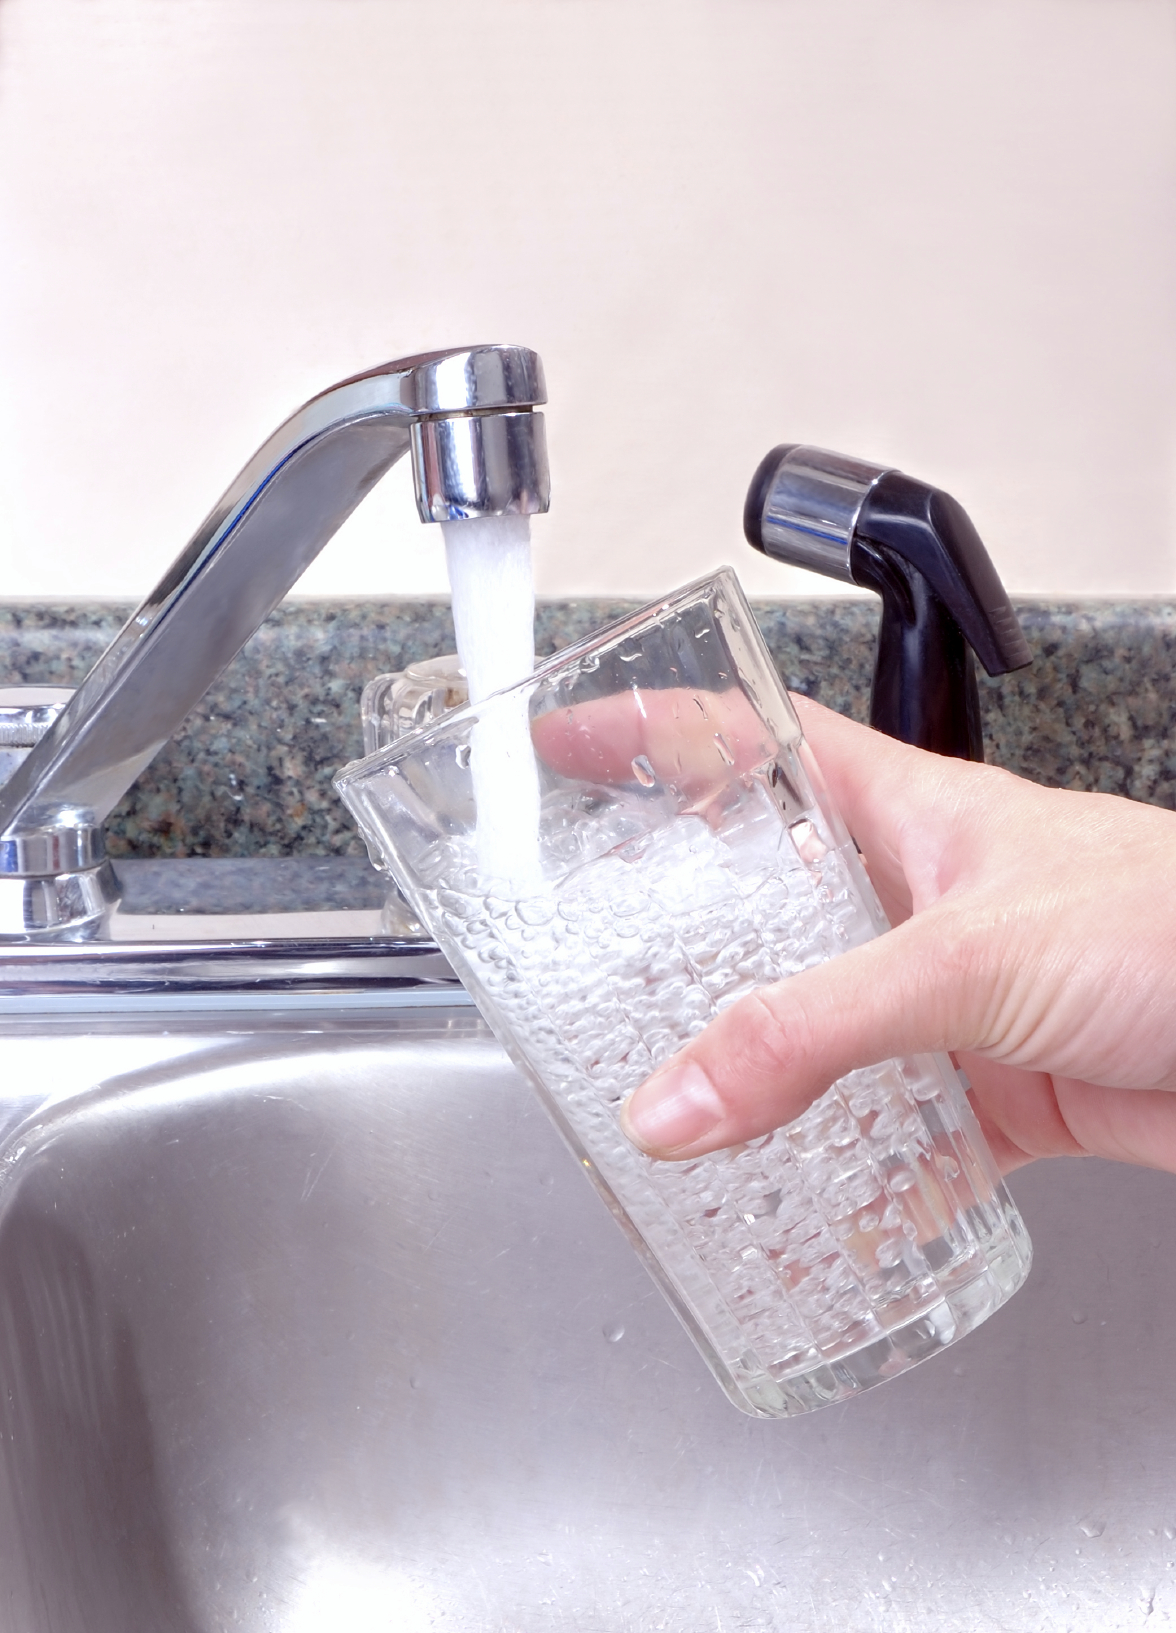
Page 101: pump_photo.tif OR HP_publicsupply.tif No caption. Credit: Photograph by U.S. Geological Survey. [Sandy Eberts took photo but said to just put USGS for credits]. |
 |
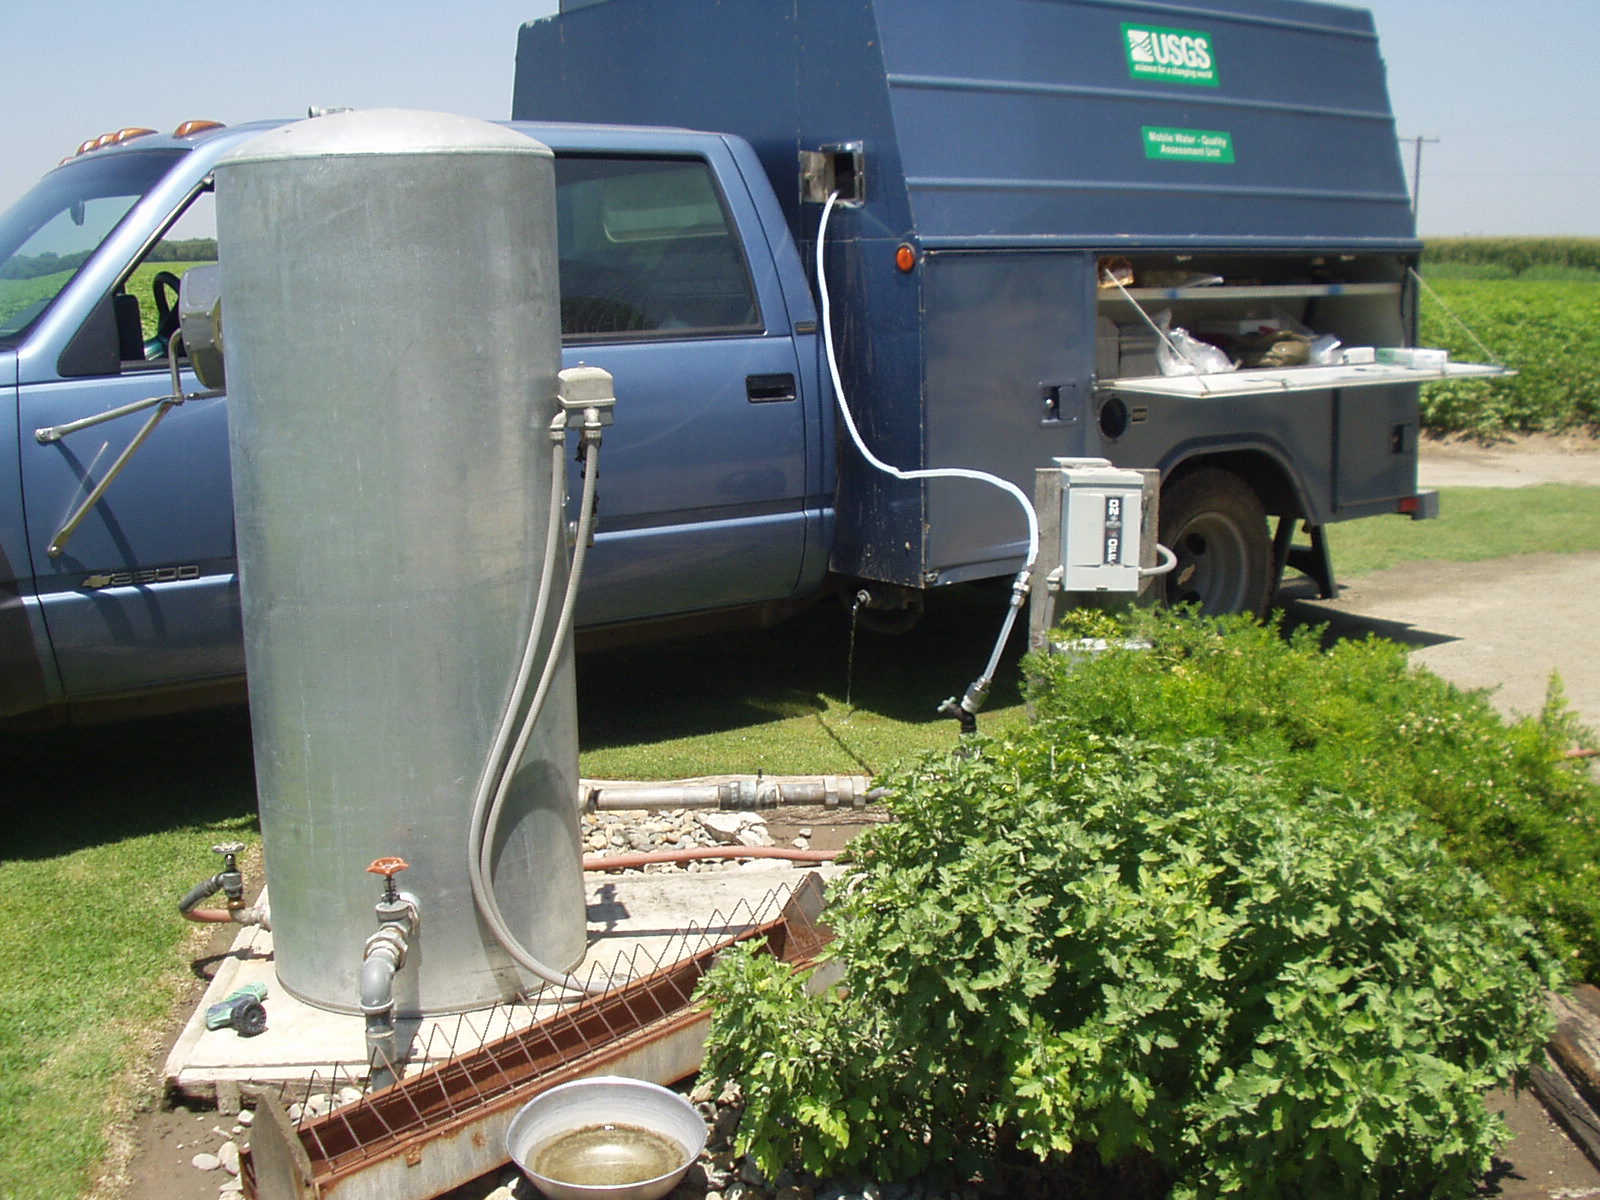
Page 104: iStock_3374296TapWater.jpg. No caption. Credit: @iStockphoto.com/Genesis Photography. [@ should be a copyright symbol] |
 |
Page 109: Sampling domestic well.JPG. Caption: Samples of groundwater were collected from privately owned (domestic) wells; about 43 million people in the United States obtain water for household use from domestic wells. Photograph by U.S. Geological Survey. |
Chapter 7
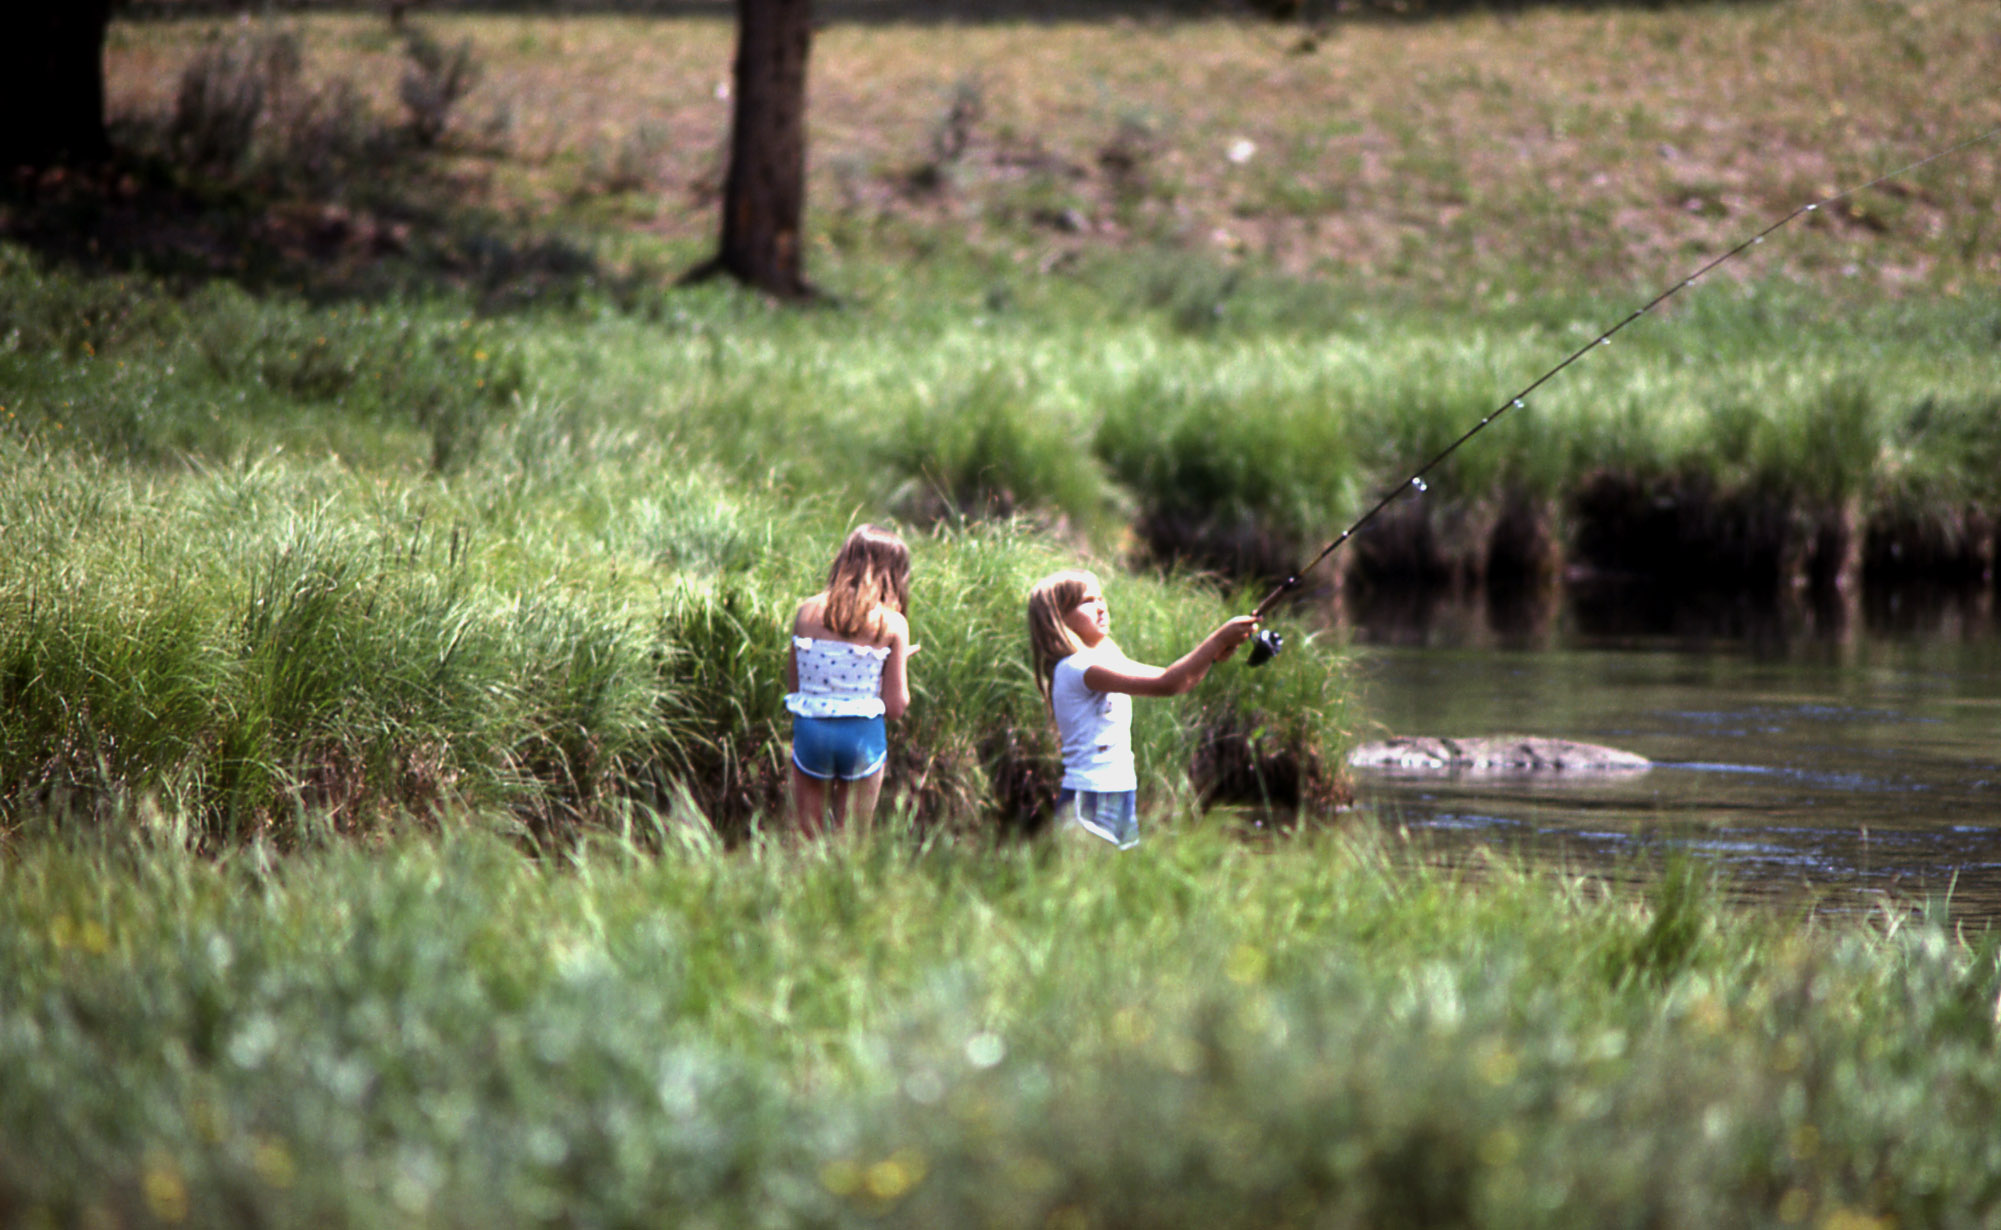 |
Page 112: 10299.jpg. No caption. Credit: Photograph by William S. Keller, U.S. National Park Service. |
 |
Page 115: arizona_alt.tif. Caption: Wastewater-treatment plant effluent provides much of the streamflow in the Santa Cruz River at Tubac, Arizona, during part of the year. Photograph by Gail E. Cordy, U.S. Geological Survey. [from Circular 1213] |
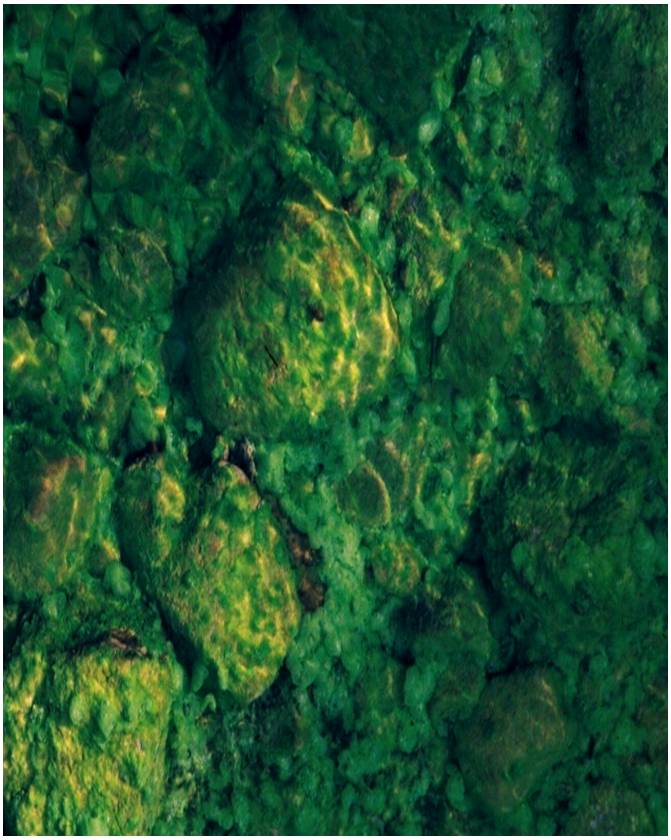 |
Page 124, top: Algae1.jpg (Photograph by Carmen Burton, U.S. Geological Survey) |
 |
Page 124, middle: btricaudatus.tif (Photograph by Steve Fend, U.S. Geological Survey) |
 |
Page 124, bottom: measuring_fish.tif (Photograph by Jason May, U.S. Geological Survey). Caption: Some State water-quality programs use assessments of algal, invertebrate, or fish communities. |
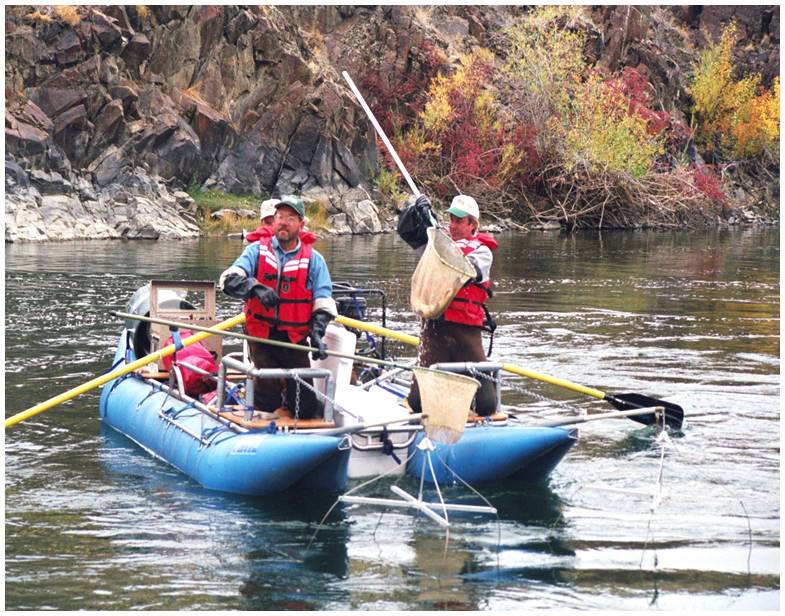 |
Page 126: Electrofishing1.jpg. Caption: Fish are electroshocked, collected, surveyed, and released back to the stream to determine a census of fish population. Photograph by Terry Maret, U.S. Geological Survey. |
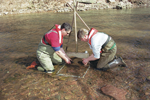 |
Page 126: collecting_inverts.tiff. Caption: Macroinvertebrates are collected with a Slack sampler. Photograph by Dennis Sun, U.S. Geological Survey. |
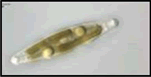 |
Page 127, left: diatom3.gif.No Caption. Credit: Photgraphs printed with permission from the Academy of Natural Sciences, Patrick Center for Environmental Research Algae Image Database. |
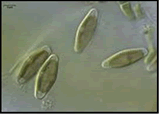 |
Page 127, middle: diatom1.gif. No Caption. Credit: Photgraphs printed with permission from the Academy of Natural Sciences, Patrick Center for Environmental Research Algae Image Database. |
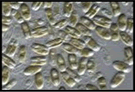 |
Page 127, right: diatom2.gif. No Caption. Credit: Photgraphs printed with permission from the Academy of Natural Sciences, Patrick Center for Environmental Research Algae Image Database. |
Chapter 8
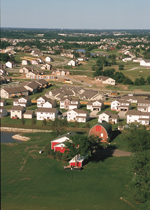 |
Page 131: ag_urban_conversion.tif. No caption. Credit: Photograph by Lynn Betts, U.S. Department of Agriculture, Natural Resources Conservation Service. |
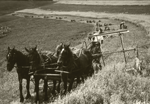 |
Page 132: wisconsin_farm_1943.tif. Caption: Prior to widespread use of commercial fertilizer, livestock waste was the major source of nutrients for crops on family farms. Photograph by U.S. Department of Agriculture, Natural Resources Conservation Service. |
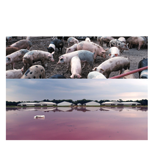 |
Page 136: Pigs_and_pond_jmg.tif. Caption: Geographic shifts in the location and numbers of livestock changed the distribution of nutrient inputs in some areas of the country. In North Carolina, the number of hogs and pigs nearly doubled between 1992 and 1997. Photograph by Lynn Betts, U.S. Department of Agriculture, Natural Resources Conservation Service (top), and Steve Reid, North Carolina Division of Water Quality, Raleigh, North Carolina (bottom). |
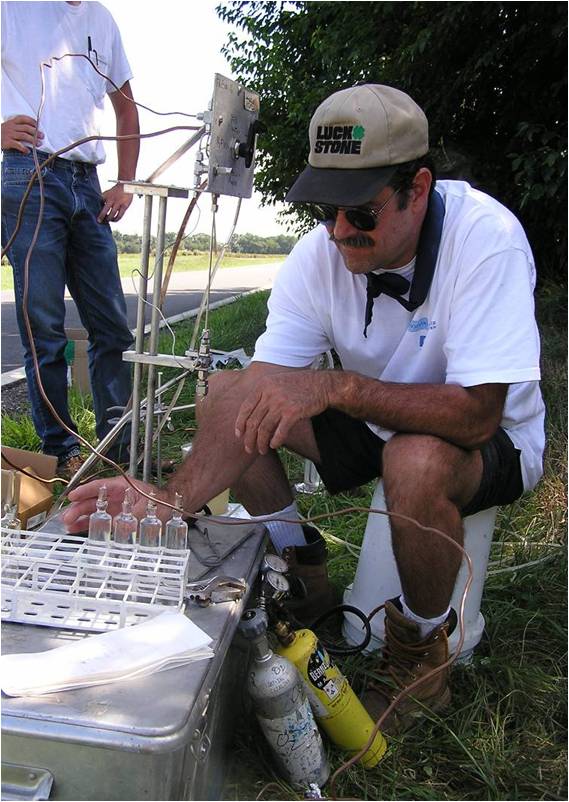 |
Page 147: CFCsampling.jpg. Caption: Samples for groundwater are sealed in glass ampoules in the field prior to shipping to the laboratory for determination of the recharge date. Photograph by U.S. Geological Survey. |
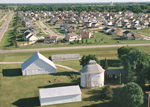 |
Page 153: Ag_urban_interface…tif. Caption: Urban encroachment may result in public supply wells withdrawing groundwater that recharged through agricultural lands. Photograph by Lynn Betts, U.S. Department of Agriculture, Natural Resources Conservation Service. |

 U.S. Department of the Interior |
U.S. Geological Survey
[an error occurred while processing this directive]
URL: http://water.usgs.gov
Page Contact Information: Carise Barbour
Page Last Modified: Tuesday, 20-Sep-2011 13:15:37 EDT

