Examples of explanatory variables and
probability models
http://pubs.usgs.gov/sim/2005/2881/
Nitrate in ground water: Using a
model to simulate the probability of nitrate contamination of shallow ground
water in the conterminous United
States
By: Kerie J. Hitt and
Bernard T. Nolan
http://water.usgs.gov/nawqa/nutrients/pubs/est_v36_no10/
Probability of Nitrate Contamination of Recently
Recharged Ground Waters in the Conterminous United States
By Bernard
T. Nolan, Kerie J. Hitt, Barbara C. Ruddy
[Environmental Science and Technology, v.
36, no. 10, p. 2138-2145. This article supersedes ES&T vol. 31, no. 8; WCP
vol. 39, no. 12; and FS-092-96.]
Abstract
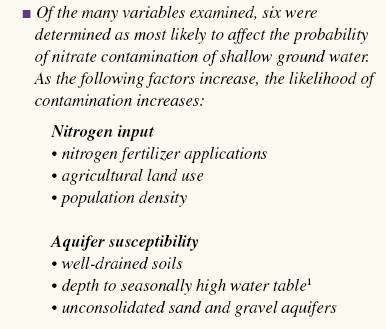
A new logistic regression (LR) model was used to predict the probability of
nitrate contamination exceeding 4 mg/L in predominantly shallow, recently
recharged ground waters of the United
States. The new model contains variables
representing (1) N fertilizer loading (p < 0.001) , (2) percent
cropland-pasture (p < 0.001), (3) natural log of human population density (p
< 0.001), (4) percent
well-drained soils (p < 0.001), (5) depth to the seasonally high water table (p
<0.001), and (6) presence or absence of unconsolidated sand and gravel
aquifers (p = 0.002). Observed and average predicted probabilities associated
with deciles of risk are well correlated (r2 = 0.875), indicating
that the LR model fits the data well. The likelihood of nitrate contamination
is greater in areas with high N loading and well-drained surficial soils over
unconsolidated sand and gravels. The LR model correctly predicted the status of
nitrate contamination in 75% of wells in a validation data set. Considering all
wells used in both calibration and validation, observed median nitrate concentration
increased from 0.24 to 8.30 mg/L as the mapped probability of nitrate exceeding
4 mg/L increased from less than or equal to 0.17 to > 0.83.
http://water.usgs.gov/nawqa/nutrients/pubs/wri02-4289/
Nutrients in shallow ground waters beneath relatively
undeveloped areas in the conterminous United States
By Bernard
T. Nolan and Kerie J. Hitt
[U.S.
Geological Survey Water-Resources Investigations Report 02-4289]
Abstract
Nutrient concentrations in shallow (well depth of 30 meters or less) ground waters
of relatively undeveloped areas were evaluated to determine background
conditions relative to agricultural and urban land uses. Lands comprising 67
percent or greater forest or range, 10 percent or less agricultural land, and
10 percent or less urban land were used to represent relatively undeveloped
areas. Data subsets from the U.S. Geological Survey's National Water-Quality
Assessment Program (81 wells) and retrospective studies (320 wells) yielded
75th percentile nitrate concentrations of 0.51 and 1.1 milligrams per liter,
respectively, in shallow ground water beneath relatively undeveloped areas. The
value of 1.1 milligrams per liter is a reasonable upper bound estimate of
relative background concentration of nitrate in shallow ground waters in the United States
and incorporates effects of nominal nitrogen load to susceptible aquifers.
Relative background concentration of nitrate is variable and depends in part on
land use, rock type, and climate. Median nitrate concentration was
significantly greater in ground water beneath rangeland (1.20 milligrams per
liter) than beneath forest land (0.06 milligram per liter). Median nitrate
concentration in ground water beneath rangeland was 1.4-2.7 milligrams per
liter in susceptible aquifers, which consist of coarse-textured deposits or
fractured rock. Increased relative background concentration of nitrate in
rangeland areas likely results from evaporative concentration of nominal
nitrogen load associated with natural organic and inorganic sources in hydrogeologically
susceptible settings.
http://id.water.usgs.gov/PDF/wri984203/index.html
Probability of
detecting atrazine/DEA and elevated concentrations of nitrate in ground water
in the Idaho part of the upper Snake River
Basin
Atrazine/DEA
Land use, precipitation,
soil hydrologic group, and well depth significantly improved the ability of all
the models to predict the probability of atrazine/DEA in ground water. Depth to
ground water, geology, soil clay content, soil drainage, and soil organic
matter did not significantly improve the effectiveness of any of the
multivariate models.
Nitrate
Depth to
water, land use, and soil drainage had statistically significant
relations with elevated nitrate concentrations.
The differences between atrazine/DEA and nitrate relations were
attributed to differences in chemical behavior of these compounds in the
environment and possibly to differences in the extent of use and rates of their
application.
http://www.agiweb.org/geotimes/nov01/feature_Asmap.html
Mapping Arsenic in Groundwater by
Sarah Ryker
No single,
perfect map
Any single map that attempts to summarize an entire national data set is
necessarily a limited view. Each arsenic map the USGS released last year
provides a big-picture view, but a closer look at any smaller geographic area
quickly finds exceptions to national patterns. Areas of southern California have high arsenic in groundwater, but the city
of Los Angeles
relies primarily on surface water. In Minnesota,
the data set includes arsenic measurements from many different aquifer systems,
and this map ignores these differences. In New England,
most of the arsenic data shown are from bedrock aquifers used by private wells.
This dataset does not account for glacial aquifers used by public water
supplies.
National-scale maps serve an educational purpose and stimulate discussion, but
are not well suited to local planning. As with many generalizations, these maps
are better at starting debates than ending them.
http://water.usgs.gov/nawqa-only/trace/GWprocess/frameworks.html
Understanding Trace Elements in Ground
Water-- Regional (multi-Study-Unit) explanatory frameworks
http://sd.water.usgs.gov/nawqa/pubs/journal/EST.mixtures.squillace.pdf
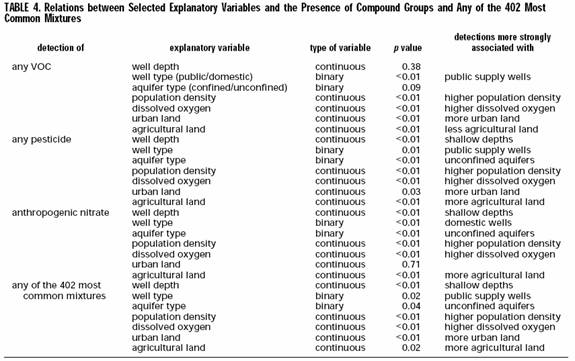
VOCs, Pesticides, Nitrate, and Their
Mixtures in Groundwater Used for
Drinking Water in the United States
ftp://ftpint.usgs.gov/private/cr/jsz/RefinedCir.pdf
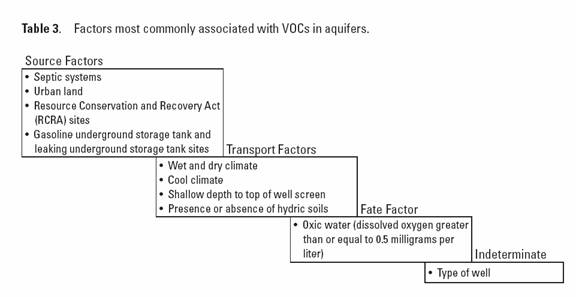
3rd draft of VOC circular
http://water.usgs.gov/pubs/wri/wri02-4269/pdf/WRIR02-4269.pdf
Probability of Detecting
Atrazine/Desethyl-atrazine and Elevated Concentrations of Nitrate in Ground
Water in Colorado
By Michael G. Rupert
Maps showing the probability of detecting
atrazine and(or) desethyl-atrazine (atrazine/DEA) at or greater than
concentrations of 0.1 microgram per liter and nitrate concentrations in ground
water greater than 5 milligrams per liter were developed as follows: (1)
Ground-water quality data were overlaid with anthropogenic and hydrogeologic
data using a geographic information system to produce a data set in which each
well had corresponding data on atrazine use, fertilizer use, geology,
hydrogeomorphic regions, land cover, precipitation, soils, and well
construction. These data then were downloaded to a statistical software package
for analysis by logistic regression. (2) Relations were observed between
ground-water quality and the percentage of land-cover categories within
circular regions (buffers) around wells.
Several buffer sizes were evaluated; the buffer size that provided the
strongest relation was selected for use in the logistic regression models. (3)
Relations between concentrations of atrazine/DEA and nitrate in ground water
and atrazine use, fertilizer use, geology, hydrogeomorphic regions, land cover,
precipitation, soils, and well-construction data were evaluated, and several
preliminary multivariate models with various combinations of independent
variables were constructed. (4) The multivariate models that best predicted the
presence of atrazine/ DEA and elevated concentrations of nitrate in ground
water were selected. (5) The accuracy of the
multivariate models was confirmed by validating the models with an independent
set of ground-water quality data. (6) The multivariate models were entered into
a geographic information system and the probability maps were constructed.
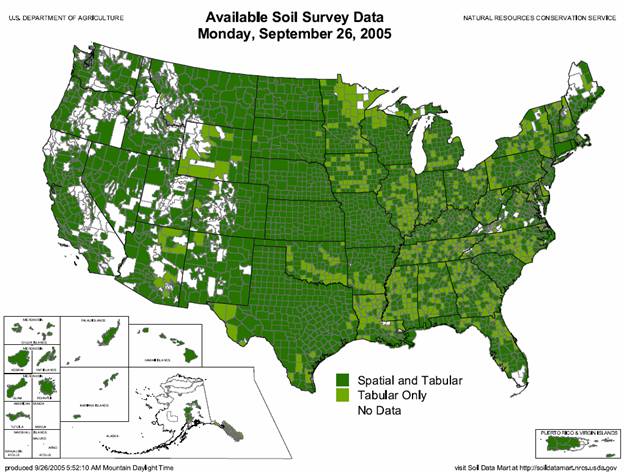
http://www.ncgc.nrcs.usda.gov/products/datasets/ssurgo/
Soil Survey Geographic (SSURGO) Database
The Natural Resources Conservation Service (NRCS) - National Cartography and
Geospatial Center (NCGC) previously archived and distributed the Soil Survey
Geographic (SSURGO) Database. Only file downloads were available from this
site. This limited the amount of soil survey information that could be
accessed. The NRCS NCGC also supplied SSURGO data to the United States
Department of Agriculture - Service Center Agencies (Farm Services Agency,
Natural Resources Conservation Service, and Rural Development) Geospatial Data Gateway. While the
Gateway provides file downloads, a customer can also order SSURGO data on CD-ROM or DVD. The NRCS Soil Survey Division recognized
that increased functionality for access of soil survey information was needed.
In December 2003 the Soil Data Mart web application came online. The SSURGO data were migrated to the
Soil Data Mart during 2004.
http://earth.gis.usu.edu/swgap/
Southwest
Regional Gap Analysis Project
'PROVISIONAL' Landcover and Related Datasets
The Gap Analysis Program (GAP) is a national program of the U.S. Geological
Survey (USGS) Biological Resources Division that maps the distribution of plant
communities and selected animal species and compares these distributions with
land stewardship to identify biotic elements at potential risk of endangerment.
GAP uses Geographic Information System (GIS) technology to assemble and view
large amounts of biological and land management data to identify areas (gaps)
where conservation efforts may not be sufficient to maintain diversity of
living natural resources.
Winter, T.C., 2001, The concept of hydrologic landscapes:
Journal of the American Water Resources Association, v. 37, no. 2, p. 335-350.
Hydrologic
landscapes are multiples or variations of fundamental hydrologic landscape
units. A fundamental hydrologic landscape unit is defined on the basis of
land-surface form, geology, and climate. The basic land-surface form of a
fundamental hydrologic landscape unit is an upland separated from a lowland by
an intervening steeper slope. Fundamental hydrologic landscape units have a
complete hydrologic system consisting of surface runoff, ground-water flow, and
interaction with atmospheric water. By describing actual landscapes in terms of land-surface slope,
hydraulic properties of soils and geologic framework, and the difference
between precipitation and evapotranspiration, the hydrologic system of actual
landscapes can be conceptualized in a uniform way. This conceptual
framework can then be the foundation for design studies and data networks,
syntheses of information on local to national scales, and comparison of process
research across small study units in a variety of settings. The Crow Wing River watershed in central Minnesota is used as an example of
evaluating stream discharge in the context of hydrologic landscapes.
Lake-research watersheds in Wisconsin, Minnesota, North Dakota,
and Nebraska
are used as an example of using the hydrologic-landscapes concept to evaluate
the effect of ground water on the degree of mineralization and major-ion
chemistry of lakes that lie within ground-water flow systems.
http://water.usgs.gov/GIS/metadata/usgswrd/XML/hlrus.xml
Hydrologic
landscape regions of the
United
States
Wolock, D.M, Winter, T.C., and
McMahon, G., 2004, Delineation and evaluation of hydrologic landscape regions
in the United States using geographic information system tools and multivariate
statistical analysis: Environmental Management, v. 34, Suppliment 1, p.
S71-S78.
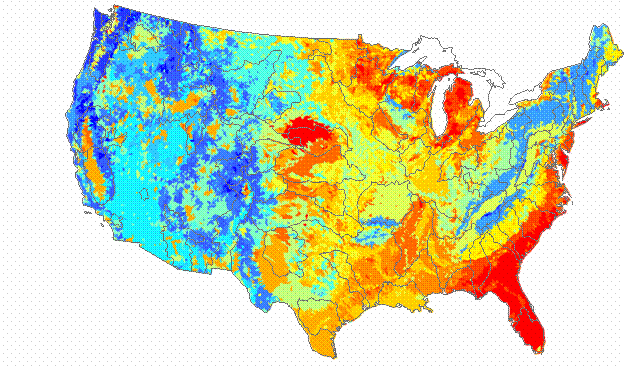
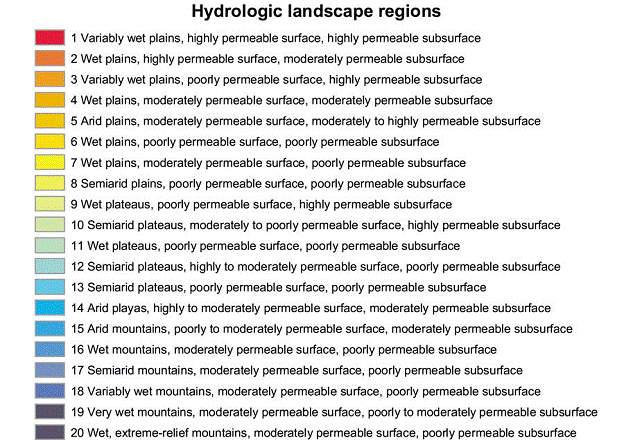
Hydrologic-landscape regions in the United States
were delineated by using geographic information system (GIS) tools combined
with principal components and cluster analyses. The GIS and statistical
analyses were applied to land-surface form, geologic texture (permeability of
the soil and bedrock), and climate variables that describe the physical and
climatic setting of 43,931 small (approximately 200 km2) watersheds in the United States.
(The term "watersheds" is defined in this paper as the drainage areas
of tributary streams, headwater streams, and stream segments lying between two
confluences.) The analyses based on similarities in land-surface form, geologic
texture, and climatic characteristics. The percentage of explained variance
(R-squared value) in an analysis of variance was used to compare the
hydrologic-landscape regions to 19 square geometric regions and the 21 U.S. Environmental
Protection Agency level-II ecoregions. Hydrologic-landscape regions generally
were better than ecoregions at delineating regions of distinct land-surface
form and geologic texture. Hydrologic-landscape regions and ecoregions were
equally effective at defining regions in terms of climate, land cover, and
water-quality characteristics. For about half of the landscape, climate, and
water-quality characteristics, the R-squared values of square geometric regions
were as high as hydrologic-landscape regions or ecoregions.
http://wwwdcascr.wr.usgs.gov/pub/www/uo/pnsp/nit/apd.doc
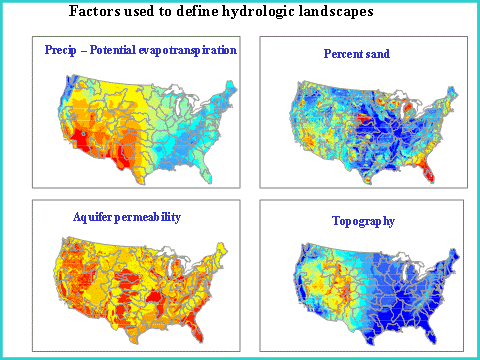
The critical features used to describe Winter’s hydrologic
landscapes are (1)
land-surface form, to determine land-surface slopes and relief, (2) geologic
texture, to estimate permeability of surficial and subsurface materials that
control upland runoff, infiltration, and ground-water flow systems, and (3)
climate, to approximate available water to surface and ground-water systems.
http://wwwdcascr.wr.usgs.gov/pnsp/nit/powerpt/
Environmental framework in NAWQA cycle II
Among-region variability in the
factors is maximized and within-region variability is minimized.
http://water.usgs.gov/nawqa-only/guidance/cycle2_design/DDWjune28_2001PM-rpt.pdf
Chapter 2 – Environmental framework for design
http://wwwdcascr.wr.usgs.gov/pnsp/nit/powerpt/
Example study using GIS and regression models
http://water.usgs.gov/nawqa-only/guidance/cycle2_design/DDWjune28_2001PM-rpt.pdf
pg 26
http://water.usgs.gov/GIS/metadata/usgswrd/XML/ca_provinces.xml
Hydrogeologic
Provinces for
California
based upon established groundwater basins and watershed polygons.
Abstract:
Ten hydrogeologic provinces of California are
represented by a region-
class feature called
"provinces" within this digital data set. These
provinces were identified and
defined in the USGS Water Resource
Investigation Report (WRIR) 03-4166
(Belitz and others, 2003) titled,
"Framework for a Ground-water
Quality Monitoring and Assessment Plan for
California". Hydrogeologic provinces
are generalized areas where hydrology
and/or geology have similar
characteristics. The Southern Cal
Islands
group was not previously defined as
a province in WRIR 03-4166, and is
therefore identified as a group in
this dataset.
These provinces were created by
grouping polygons from two formally created
digital data sets into respective
provinces. New polygons were created
where necessary. The two digital
data set sources consisted of watershed
polygons (calwater) and groundwater
basin polygons (gw_basins) compiled to
create an original publication of
hydrogeologic province boundaries in the
form of a region-class within the
data set. By symbolizing on the region-
class, the user can view the ten
hydrogeologic provinces and one grouped
province in their simplest
representation, without watershed and ground-
water basin boundaries obscuring
the province areas.
Original polygons for both the watershed data set and the
ground-water basin
data set were retained as much as possible.
http://water.usgs.gov/GIS/metadata/usgswrd/XML/nv_hlrnv_g.xml
Hydrologic
landscape regions of
Nevada
Maurer, D.K., Lopes, T.J., Medina, R.L., and Smith, J.L., 2004, Hydrogeology and
hydrologic landscape regions of Nevada:
U.S. Geological Survey Scientific Investigations Report 2004-5131, 35 p.
http://wwwbrr.cr.usgs.gov/projects/SW_precip_runoff/weasel/
The GIS Weasel - An
Interface for the Development of Spatial Parameters for Physical Process
Modeling