|
NAWQA
Intranet ||
Public
National Synthesis
Ecology ||
Pesticides
Nutrients ||
TE ||
VOCs
Reconstructed Trends
Regional Synthesis
MRB ||
PA
Topical Teams
ACT ||
Hg ||
NEET
TANC ||
EUSE ||
HST
Data
Data Warehouse
Bio-TDB
Data Synthesis
Archiving
GIS
Work Plan Guidance
FY09
Archives
Water
Intranet ||
Public
USGS
Intranet ||
Public
|
|

Water Withdrawals From Select Principal Aquifers
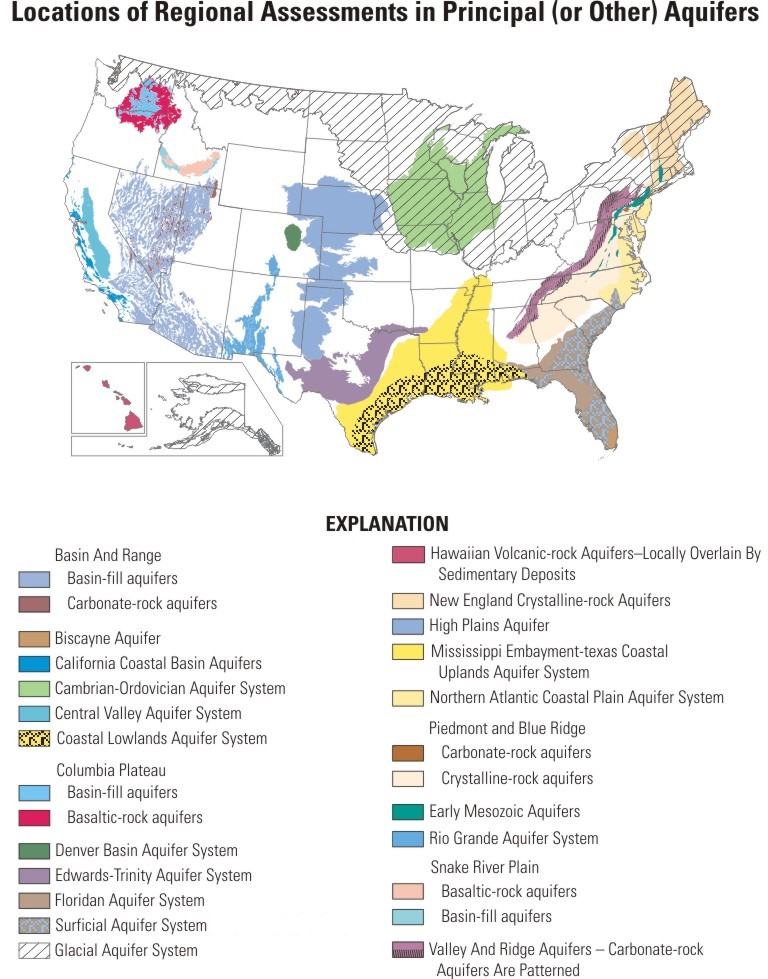
In aggregate, the principal aquifers being studied by NAWQA accounted for more than three fourths of the estimated withdrawals for public supply in 2000 from all principal aquifers (Maupin and Barber, 2005).
| Table 1. Water withdrawals from select principal aquifers. |
| [ ---, No information; S & G, Unconsolidated sand and gravel; Semicon. sand, Semiconsolidated sand; SS, Sandstone; Carb, Carbonate; Cry, Crystalline rocks] |
| Principal or Other Aquifer (listed from largest to smallest area) |
Approximate Area of Aquifer, in square miles7 |
Primary Lithologies of the Aquifer |
Number of NAWQA Study Units overlying the Aquifer by at least 1% of the SU area |
Aquifer Rank1 by Drinking-Water Use (Public Supply + Domestic Use) |
Aquifer Rank1 by Public Supply Use |
Withdrawals for
Public Supply3,
in million gallons per day |
Aquifer Rank1
by Irrigation +
Public
Supply +
Self-supplied Industrial Use |
Withdrawals for Irrigation + Public Supply +
Self-supplied Industrial3,
in million gallons per day |
| 19902 |
20003 |
20003 |
20003 |
20003 |
| Glacial aquifer system4 |
953,148 |
S & G |
18 |
1 |
1 |
1,950 |
6 |
3,560 |
| Mississippi Embayment-Texas Coastal Uplands aquifer system |
|
Mississippi Embayment aquifer system
|
|
Texas Coastal Uplands aquifer system
|
|
|
| Semicon. sand |
| Semicon. sand |
| Semicon. sand |
|
|
|
|
|
|
|
| Cambrian-Ordovician aquifer system |
177,369 |
SS |
5 |
8 |
10 |
590 |
16 |
932 |
| High Plains aquifer |
176,534 |
S & G |
4 |
13 |
14 |
389 |
1 |
17,500 |
| Basin and Range basin-fill and carbonate-rock aquifers |
|
Basin and Range basin-fill aquifers
|
|
Basin and Range carbonate-rock aquifers
|
|
|
|
|
|
|
|
|
|
| Floridan aquifer system and overlying Surficial aquifer system5 |
|
Floridan aquifer system
|
|
Surficial aquifer system 6
|
|
|
|
|
|
|
|
|
|
| Coastal Lowlands aquifer system |
98,890 |
Semicon. sand |
4 |
5 |
5 |
1,010 |
9 |
2,370 |
| Piedmont and Blue Ridge crystalline and carbonate-rock aquifers |
|
Piedmont and Blue Ridge crystalline-rock aquifers
|
|
Piedmont and Blue Ridge carbonate-rock aquifers
|
|
|
|
|
|
|
|
|
|
| Edwards-Trinity aquifer system |
75,059 |
SS & Carb |
2 |
11 |
12 |
411 |
20 |
740 |
| New England crystalline-rock aquifers |
70,668 |
Cry |
4 |
26 |
31 |
74 |
41 |
96 |
| Northern Atlantic Coastal Plain aquifer system |
44,312 |
Semicon. sand |
4 |
6 |
7 |
793 |
15 |
1,040 |
| Columbia Plateau basin-fill and basaltic-rock aquifers |
|
Columbia Plateau basin-fill aquifers
|
|
Columbia Plateau basaltic-rock aquifers
|
|
|
| S & G; Basalt |
| S & G |
| Basalt |
|
|
|
|
|
|
|
| Valley and Ridge and Valley and Ridge carbonate-rock aquifers |
|
Valley and Ridge aquifers (Sandstone)
|
|
Valley and Ridge carbonate-rock aquifers
|
|
|
|
|
|
|
|
|
|
| Rio Grande aquifer system |
29,250 |
S & G |
1 |
--- |
17 |
240 |
13 |
1,120 |
| Central Valley aquifer system |
20,306 |
S & G |
2 |
7 |
6 |
839 |
2 |
9,810 |
| California Coastal Basin aquifers |
10,200 |
S & G |
1 |
2 |
2 |
1,580 |
7 |
3,440 |
| Denver Basin aquifer system |
6,805 |
SS |
1 |
50 |
49 |
17 |
50 |
36 |
| Hawaiian volcanic-rock aquifers |
6,439 |
Basalt |
1 |
--- |
16 |
243 |
22 |
428 |
| Biscayne aquifer |
3,573 |
Carb |
1 |
10 |
9 |
698 |
19 |
812 |
| Snake River Plain basin-fill and basaltic-rock aquifers |
|
Snake River Plain basin-fill aquifers
|
|
Snake River Plain basaltic-rock aquifers
|
|
|
| S & G; Basalt |
| S & G |
| Basalt |
|
|
|
|
|
|
|
| Alluvial aquifers |
-- |
S & G |
-- |
-- |
11 |
456 |
10 |
1,800 |
| 1 Rank 1 is largest water use |
| 2 1990 water use from Marilee Horn, 1999, written commun., unpublished data for internal use only. |
| 3 Maupin, M.A. and Barber, N.L., 2005, Estimated withdrawals from principal aquifers in the United States, 2000: U.S. Geological Survey Circular 1279, 46 p. |
| 4 Includes that part of the glacial aquifer system that was Wisconsinan glaciation by the Laurentide ice sheet; the area of that portion of the glacial aquifer is 670,839 sq. miles (Soller and Packard, 1998, USGS DDS-38). |
| 5 Includes that part of the Surficial aquifer system that overlies the Floridan aquifer system. |
| 6 Includes that part of the Surficial aquifer system that overlies the Floridan aquifer system (reported from the states of South Carolina and Florida) (modified from Maupin and Barber, 2005) |
| 7 Some aquifer areas were updated (03/17/2008) from the 1988 v. principal aqufier coverages digitized by CAPP |
|
|
|
|
|
|
|
|
|
|
|
|
|