In Reply Refer To: December
7, 2001
Mail
Stop 415
OFFICE
OF SURFACE WATER TECHNICAL MEMORANDUM 2002.03
SUBJECT: Release of WinRiver
Software (version 10.03) for Computing Streamflow from
Acoustic Profiler Data
The
purpose of this memorandum is to announce the availability of WinRiver 10.03
for collecting and processing data collected with RD Instruments (RDI) acoustic
profilers (Broadband, Rio Grande, Workhorse, and others). The WinRiver software
was developed by RDI, in cooperation with the USGS, as a part of a Cooperative
Research and Development Agreement (CRADA). The use of WinRiver software by
USGS offices was announced in Office of Surface Water Technical Memorandum
No. 2000.03.
The
WinRiver software continues to be updated and improved. Various new features
are included in this release of WinRiver and many known problems have been
fixed. Lists of new features, changes
to existing features, and bugs fixed are provided in Attachment A. At least one known bug remains in WinRiver
10.03. Attachment B documents this bug,
as well as two other bugs that appear to have been fixed. All USGS users who collect streamflow data
must upgrade to WinRiver 10.03. The
latest version of the software is available to USGS personnel who own and use
ADCP’s manufactured by RDI at http://hydroacoustics.usgs.gov/downloads/setupex.exe.
The
following sections contain information about two major enhancements in WinRiver
10.03, the addition of a configuration wizard for configuring the ADCP and the
addition of data-screening tools. In
the following sections, italicized text refers to menu options or buttons in
the WinRiver software.
Configuration
Wizard
The configuration wizard is a tool that can be used to set up an ADCP for data collection. The goal of the configuration wizard is to guide the user through the ADCP setup process and reduce the need to remember all direct commands. The OSW hopes that the addition of this feature will minimize some of the common mistakes that occur when setting up ADCP’s for discharge measurements.
The
configuration wizard is invoked in Acquire mode by selecting Configuration
Wizard under the Settings menu or by pressing Shift-F6. An example of the configuration wizard is
shown below.
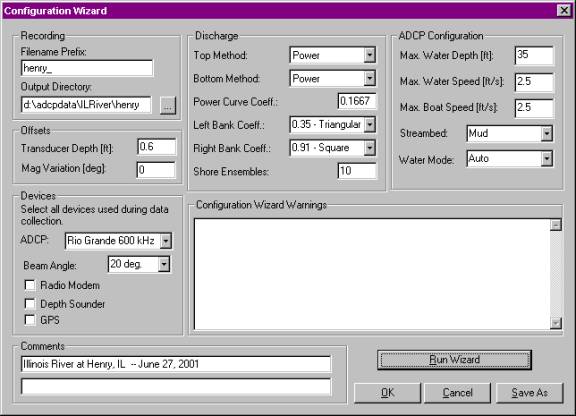
When
the Run Wizard button is pressed, the wizard verifies that the required
fields have been entered by the user and uses these values to generate a
configuration file for the measurement.
The appropriate direct commands are specified, based on rules supplied
by the USGS to RD Instruments, including depth cell size, number of depth
cells, ambiguity velocity, and water mode.
The wizard also scales the chart properties accordingly based upon the
entered values. Although the software has been tested and we are reasonably
confident that the configuration wizard will work well, users always should
check to make sure that the direct commands are appropriate. In particular, users should pay attention to
the Configuration Wizard Warnings generated after running the wizard.
After
running the configuration wizard, pressing Save As will save the
configuration file as a WinRiver configuration file. Pressing OK will apply the wizard-generated settings to
the currently loaded configuration file.
The user then can select Save or Save As from the File
menu to save the configuration file.
After the configuration wizard window is closed, the configuration file
settings created by the wizard can be viewed in the Configuration Settings window. The direct commands generated by the
configuration wizard are listed under the Commands tab of the Configuration
Settings window in the second column labeled Wizard Commands. Wizard
Commands can override Fixed Commands and User Commands can override Wizard
Commands.
Data Screening
Tools
The
capability of WinRiver 10.03 to screen data in software provides a better
approach to processing data that should result in more accurate measurement of
discharge. Previously all screening was done in the firmware of the ADCP. The new data-screening switches and
threshold variables are found in the Configuration Settings window,
under the Processing tab.
The
first set of screening tools is for the acceptance or rejection of 3-beam
solutions. In the past, users determined
whether to allow 3-beam solutions using the EX command. This determination was an irreversible
decision that applied to both water-track and bottom track data that had to be
made before data collection. With this new screening tool all raw data can be
collected by setting the EX command (EX10111) to accept 3-beam solutions (which
is now the default in WinRiver) and then accepting or rejecting 3-beam
solutions in WinRiver after the user reviews the data. Three-beam solutions
often indicate that a fish or other object has interfered with one beam, which
can cause the sound reflected by that object to contaminate the neighboring
beams. Thus, simply throwing out the
bad beam and accepting a 3-beam solution can cause errors in the measured
velocity. In most situations, 3-beam solutions should be rejected and the
default setting for water-track is to reject 3-beam solutions. The cause of
3-beam solutions in bottom-track data is different and it generally is
acceptable to use 3-beam solutions for bottom tracking, and the default setting
is to accept 3-beam solutions for bottom tracking.
The
next set of screening tools allows the rejection of data in individual bins
based on the error velocity and (or) vertical velocity in that bin. Ambiguity errors and areas of highly
non-homogeneous flow cause high values in the error and vertical velocity
magnitudes. Contour plots of the error or vertical velocity with the
appropriate color scale can be used to identify data that obviously are
different from the surrounding data.
Likewise, time-series plots of the boat speed or water speed, and the
stick ship-track plot, can show unreasonable spikes. Prior to the release of
this version, no mechanism was available for removing data containing obvious
ambiguity errors or data with high error velocities because of non-homogeneous
flow. By appropriately setting the
error and vertical velocity thresholds, WinRiver 10.03 will mark these data as
invalid and compute discharge in these areas from neighboring valid data. By
default, the thresholds are set very high, which for practical purposes turns
off the screening. Reasonable values for the error velocity thresholds are a
function of the standard deviation of the velocity measurement in a single bin,
which is dependent on the frequency of the ADCP, the bin size, and the
ambiguity velocity setting for mode 1 data. The objective of screening is to
reject only the obviously bad data and because the errors are normally
distributed, a threshold of 3 to 4 times the standard deviation of the velocity
measurement is reasonable (see table 1).
Table
1. Reasonable error velocity thresholds.
[WM
refers to the WM command used to set the water mode in RDI profilers. WS refers to the WS command used to set the
depth cell size in RDI profilers.]
|
ADCP
Frequency (kHz) |
Water Mode [WM] |
Depth Cell Size (m) [WS] |
Standard Deviation[1]
(ft/sec) |
Reasonable Error Velocity
Threshold (ft/sec) |
|
300 |
1 |
1.00 |
0.59 |
1.8 |
|
5 |
0.20 |
0.03 |
0.1 |
|
|
8 |
0.20 |
0.86 |
2.5 |
|
|
600 |
1 |
0.50 |
0.59 |
1.8 |
|
5 |
0.10 |
0.03 |
0.1 |
|
|
8 |
0.10 |
0.86 |
2.5 |
|
|
1200 |
1 |
0.25 |
0.59 |
1.8 |
|
5 |
0.10 |
0.02 |
0.1 |
|
|
8 |
0.10 |
0.81 |
2.5 |
Setting
the threshold for the vertical velocity is not as straightforward as the error
velocity threshold. The vertical velocity threshold only should be used if the
user has a reasonable knowledge of the vertical velocities in the measurement
section and (or) observes patterns or banding in the vertical velocity contour
plot. The vertical velocity threshold
then can be set based on the user’s judgment to remove obviously erroneous
data.
The
last screening tool allows users to apply a fish-detection algorithm in the
WinRiver software. When using WinRiver,
by default, a firmware fish detection algorithm is implemented by sending the
direct command, WA50. However, in the
WinRiver software users now can select different values for intensity amplitude
for detecting and removing data that potentially are contaminated by echoes
from fish. This feature has the
advantage of collecting all the raw data and screening the data in
post-processing rather than having the instrument reject the data based on the
configuration setting.
Because
screening data by use of these thresholds is a new feature, we expect that
guidance regarding their use will change as we gain experience. Additional information regarding the use of
thresholds will be made available through the OSW ADCP Web pages (http://hydroacoustics.usgs.gov/).
J.
Michael Norris
Acting
Chief, Office of Surface Water
Attachments (2)
SUPERCEDES OSW TECHNICAL MEMORANDUM NO. 2000.03
Distribution Code: A, B, FO, PO
Attachment A –
Changes to WinRiver since release of version 10.01
Features Added
- Implemented Configuration Wizard.
- Added near-zone correction for backscatter.
- Added features to go to a specific ensemble number (Ctrl-Home).
- In User Options, a field on the Acquire Mode tab was added to
enter Terminal Program path (like BBTalk, DumbTerm, or others).
- Added menu item to execute a Terminal Program from within Acquire
Mode.
- Added F12 key shortcut to toggle display of Discharge History
Tabular view.
- Added F9 key shortcut to toggle display of Ensemble Header Tabular
view.
- Added F11 key shortcut to toggle display of Composite Tabular and
Discharge Detail Tabular views.
- On the Discharge History Tabular window all transects greater than
±5% from the average
(based on Total Discharge) now have a red font color.
- Added 3-beam solutions screening.
- Added error velocity screening.
- Added vertical velocity screening.
- Added capability to screen out data contaminated by fish within
with the acoustic beams.
- Added “Q/Area” to Discharge History Tabular view.
- Added “Go To Ensemble” feature.
- Added F8 key shortcut to toggle left/right bank.
- Added F2 key shortcut to set the Mean Flow Dir. as Projected Angle.
- Added accelerator character keys in configuration window to allow
easier navigation without a pointing device.
- Subsectioning values are now saved to the configuration file so
that when a file is loaded it automatically is subsectioned, if it
previously had been subsectioned.
- Show on status bar that data are averaged (right low corner).
- Process control bar changes color when a transect has been
subsectioned.
- Generate a warning if ws*wn<measured depth.
- Ship track plot is no longer frozen while not recording.
- The user now can set a starting file number for raw data files.
- CL0 now is added automatically to fixed commands when
"===" is selected for break.
- Added Reset button to reset configuration parameters back to
*w.000 parameters.
- Added checking COM1-COM256 instead of COM1-COM9.
Changes made to existing features
- Changed behavior for the subsection. If the file is positioned at the end of the subsection and a
new selection for “All Ensembles” is made, the file will be reset to the
beginning and played to the end.
- Changed order of the way units were displayed. First selection is “English” units.
- Changed temperature display on the Standard Tabular view from °C
to °F, if English units are selected.
- Expert parameters in User Options are reset to defaults on exiting
the program. Before they were
saved to registry.
- Changed the order of fixed commands to be alphabetical.
- Changed default for cross-sectional area computation to “Parallel
to Average Course”.
- Changed description on Discharge Detail Tabular view from “Flow
Speed” to “Q/Area”.
- Changed “Shore Pings” to “Shore Ensembles”.
- Changed default of EX10101 to EX10111 to
allow software screening of 3-beam solutions
- Changed behavior of Recent File Lists – in
Playback mode, only rawdata files are shown, in Acquire mode, only
configuration files.
- Changed default maximum number of bins from 128 to 255.
- Removed Resets page in Acquire mode.
- Changed default value of shore ensembles to 10 (from 1).
Bugs Fixed
- Fixed the problem with ASCII out repeating velocity values for
invalid data.
- Fixed problem with Win2K communications.
- Fixed the problem with calculating backscatter for up-looking
data.
- Fixed problem with bin mapping (bin mapping also was implemented
on the ship data, which were bin mapped by the instrument’s software).
- Changed Depth Sounder scale factor range (Configuration Settings,
DS/GPS tab) from 0 – 2 to 0.5 – 1.5.
Allowing 0 as a valid entry had caused problems in WinRiver.
- Fixed problem with displaying of the discharge column on Velocity
Tabular view. The data were not
averaged if averaging was selected.
- Fixed the display of “DS Depth” on Navigation and Composite
Tabular views.
- Fixed the implementation of GPS Time Delay.
- Fixed the problem where the last bin was calculated if the “Cut
off bins above side-lobe” was selected and there were bad bins near the
side-lobe.
- Fixed display of fixed commands loaded from w.000 file.
- Fixed saving of fixed commands to w.000 file (line feeds were
missing).
- Fixed magnetic variation correction for earth data.
- Fixed the problem with marking below bottom
for up-looking data.
- Fixed problem with calculating average water
speed for up-looking data.
- Fixed some displays for up-looking data.
- Fixed the problem with Boat Speed Time
series view. When bottom reference was set to “none”, the Boat Speed Time
series plot did not display the boat speed. If the user sets the bottom reference to “none” – WinRiver
will display boat velocity data based on bottom track, providing it is
available.
- Fixed a problem with ASCII-out. If the bottom reference is set to
“none” some parameters where still 0 (distance traveled, distance made
good, etc.).
- Fixed ASCII out option. When a user chooses to display velocity
As Received From ADCP, the velocity now written to the ASCII-Out
file is the velocity data as collected by the ADCP. For example, if a user collects data in
beam coordinates, the Ascii-Out file created now will contain the radial
velocities for each beam.
- Fixed problem in plots; changing sections would not change tick
marks properly.
- Fixed problem with resetting values in the configuration settings
dialog window. If you right clicked and set a new value in a variable,
then right clicked to set a new value in another window, the first
variable reverted to its original value.
- Fixed problem when switching between Playback and Acquire
configuration information was not saved automatically.
- Fixed zoom feature, which would reset after each new ensemble.
- Fixed the behavior of Configuration Settings property pages during
Acquire (it use to gray out during Acquire).
Attachment B –
Known/Possible Bugs with WinRiver Version 10.03
- Some users have reported that WinRiver will sporadically enter
into an infinite loop. We believe
that this bug has been fixed.
However, if anyone does experience this problem, please contact
Kevin Oberg (kaoberg@usgs.gov) or
Dave Mueller (dmueller@usgs.gov) to
report the problem. The bug does
not affect the computations and only is an occasional problem.
- Some users have reported problems with printing color plots from
WinRiver. The resulting plots were printed in gray scale even on color
printers. For the present, the
software has been set to default to a color plot (as opposed to a
grayscale plot). This change seems
to have fixed the problem for color printers at present. Again, if you observe more problems,
please contact Kevin Oberg or Dave Mueller. In general, we suggest that users copy the plots of interest
into a word-processing package, such as Microsoft Word, and print the
plots from that package. This
procedure usually eliminates any problems in printing, and it allows the
user to adjust the size of the plots, etc.
- The correction of the bug identified in Attachment A, Bugs Fixed,
number 9 could result in some minor changes in discharge when transects
are played back in version 10.03.