
In cooperation with the Wisconsin Department of Transportation
Plate 2. Map of Wisconsin showing soil permeability (2,094 Kb PDF).
Flood-Peak Data-Collection Network
Regression Analysis and Flood-Frequency Equations
Application of Estimation Techniques
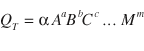
Figure 1. 25-year, 24-hour rainfall in Wisconsin by climatic section (rainf...
Figure 2. Mean annual snowfall from 1961 through 1990, in inches, in Wiscon...
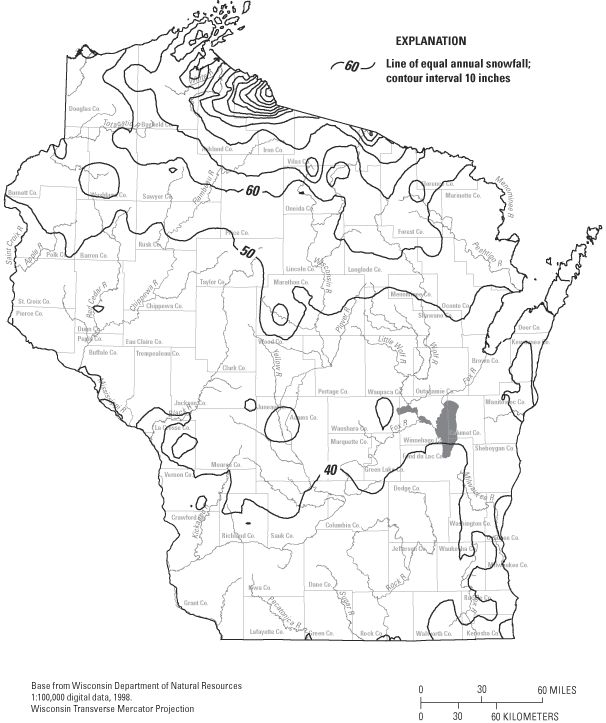
Figure 3. Flood-frequency areas in Wisconsin.
Figure 4. Relation of discharge to drainage area for selected flood frequen...
Figure 5. Relation of discharge to drainage area for selected flood frequen...
Figure 6. Relation of discharge to drainage area for selected flood frequen...
Figure 7. Relation of discharge to drainage area for selected flood frequen...
Table 1. Comparison of regression results for ordinary least squares (OLS) ...
Table 2. Flood-frequency equations for streams in Wisconsin
Table 3. Ranges of basin characteristics used in regression analysis
Table A-1. Flood discharges at selected recurrence intervals and WRC skew f...
Table A-2. Drainage-basin characteristics for rural streamflow-gaging stati...
Plate 2. Map of Wisconsin showing soil permeability
Flood-frequency characteristics for 312 gaged sites on Wisconsin streams are presented for recurrence intervals of 2 to 100 years using flood-peak data collected through water year 2000. Equations of the relations between flood-frequency and drainage-basin characteristics were developed by multiple-regression analyses. Flood-frequency characteristics for ungaged sites on unregulated, rural streams can be estimated by use of these equations. The state was divided into five areas with similar physiographic characteristics. The most significant basin characteristics are drainage area, main-channel slope, soil permeability, storage, rainfall intensity, and forest cover. The standard error of prediction for the equation for the 100-year flood discharge ranges from 22 to 44 percent in the state. A graphical method for estimating flood-frequency characteristics of regulated streams was developed from the relation of discharge and drainage area. Graphs for the major regulated streams are presented.
Flood-frequency information is needed for the design of bridges, culverts, highways, flood-protection structures, and for effective flood-plain management. This study was done in cooperation with the Wisconsin Department of Transportation. This report is the fifth within a long-term study of flood-frequency characteristics of Wisconsin streams. Collectively these studies make up what is referred to as the flood-frequency project.
The first report in the series (Ericson, 1961) developed two sets of regression equations (with and without channel slope as a parameter) for several geographic areas in the state. The second report in the series (Conger, 1971) updated the original report by including additional flood-peak data, refining the geographic areas, and including snowfall as an independent variable. The next version of the report (Conger, 1981) included updated flood-peak data, refined the geographic areas, and added rainfall intensity as an independent variable. The fourth incarnation of the report (Krug and others, 1992) included updated flood-peak data, provided further refinement of the geographic areas, and included an evaluation of alternative land-use data and various regionalization techniques. Other reports that include methods for estimating flood-frequency characteristics of Wisconsin streams were done by Wiitala (1965) and Patterson and Gamble (1968). This report uses the same geographic areas as in the previous report (Krug and others, 1992), includes additional flood-peak data, and updates the values for snowfall and rainfall intensity. Additional data used in this report increase the confidence in estimating techniques and supersede those published in previous reports.
This report includes a description of flood-frequency characteristics of Wisconsin streams where annual peak streamflow data have been collected, presents equations for estimating flood-frequency characteristics at ungaged sites, and includes a discussion of the development of the equations. Additional flood-peak data were collected at the crest-gage stations at most of the same sites as previous studies, with the data-collection period ending in 2000. These stations help provide a uniform distribution of sites throughout the state and a long-term record of flood-peak data.
Because operation of continuous-record streamflow-gaging stations is not part of the flood-frequency project, the locations and lengths of record at these sites are controlled by other needs. Therefore, the distribution and lengths of record are not as uniform as at crest-gage sites. Continuous-record flood-peak data in this study were collected at 175 streamflow-gaging stations whereas the data used by Conger (1981) were collected at 78 stations.
Mari Dantz and Bernard Lenz of the Wisconsin District Office of the U.S. Geological Survey (USGS) were instrumental in updating rainfall and snowfall data and performing some of the preliminary regression analyses.
Flood-peak data used in this study were collected at 137 crest-gage stations and 175 continuous-record streamflow-gaging stations located throughout the state (plate 1). Only the peak stage of a flood is recorded at a crest-stage station. The recorded maximum stage for each year is converted to discharge by a stage-discharge relation for each station. At continuous-record streamflow-gaging stations, a continuous record of stream stage is recorded. The maximum stage for the year is selected and is converted to discharge by a stage-discharge relation. Stations with at least 10 years of record located on rural streams were included. On the basis of these criteria, 312 stations were included in the report. Flood-peak data are available for 104 crest-gage stations and for 108 streamflow-gaging stations now operated (2000) and from 33 crest-gage stations and 67 streamflow-gaging stations that have been discontinued. Of the continuous-record stations, 32 are on streams that are regulated. Sites were classified as regulated based on knowledge of the flow system and hydrologic judgement. The 104 crest-gage stations are operated as part of the flood-frequency project. Most of the crest gages have been operated since the late 1950's or early 1960's. Several stations started to operate around 1970 in northeastern Wisconsin when the first analysis of the data showed the need for more data in this area. Data through the 2000 water year were used for the analysis in this report. Therefore, at least 28 years of flood-peak data were used for most stations; however, about 18 years of flood-peak data were used for some stations in the northeastern part of the state.
Annual peak stages and discharges for all crest-gage stations and streamflow-gaging stations used in the study are available by request from the Wisconsin District Office of USGS or from the world-wide-web on the internet via the following URL: http://waterdata.usgs.gov/wi/nwis/peak.
Flood-frequency analyses define the relation of flood-peak magnitude to probability of exceedance or recurrence interval. Probability of exceedance is the percentage chance that a given flood magnitude will be exceeded in any year. Recurrence interval is the reciprocal of percent probability of exceedance divided by 100 and is the average number of years between exceedances. For example, a flood having a probability of exceedance of 1 percent has a recurrence interval of 100 years. Recurrence intervals imply no regularity of exceedance; a 100-year flood might be exceeded in consecutive years or it might not be exceeded in a 100-year period.
Flood-frequency analyses were performed at all rural streamflow-gaging stations with a period of record equal to or exceeding 10 years. Guidelines in Interagency Advisory Committee on Water Data (1982)(commonly referred to as Bulletin 17B) were used to fit logarithms of annual peak discharges to the Pearson Type III distribution. For stations on unregulated streams, the generalized skew from the map in Bulletin 17B was weighted with the station skew to give a weighted skew. Estimates of discharges at several recurrence intervals in the range from 2 to 100 years for each station were computed and are given in Appendix table A-1.
Sites on the main stem of the Wisconsin River received additional analyses. Krug and House (1980) modeled the system of reservoirs and their operation to simulate the flood peaks on the Wisconsin River for water years 1915 through 1976. The flood frequencies given for the Wisconsin River in this study (Appendix table A-2) include the simulated peaks (Krug and House, 1980, Appendix B) and the observed peaks for water years 1977 through 2000. These flood frequencies are considered the most up-to-date estimates of the flood potential of the existing system of reservoirs and their operating policies.
Multiple-regression analysis was used to estimate the relation between flood discharges for given frequencies and drainage-basin characteristics for 200 selected streamflow-gaging stations in Wisconsin. The sites selected, which were the same as those used by Krug and others (1992), were rural, unregulated sites with at least 10 years of record and known basin characteristics. The multiple regression technique is a means of transferring flood-peak characteristics from sites where observed data are available to ungaged locations. The relation is presented by flood-frequency equations.
The regression equations are used to relate the most significant drainage-basin characteristics (independent variables) to flood-peak characteristics (dependent variables; Q2, Q5…, Q100). The multiple-regression model can be expressed in the following form:
 (1)
(1)
where QT is flood magnitude, in cubic feet persecond, having a T-year recurrence interval;
α is regression constant defined by regression analysis;
A, B, C, … M are basin characteristics; and
a, b, c, … m are regression coefficients defined by regression analysis.
This form of the multiple-regression model is achieved by linear regression of the logarithms of the variables.
The principal method of regression analysis used in the study is called generalized least squares (GLS) and was developed by Tasker and others (1986) and Stedinger and Tasker (1985). This method was used because of its theoretical advantages over the ordinary least squares (OLS) method and the conventional weighted least squares (WLS) method.
In the OLS method, all the estimates of T-year floods are implicitly assumed to have equal variance; that is, the T-year flood estimate at each streamflow-gaging station is assumed to be as accurate as the T-year flood estimates at all other stations used in the regression, regardless of record length and site variability. Furthermore, in the OLS method, the concurrent flood peaks at different sites are assumed to be uncorrelated or independently distributed. In general, these two conditions are not met by flood-peak records. The accuracy of the T-year flood estimates varies with the length of record and variability of the annual peak discharges at each site. Many concurrent annual floods in an area are cross-correlated because the stations in the area are subject to similar weather systems.
In the GLS method, the variable accuracy of the T-year flood estimates and the cross-correlation between stations are considered. With this method, information is provided for analyzing the network of streamflow-gaging stations and crest gages. This network analysis capability may prove to be useful in future studies.
The drainage-basin characteristics determined by the multiple-regression analyses to be significant were drainage area, main-channel slope, storage, forest cover, 25-year precipitation index, mean annual snowfall, and soil permeability. The characteristics used in the regression equations are listed in Appendix table A-2 at the back of this report for each station. They are defined as follows:
1. Drainage area (A), in square miles, is the area contributing directly to surface runoff. This area can be planimetered from topographic maps or can be taken directly for some sites from the report on drainage ares in Wisconsin by Henrich and Daniel (1983). If the drainage area is taken from the report by Henrich and Daniel, any area not contributing directly to surface runoff should be subtracted from the total drainage area.
2. Main-channel slope (S), in feet per mile, is the slope of the stream between points that are 10 percent and 85 percent of the distance along the channel from the streamflow-gaging station to the basin divide, determined from topographic maps.
3. Storage (ST), expressed as a percentage of the drainage area, includes lakes, ponds, and wetlands determined from USGS maps and Soil Conservation Service data. A constant of 1 percent is added to storage to obtain ST (to avoid zero values in the regression equations).
4. Forest cover (FOR) is expressed as a percentage of the drainage area shown on USGS maps, determined by the grid method, or is data from the Soil Conservation Service. A constant of 1 percent is added to forest cover to obtain FOR (to avoid zero values in the regression equations).
5. The 25-year precipitation index (I25) is computed by subtracting 4.2 from the 25-year, 24-hour rainfall, expressed in inches (Huff and Angel, 1992). The maximum 25-year, 24-hour rainfall has a recurrence interval of 25 years. Precipitation indices were computed for recurrence intervals of 2-, 10-, 25-, 50- and 100-years. The 25-year recurrence interval subsequently proved to be the best precipitation index for predicting the selected recurrence-interval flood discharges. The 25-year, 24-hour rainfall amounts for the 9 climatic sections in Wisconsin (Huff and Angel, 1992) are shown in figure 1. Values of I25 were determined at each streamflow-gaging station.
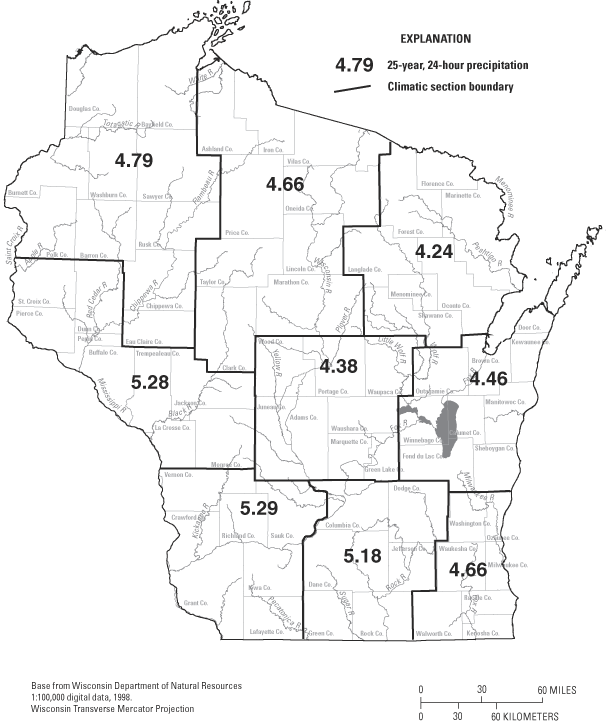
6. Mean annual snowfall (SN) for 1961 through 1990, in inches, is determined from climate data processed by the Spatial Climate Analysis Service at Oregon State University (Daly and others, 2000) and is shown in figure 2. SN is interpolated from the contours for the location of the streamflow-gaging station.
7. Soil permeability (SP), in inches per hour, is based on the least-permeable soil horizon in the soil column. The median rate is used for each range of soil permeability. Ranges of soil permeability were obtained from a soils table published by the U.S. Department of Agriculture, Soil Conservation Service (1964) and overlaid on a soils map of Wisconsin (Hole and others, 1968). The weighted-average soil permeability (SP) is shown on plate 2. A grid is printed on the back of plate 2 to facilitate estimating the percent of the basin in each soil-permeability range.
Plate 2. Map of Wisconsin showing soil permeability (2,094 Kb PDF).
The state was divided into five flood-frequency areas by Conger (1981). Several boundaries between areas were adjusted in north-central Wisconsin on the basis of physical characteristics (Krug and others, 1992) and residuals from the regression equations when applied to particular sites (fig. 3 and pl. 1).
Figure 3. Flood-frequency areas in Wisconsin.
The five-area arrangement of the state is useful in reducing the errors in the regression equations. Different basin characteristics are significant in estimating the flood frequency in the various areas. For example, soil permeability is not a significant variable in flood-frequency equations for the southern part of the state (areas 1 and 5), but it is significant in the central and northern parts of the state (areas 2, 3 and 4). Note that the driftless area is contained almost entirely in area 1 (plate 1 and fig. 3).
For this study, a combination of OLS and GLS regressions was used to determine the best-fit regression equations for each flood-frequency area (fig. 3). A stepwise OLS procedure was used as a screening tool to determine the suite of variables that best predicted the T-year flood for each area. The stepwise procedure selects a subset of variables from a group of candidate basin characteristics (as described in the previous section) beginning with the variable that explains the most variability in the dependent variable, and continues with each successive variable that explains the most remaining variability given the effects of the variables already chosen. A variable was selected when its coefficient was determined to be significantly different from zero at the 5-percent level (significance level less than 0.05).
To facilitate comparison of various regressions, the standard error of estimate was used (a measure of the error in the use of regression equations to predict T-year floods at sites used in the regression analysis). Because the regression equations were computed using a logarithmic transformation of the dependent and independent variables, the standard error in log space was used to determine confidence intervals for predictions of the logarithm of a particular T-year discharge. The true value of the log of the T-year flood will be within plus or minus one standard error of the regression estimate at about two-thirds of the sites. Because of the nonlinear nature of the logarithmic transformation, the resulting confidence intervals transformed to actual discharges are not symmetrical. For comparison purposes, an "equivalent" standard error as a percent of predicted discharge was computed as follows:
 (2)
(2)
where
ESE is the equivalent standard error in percent of predicted discharge, and
SE is the standard error of the logarithm ofdischarge.
Note that the ESE essentially results in a confidence interval that has the same width as the true confidence interval for two-thirds of the predicted values; however, the upper and lower bounds computed with the ESE will not be correct because of the asymmetry of the confidence intervals.
For most areas, the stepwise procedure results in a slightly different set of independent variables for each of the T-year floods (2-, 5-, 10-, 25-, 50- and 100-year). To maintain consistency, a common set of variables was chosen to predict each of the T-year floods in a particular area; in general, the set of variables explaining the most variability of the higher recurrence interval floods (50- and 100-year) was chosen. This set of variables was then used to estimate the regressions using the GLS procedure. Selecting a set of variables that deviates from the stepwise results will produce a somewhat diminished accuracy of prediction for the regression. To illustrate the differences in model accuracy, the estimated standard errors in log space (approximated by the model error) and an equivalent standard error of estimate in percent were determined for three separate regressions: (1) the best set of variables using OLS stepwise estimation, (2) a common set of variables using OLS regression; and (3) a common set of variables using GLS regression (table 1). For the most part, the increase in standard error for the common set of variables is relatively small, and in some cases is compensated for by the improvements afforded by the GLS procedure.
[SE, standard error of estimate in log units; ESE, equivalent standard error of estimate in percent; Best, results using stepwise OLS regression; Common, results using OLS and a common set of independent variables; Qn, the n-year recurrence interval flood. Flood frequency areas are shown in figure 3.]
| Flooddischarge | OLS SE | GLS SE | OLS ESE | GLS ESE | ||
|---|---|---|---|---|---|---|
| Best | Common | Common | Best | Common | Common | |
| Area 1 | ||||||
| Q2 | 0.1867 | 0.1867 | 0.1803 | 44 | 44 | 43 |
| Q5 | .1692 | .1787 | .1709 | 40 | 42 | 40 |
| Q10 | .1591 | .1746 | .1631 | 37 | 41 | 38 |
| Q25 | .1852 | .1852 | .1691 | 44 | 44 | 40 |
| Q50 | .1690 | .1963 | .1764 | 40 | 47 | 42 |
| Q100 | .1777 | .2090 | .1855 | 42 | 50 | 44 |
| Area 2 | ||||||
| Q2 | .1123 | .1182 | .1091 | 26 | 28 | 25 |
| Q5 | .1117 | .1207 | .1086 | 26 | 28 | 25 |
| Q10 | .1157 | .1253 | .1086 | 27 | 29 | 25 |
| Q25 | .1233 | .1327 | .1100 | 29 | 31 | 26 |
| Q50 | .1300 | .1387 | .1118 | 30 | 32 | 26 |
| Q100 | .1380 | .1458 | .1153 | 32 | 34 | 27 |
| Area 3 | ||||||
| Q2 | .1569 | .1626 | .1591 | 37 | 38 | 37 |
| Q5 | .1489 | .1518 | .1470 | 35 | 36 | 34 |
| Q10 | .1495 | .1515 | .1449 | 35 | 36 | 34 |
| Q25 | .1522 | .1525 | .1439 | 36 | 36 | 34 |
| Q50 | .1547 | .1547 | .1446 | 36 | 36 | 34 |
| Q100 | .1580 | .1581 | .1466 | 37 | 37 | 34 |
| Area 4 | ||||||
| Q2 | .1305 | .1305 | .1233 | 31 | 31 | 29 |
| Q5 | .1177 | .1238 | .1131 | 27 | 29 | 26 |
| Q10 | .1153 | .1213 | .1063 | 27 | 28 | 25 |
| Q25 | .1197 | .1197 | .0995 | 28 | 28 | 23 |
| Q50 | .1203 | .1203 | .0964 | 28 | 28 | 22 |
| Q100 | .1226 | .1226 | .0954 | 29 | 29 | 22 |
| Area 5 | ||||||
| Q2 | .1069 | .1248 | .1179 | 25 | 29 | 27 |
| Q5 | .1113 | .1214 | .1127 | 26 | 28 | 26 |
| Q10 | .1306 | .1306 | .1196 | 31 | 31 | 28 |
| Q25 | .1494 | .1494 | .1349 | 35 | 35 | 32 |
| Q50 | .1655 | .1655 | .1490 | 39 | 39 | 35 |
| Q100 | .1821 | .1821 | .1637 | 43 | 43 | 39 |
The flood-frequency equations developed for streams in Wisconsin, along with the standard error of estimate in log space and equivalent standard error of estimate in percent are presented in table 2. The equivalent standard error of estimate is shown for comparison with similar data published in previous reports (Conger, 1971 and 1981; Krug and others, 1992); however, it is computed differently in this study and the comparison is not exact. The standard error of estimate for the regression equations for the 100-year flood in the Conger (1971) report ranged from 37 to 41 percent. The comparable range of standard error of prediction was 35 to 40 percent in the Conger (1981) report. The range of standard error of prediction for the 100-year flood was 22 to 33 percent in the Krug and others (1992) report. The range of standard error of prediction for the 100-year flood in table 3 is 22 to 44 percent.
Table 2. Flood-frequency equations for streams in Wisconsin
[A, contributing drainage area in square miles; S, main-channel slope in feet per mile; I25, 25-year, 24-hour precipitation intensity, in inches minus 4.2; ST, storage, in percent of basin area plus 1.0; SP, soil permeability of the least-permeable soil horizon in inches per hour; SN, mean annual snowfall for 1961 through 1990 in inches; FOR, forest cover in percent of basin area plus 1; Qn, peak flood discharge in cubic feet per second, with an n-year recurrence interval; SE, standard error of estimate of regression, in log units; ESE, equivalent standard error of estimate, in percent. Flood frequency areas are shown in figure 3.]
| Best-fit equation | SE | ESE | Eq. no. | ||||||
|---|---|---|---|---|---|---|---|---|---|
| Area 1 (39 stations) | |||||||||
| Q2 | = | 99.9 A0.652 | FOR-0.254 | I257.52 | 0.1803 | 43 | 1-1 | ||
| Q5 | = | 190.0 A0.634 | FOR-0.260 | I258.45 | .1709 | 40 | 1-2 | ||
| Q10 | = | 35.0 A0.857 | S0.463 | FOR-0.302 | I256.92 | .1631 | 38 | 1-3 | |
| Q25 | = | 38.1 A0.876 | S 0.518 | FOR -0.308 | I257.16 | .1691 | 40 | 1-4 | |
| Q50 | = | 41.4 A0.884 | S0.545 | FOR -0.310 | I257.36 | .1764 | 42 | 1-5 | |
| Q100 | = | 44.2 A0.893 | S0.571 | FOR -0.312 | I257.56 | .1855 | 44 | 1-6 | |
| Area 2 (36 stations) | |||||||||
| Q2 | = | 13.0 A0.884 | SP-0.630 | S0.382 | .1091 | 25 | 2-1 | ||
| Q5 | = | 15.4 A0.900 | SP-0.682 | S0.486 | .1086 | 25 | 2-2 | ||
| Q10 | = | 16.3 A0.910 | SP-0.710 | S0.541 | .1086 | 25 | 2-3 | ||
| Q25 | = | 17.3 A0.922 | SP-0.740 | S0.600 | .1100 | 26 | 2-4 | ||
| Q50 | = | 17.9 A0.929 | SP-0.758 | S0.636 | .1118 | 26 | 2-5 | ||
| Q100 | = | 18.3 A0.936 | SP-0.775 | S0.669 | .1153 | 27 | 2-6 | ||
| Area 3 (57 stations) | |||||||||
| Q2 | = | 36.5 A0.832 | SP-0.614 | ST-0.143 | I250.124 | .1591 | 37 | 3-1 | |
| Q5 | = | 61.6 A0.827 | SP-0.683 | ST-0.169 | I250.133 | .1470 | 34 | 3-2 | |
| Q10 | = | 80.6 A0.825 | SP-0.713 | ST-0.186 | I250.135 | .1449 | 34 | 3-3 | |
| Q25 | = | 107.0 A0.821 | SP-0.743 | ST-0.204 | I250.136 | .1439 | 34 | 3-4 | |
| Q50 | = | 127.0 A0.819 | SP-0.761 | ST-0.215 | I250.136 | .1446 | 34 | 3-5 | |
| Q100 | = | 149.0 A0.818 | SP-0.775 | ST-0.227 | I250.136 | .1466 | 34 | 3-6 | |
| Area 4 (40 stations) | |||||||||
| Q2 | = | 2.69 A0.864 | ST-0.296 | S0.279 | SP-0.250 | SN0.490 | .1233 | 29 | 4-1 |
| Q5 | = | 6.76 A0.858 | ST-0.286 | S0.303 | SP-0.259 | SN0.370 | .1131 | 26 | 4-2 |
| Q10 | = | 9.74 A0.856 | ST-0.286 | S0.321 | SP-0.255 | SN0.332 | .1063 | 25 | 4-3 |
| Q25 | = | 13.7 A0.856 | ST-0.290 | S0.342 | SP-0.246 | SN0.299 | .0995 | 23 | 4-4 |
| Q50 | = | 16.6 A0.857 | ST-0.293 | S0.357 | SP-0.238 | SN0.281 | .0964 | 22 | 4-5 |
| Q100 | = | 19.4 A0.857 | ST-0.296 | S0.371 | SP-0.229 | SN0.269 | .0954 | 22 | 4-6 |
| Area 5 (28 stations) | |||||||||
| Q2 | = | 9.58 A0.981 | ST-0.293 | S0.416 | .1179 | 27 | 5-1 | ||
| Q5 | = | 15.1 A0.912 | ST-0.358 | S0.438 | .1127 | 26 | 5-2 | ||
| Q10 | = | 18.9 A0.913 | ST-0.385 | S0.447 | .1196 | 28 | 5-3 | ||
| Q25 | = | 23.6 A0.915 | ST-0.408 | S0.457 | .1349 | 32 | 5-4 | ||
| Q50 | = | 27.0 A0.916 | ST-0.420 | S0.463 | .1490 | 35 | 5-5 | ||
| Q100 | = | 30.6 A0.916 | ST-0.430 | S0.467 | .1637 | 39 | 5-6 | ||
The biggest discrepancy between the equivalent standard errors in the previous report and this report occur for the most part in areas 1 and 5 (fig. 3), which constitute a large portion of the driftless area. Recent evidence indicates that floods in the driftless area of the state have been decreasing over time (Gebert and Krug, 1996). The issue of stationarity in the record is beyond the scope of this study; however, it is a likely topic to be considered in the next revision of the regression equations.
The regression equations are valid for streams without significant regulation. For the purposed of this report, a dam on a stream or river does not constitute regulation unless the dam is used to control the flow during a flood.
The regression equations and the associated accuracy are considered valid only within the area for which they were developed and only for basin-characteristic values that are within the range used to calculate the regression equations. Flood estimates can be made using basin characteristics outside the range of values from which the equations were derived, but it is not possible to estimate the error in those values. The ranges of the basin characteristics of the streamflow-gaging stations used in the regression analysis are summarized in table 3.
Table 3. Ranges of basin characteristics used in regression analysis
[mi2, square miles; ft/mi, feet per mile; in., inches; in/hr, inches per hour. Flood-frequency areas are shown in figure 3.]
| Basin characteristic | Minimum | Median | Maximum |
|---|---|---|---|
| Area 1 (39 stations) | |||
| Drainage area (mi2) | 0.28 | 25.0 | 2,120 |
| Main-channel slope (ft/mi) | 2.27 | 27.3 | 270 |
| Forested area (percent) | .00 | 26.6 | 56.9 |
| 25-year, 24-hour precipitation (in.) | 5.18 | 5.28 | 5.29 |
| Area 2 (36 stations) | |||
| Drainage area (mi2) | .56 | 27.4 | 1,760 |
| Soil permeability (in/hr) | .20 | .91 | 2.88 |
| Main-channel slope (ft/mi) | 3.65 | 15.56 | 96 |
| Area 3 (57 stations) | |||
| Drainage area (mi2) | 1.00 | 22 | 2,240 |
| Soil permeability (in/hr) | .12 | 1.81 | 8.46 |
| Storage (percent) | .00 | 15.5 | 39.7 |
| 25-year, 24-hour precipitation (in.) | 4.24 | 4.38 | 5.29 |
| Area 4 (40 stations) | |||
| Drainage area (mi2) | .66 | 35.0 | 696 |
| Storage (percent) | .00 | 9.40 | 52.4 |
| Main-channel slope (ft/mi) | 1.08 | 11.6 | 204 |
| Soil permeability (in/hr) | .12 | .82 | 4.68 |
| Mean annual snowfall (in.) | 34.4 | 48.3 | 172 |
| Area 5 (28 stations) | |||
| Drainage area (mi2) | 1.32 | 18.9 | 3,340 |
| Storage (percent) | .00 | 1.65 | 15.4 |
| Main-channel slope (ft/mi) | .74 | 12.85 | 74.2 |
The estimation techniques in this report can be applied to four types of rural sites. The first case is where the site is at a streamflow-gaging station; for this case, a weighted estimate is calculated based on the gaging record and the appropriate regression equation. The second case is where the site is near a streamflow-gaging station; for this case, the discharge from the appropriate regression equation is adjusted using information from the station. The third case is where there is no streamflow-gaging station on the stream; for this case, the appropriate regression equation is applied directly. The fourth case is where the site is on a regulated stream; for this case, the discharge is estimated based on drainage area and the appropriate relation for the particular regulated stream (figs. 4-7). A detailed description for applying each technique is given in the examples that follow. To estimate flood frequencies for urban streams, the reader is referred to Conger (1986).
Flood-frequency characteristics of sites at streamflow-gaging stations can be estimated from the station streamflow record and by the regression equations. The two methods can be considered independent when a large number of sites were used to develop the regression equations. This is because the influence of a given station on determining the regression equations is roughly inversely proportional to the number of stations used to determine the equations. When independent flood-frequency estimates are available, the Interagency Committee Advisory Committee on Water Data (1982, Appendix 8) recommends that the weighted average of the estimates be used as the best estimate of the flow frequency. If the estimates are weighted in inverse proportion to their variances, the variance of the weighted average will be less than the variance of either of the independent estimates. Flood-frequency characteristics estimated from flood-peak data are listed in Appendix table A-1.
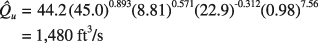
Example 1: Determine the 100-year flood discharge for the Jump River at Sheldon (station number 05362000).
1. Locate the data in Appendix table A-1 by station number (05362000).
2. The 100-year flood discharge for Jump River is Q100 = 25,000 ft3/s.
The flood- frequency estimates presented in this report were based on the common logarithms of discharge. Therefore the weighting should be done with the logarithms of the flood-frequency estimates, and the best estimate is the antilogarithm of the weighted average. The flood-frequency estimates in Appendix tables A-1 and A-2 are essentially independent and, therefore, could be combined by this procedure to get an improved estimate at each site.
The appropriate equation (Interagency Committee Advisory Committee on Water Data, 1982) is
 (3)
(3)
where
x and y are two independent estimates of aflood-frequency characteristic,
Vx and Vy are their respective variances, and
z is the weighted estimate of the flood-frequency characteristic.
In the example of the Jump River at Sheldon,
x= log (25,000)= 4.398 from table A-1
Vx= (0.0435)2= 0.00189 from table A-1
y= log(41,100)= 4.614 from table A-2
Vy= (0.1153)2= 0.0133 from table 2, eq. 2-6.
 (4)
(4)
 (5)
(5)
 (6)
(6)
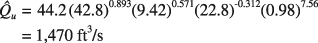
Flood-frequency characteristics at sites near a streamflow-gaging station on the same stream are determined using a combination of the station's flood frequency characteristics and the characteristics determined by the regression equations. The procedure is applicable for sites that have a drainage area between 50 and 150 percent of the drainage area of the station. The suitability of the flood-frequency characteristics should be determined by comparing them with flood-frequency characteristics at the station. The following procedure was used by Curtis (1987) for streams in Illinois based on work by Sauer (1974). The procedure is as follows:
First, the ratio r′ is defined by
 (7)
(7)
where
r′ is the adjustment ratio,
Qg is a flood-frequency characteristic determined at the station,
 is a flood-frequency characteristic determined for the station by the appropriate multiple-regressionequation (table 2),
Ag is drainage area of the gaged site, and
Au is drainage area of the ungaged site.
The adjusted flood-frequency characteristic for the ungaged site (Qu) is computed by the equation
 (8)
(8)
where
 is a flood-frequency characteristic determined for the ungaged site by theappropriate multiple-regression equation.
If the difference in drainage area between the ungaged site and the gaged site is more than 50 percent, equations 7 and 8 should not be used. In this case, the appropriate multiple-regression equation from table 2 should be used without adjustment but should be compared to the flood-frequency characteristic of the station on the stream for suitability. If the drainage area crosses the boundary of two flood-frequency areas, compute the flood frequency using equations from both areas. Compute the final flood-frequency estimates as the weighted average of the two estimates weighted by the proportion of drainage area in each of the flood-frequency areas.
Example 2: Determine the 100-year flood of Black Earth Creek at U.S. Highway 14, which is 2 miles downstream from the station Black Earth Creek at Black Earth (05406500).
First, equation 1-6 from table 2 is used to determine the 100-year flood estimate at the gaged site:
 (1-6)
(1-6)
The drainage-basin characteristics at the gaged site are given in Appendix table A-2:
A (contributing drainage area) = 42.8 mi2,
S (main channel slope) = 9.42 ft/mi,
FOR (forest cover in percent of basin area plus 1) = 21.8 + 1 = 22.8, and
I25 (25-year, 24-hour precipitation index) = 5.18 – 4.2 = 0.98 inches.
Substituting into equation 1-6,
 (9)
(9)
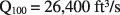
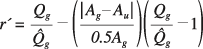
at the Black Earth Creek at U.S. Highway 14 can be determined at the ungaged site by use of the same eq. 1-6 and the procedure that was used to determine at the station, as follows:
(1-6, table 2)
The drainage-basin characteristics at this site were determined to be:
A= 45.0 mi2 (2.8 mi2 non-contributing area),
S= 8.81 ft/mi,
FOR= 21.9 + 1 = 22.9, and
I25= 5.18 – 4.2 = 0.98.
Substituting into equation 1-6,
 (10)
(10)
From Appendix table A-2, the 100-year flood at the gaging station (Qg) is 1,650 ft3/s. Next, Equation 7 is used to determine the adjustment factor (r′):
(7)
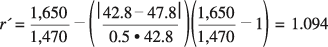 (11)
(11)
Finally, Equation 8 is used to compute the adjusted discharge at the ungaged site, thus
 (12)
(12)
If the drainage area crosses the boundary of two flood-frequency areas, compute the flood frequency using equations from both areas. Compute the final flood-frequency estimates as the weighted average of the two estimates weighted by the proportion of drainage area in each of the flood-frequency areas.
Flood-frequency characteristics at sites on ungaged streams are calculated using equations 1-1 through 5-6 from table 2.
Example 3: Determine the 100-year discharge for Tappen Coulee at Blair. This site is in area 1; therefore, use equation 1-6 from table 2:
(1-6)
1. The drainage area A was determined to be 4.48 mi2 from Henrich and Daniel (1983).
2. The main channel slope (S) was computed from U.S. Geological Survey topographic maps as follows:
(a) The river or coulee length was measured from the site to the basin divide. For forked streams, the fork with the larger drainage area is followed.
(b) The elevations at points that are 10 and 85 percent of the total stream length from the site are then determined.
(c) Next, the difference in elevation between the sites is determined and is divided by the distance, in miles, between the points. By use of the appropriate quadrangle maps (Blair, 1968, 1:24,000; Hegg, 1969, 1:24,000), the total length of the stream for this site was determined to be 5.20 mi. The elevation at the 10-percent point is 847.6 ft and at the 85-percent point is 963.0 ft. The main channel slope is
 (13)
(13)
3. The percent forest cover was determined to be 45.8 percent based on land use/land coverage in the WISCLAN database (Reese and others, 2002) and a digitized drainage-basin outline after Henrich and Daniel (1983).
4. The precipitation intensity index (I25) was determined by locating the site in figure 1 and determining the 25-year, 24-hour precipitation intensity, then subtracting 4.2. The 25-year precipitation intensity for climatic section 4 is 5.28; therefore I25 is 1.08.
5. Substituting these values into equation 1-6:
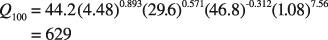 (14)
(14)
If the drainage area crosses the boundary of two flood-frequency areas, compute the flood frequency using equations from both areas. Compute the final flood-frequency estimates as the weighted average of the two estimates weighted by the proportion of drainage area in each of the flood-frequency areas.
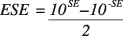
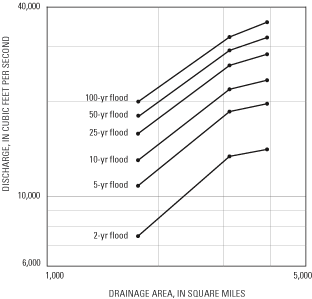
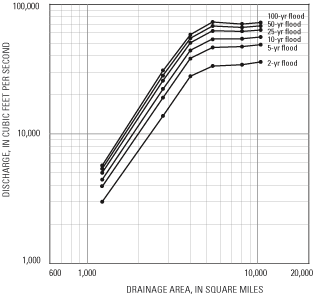
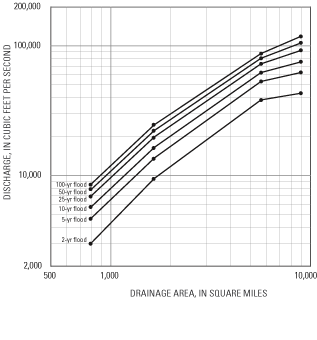
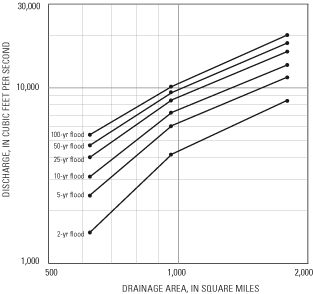
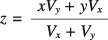
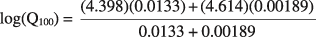
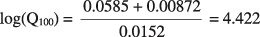
Flood-frequency characteristics at ungaged sites on regulated streams are estimated using the flood-frequency characteristics at streamflow-gaging stations on the regulated streams and adjusting the characteristics according to the relation of drainage area and discharge. Graphs showing the peak discharge of floods plotted at selected recurrence intervals against drainage area are presented in figures 4-7 for the following major regulated streams in Wisconsin:
a. Menominee River between Wisconsin and Michigan (fig. 4),
b. Wisconsin River from the mouth to Rainbow Reservoir near Lake Tomahawk (fig. 5),
c. Chippewa River from the mouth to Lake Chippewa in Sawyer County (fig. 6), and
d. Flambeau River from its mouth to Flambeau Flowage northeast of Park Falls (fig. 7).
Storage reservoirs in these basins can significantly change the flood-frequency characteristics at streamflow-gaging stations. Flood-frequency analyses were performed for stations along the main stems for the period of record beginning with the completion of the last large storage reservoir in each basin for the Menominee, Chippewa, and Flambeau Rivers. These analyses represent flood-frequency characteristics in 2000. Completion dates for the last large storage reservoir for each basin follow: 1941 for the Menominee River; 1926 for the Flambeau River; and 1923 for the Chippewa River. For the Wisconsin River, flood peaks prior to 1976 were simulated using a model of the river system (Krug and House, 1980). Observed flood peaks were used after 1976.
Equations, tables, and graphs presented in this report provide a means for estimating flood-frequency characteristics for rural streams in Wisconsin. Flood-frequency characteristics were determined at 104 crest-stage stations, at 33 discontinued crest-stage stations, at 108 continuous streamflow-gaging stations, and at 67 discontinued streamflow-gaging stations using the log-Pearson Type III frequency distribution. The flood-frequency characteristics at 96 crest-gage stations, 29 discontinued crest-gage stations, 48 streamflow-gaging stations, and 27 discontinued streamflow-gaging stations, and their drainage-basin characteristics, were used in a multiple-regression analysis to derive equations for estimating flood-frequency characteristics. The generalized least-square procedure was used in the multiple-regression analyses. The state was divided into five areas with similar physiographic characteristics.
For the 100-year flood discharge, the standard errors of prediction in three of the five areas were relatively unchanged from those reported in Krug and others (1992). The most notable discrepancies were in areas 1 and 5 (southwestern and south-central Wisconsin) where the standard error of estimate increased from 26 and 22 percent to 44 and 39 percent, respectively, for the 100-year floods. This discrepancy may be due to nonstationarity in the discharge record coupled with the use of relatively recent snowfall and precipitation data. The standard error of estimate for the 100-year flood equation ranged statewide from 22 percent for streams in the eastern area to 44 percent for streams in the southwestern area. Drainage area, channel slope, soil permeability, storage, rainfall intensity, and forest cover are the most significant drainage-basin characteristics for estimating flood-frequency characteristics.
Graphical relations of flood-frequency characteristics and drainage area are presented for the regulated Menominee, Flambeau, Chippewa, and Wisconsin Rivers. The relations were developed by use of data at stations for periods after the last large storage reservoir was constructed in each basin. For the Wisconsin River, the source of simulated flood discharges through 1976 was a report by Krug and House (1980). Observed flood discharges were used after 1976.
Conger, D.H., 1971, Estimating magnitude and frequency of floods in Wisconsin: Madison, Wis., U.S. Geological Survey Open-File Report, 200 p.
___1981, Techniques for estimating magnitude and frequency of floods for Wisconsin streams: U.S. Geological Survey Open-File Report 82–1214, 115 p.
___1986, Estimating magnitude and frequency of floods for Wisconsin urban streams: U.S. Geological Survey Water-Resources Investigations Report 86–4005, 18 p.
Curtis, G.W., 1987, Technique for estimating flood-peak discharges and frequencies on rural streams: U.S. Geological Survey Water-Resources Investigations Report 87–4207, 79 p.
Daly, C., Gibson, W., and Taylor, G., 2000, United States mean monthly and annual snowfall: Spatial Climate Analysis Service, Oregon State University.
Ericson, D.W., 1961, Floods in Wisconsin, magnitude and frequency: Madison, Wis., U.S. Geological Survey Open-File Report, 109 p.
Gebert, W.A., and Krug, W.R., 1996, Streamflow trends in Wisconsin's driftless area: Journal of the American Water Resources Association, v. 32, no. 4, p. 733–744.
Henrich, E.W., and Daniel, D.N., 1983, Drainage area data for Wisconsin streams: U.S. Geological Survey Open-File Report 83–933, 322 p.
Hole, F.D., Beatty, M.T., Lee, G.B., and Klingelhoets, A.J., 1968, Soil map of Wisconsin: Wisconsin Geological and Natural History Survey, scale 1:250,000, 11 sheets.
Huff, F.A., and Angel, J.R., 1992, Rainfall frequency atlas of the midwest: Illinois State Water Survey Bulletin 71.
Interagency Advisory Committee on Water Data, 1982, Guidelines for determining flood flow frequency: Bulletin 17B of the Hydrology Subcommittee, U.S. Geological Survey, Office of Water Data Coordination, Reston, Va.
Krug, W.R., Conger, D.H., and Gebert, W.A., 1992, Flood-frequency characteristics of Wisconsin streams: U.S. Geological Survey Water-Resources Investigations Report 91–4128, 185 p.
Krug, W.R., and House, L.B., l980, Streamflow model of Wisconsin River for estimating flood frequency and volume: U.S. Geological Survey Water-Resources Investigations Open-File Report 80–1103, 44 p.
Patterson, J.L., and Gamble, C.R., 1968, Magnitude and frequency of floods in the United States, part 5, Hudson Bay and Upper Mississippi River basins: U.S. Geological Survey Water-Supply Paper 1678, 546 p.
Reese, H.M., Lillesand, T.M., Nagel, D.E., Stewart, J.S., Goldmann, R.A., Simmons, T.E., Chipman, J.W., and Tessar, P.A., 2002, Statewide land cover derived from multiseasonal Landsat TM data—A retrospective of the WISCLAND project: Remote Sensing of Environment, v. 82, no. 2–3, p. 224–237.
Sauer, V.B., 1974, Flood characteristics of Oklahoma streams: U.S. Geological Survey Water-Resources Investigations 52–73, 301 p.
Stedinger, J.R., and Tasker, G.D., 1985, Regional hydrologic analysis 1—Ordinary, weighted and generalized least squares compared: Water Resources Research, v. 21, no. 9, p. 1421–1432.
Tasker, G.D., Eychaner, J.H., and Stedinger, J.R., 1986, Application of generalized least squares in regional hydrologic regression analysis, in Subitzky, Seymour, ed., Selected papers in the hydrologic sciences 1986: U.S. Geological Survey Water-Supply Paper 2310, p. 107–115.
U.S. Department of Agriculture, Soil Conservation Service, 1964, Engineering test data and interpretations for major soils of Wisconsin: table 11, p. 3–43.
Wiitala, S.W., 1965, Magnitude and frequency of floods in the United States, part 4, St. Lawrence River basin: U.S. Geological Survey Water-Supply Paper 1677, 357 p.
[WRC skew, skewness as defined in Bulletin 17B (Interagency Advisory Committee on Water Data, 1981); recurrence intervals in years; discharge in cubic feet per second; SE100, standard error of 100-year discharge, in log units; C, crest-stage gage; G, continuous-record gage]
| Stationnumber | Station name | WRC skew | Discharge for indicated recurrence interval | Type | Period of record | ||||||
|---|---|---|---|---|---|---|---|---|---|---|---|
| 2 | 5 | 10 | 25 | 50 | 100 | SE100 | |||||
| Unregulated Stations | |||||||||||
| 04024400 | Stoney Brook near Superior, Wis. | -0.457 | 182 | 312 | 402 | 516 | 599 | 681 | 0.07219 | C | 1959–2000 |
| 04024430 | Nemadji River near South Superior, Wis. | -.093 | 5,250 | 7,510 | 9,020 | 10,900 | 12,400 | 13,800 | .06607 | G | 1974–2000 |
| 04025200 | Pearson Creek near Maple, Wis. | .415 | 350 | 609 | 834 | 1,190 | 1,510 | 1,890 | .10020 | C | 1957–2000 |
| 04025500 | Bois Brule River at Brule, Wis. | .071 | 607 | 864 | 1,040 | 1,280 | 1,460 | 1,640 | .04830 | G | 1943–2000 |
| 04026200 | Sand River tributary near Red Cliff, Wis. | .384 | 112 | 198 | 273 | 391 | 498 | 624 | .10347 | C | 1959–2000 |
| 04026300 | Sioux River near Washburn, Wis. | .477 | 467 | 780 | 1,050 | 1,470 | 1,840 | 2,280 | .09817 | C | 1959–2000 |
| 04026400 | Spillerberg Creek near Cayuga, Wis. | -.002 | 77 | 110 | 133 | 163 | 186 | 209 | .07335 | C | 1958–1958 |
| 04026450 | Bad River near Mellen, Wis. | .091 | 915 | 1,340 | 1,650 | 2,050 | 2,370 | 2,700 | .07463 | C | 1971–2000 |
| 04026700 | Trout Brook tributary near Marengo, Wis. | -.186 | 124 | 203 | 260 | 336 | 394 | 455 | .09759 | C | 1960–1981 |
| 04027000 | Bad River near Odanah, Wis. | .317 | 7390 | 10,800 | 13,300 | 16,800 | 19,700 | 22,700 | .05616 | G | 1915–2000 |
| 04027200 | Pearl Creek at Grandview, Wis. | .596 | 179 | 295 | 395 | 555 | 701 | 874 | .10298 | C | 1960–2000 |
| 04027500 | White River near Ashland, Wis. | -.113 | 2,640 | 3,970 | 4,890 | 6,090 | 7,000 | 7,920 | .05505 | G | 1949–2000 |
| 04028000 | Montreal River at Ironwood, Mich. | .239 | 1,080 | 1,650 | 2,090 | 2,700 | 3,200 | 3,750 | .13014 | G | 1918–1962 |
| 04029000 | West Branch Montreal River at Gile, Wis. | -.684 | 924 | 1,200 | 1,350 | 1,500 | 1,600 | 1,690 | .06013 | G | 1918–1947 |
| 04029700 | Boomer Creek near Saxon, Wis. | -.260 | 131 | 213 | 272 | 348 | 405 | 464 | .09667 | C | 1958–1981 |
| 04029990 | Montreal River at Saxon Falls near Saxon, Wis. | -.172 | 3,200 | 4,720 | 5,740 | 7,040 | 8,000 | 8,960 | .05343 | G | 1939–2000 |
| 04059900 | Allen Creek tributary near Alvin, Wis. | .200 | 13 | 20 | 26 | 34 | 40 | 47 | .07502 | C | 1960–2000 |
| 04061000 | Brule River near Florence, Wis. | .149 | 1,447 | 2,052 | 2,479 | 3,044 | 3,485 | 3,942 | .05185 | G | 1944–2000 |
| 04063640 | North Branch Pine River at Windsor Dam near Alvin, Wis. | -.118 | 73 | 95 | 109 | 126 | 139 | 150 | .04758 | C | 1967–2000 |
| 04063688 | South Branch Popple River near Newald, Wis. | -.212 | 49 | 58 | 63 | 69 | 73 | 77 | .03289 | C | 1970–2000 |
| 04063700 | Popple River near Fence, Wis. | .105 | 635 | 904 | 1,090 | 1,340 | 1,530 | 1,730 | .06027 | G | 1964–2000 |
| 04063800 | Woods Creek near Fence, Wis. | .570 | 197 | 277 | 339 | 427 | 501 | 582 | .07562 | C | 1958–2000 |
| 04064500 | Pine River below Pine River Powerplant near Florence, Wis. | -.028 | 2,000 | 2,730 | 3,200 | 3,800 | 4,250 | 4,690 | .04076 | G | 1924–2000 |
| 04064800 | Little Popple River near Aurora, Wis. | -.285 | 355 | 467 | 534 | 612 | 666 | 717 | .05022 | C | 1970–2000 |
| 04066300 | Cole Creek near Dunbar, Wis. | .145 | 21 | 29 | 34 | 41 | 47 | 53 | .07286 | C | 1960–2000 |
| 04066500 | Pike River at Amberg, Wis. | .139 | 1,010 | 1,400 | 1,660 | 2,010 | 2,270 | 2,540 | .04494 | G | 1914–2000 |
| 04066700 | McCall Creek at Wausaukee, Wis. | -.466 | 13 | 27 | 37 | 52 | 63 | 74 | .12759 | C | 1959–1980 |
| 04066800 | Menominee River at Koss, Mich. | -.418 | 13,200 | 18,400 | 21,500 | 25,100 | 27,500 | 29,800 | .03473 | G | 1908–2000 |
| 04067760 | Peshtigo River near Cavour, Wis. | -.143 | 778 | 1,090 | 1,300 | 1,560 | 1,740 | 1,930 | .05755 | C | 1970–2000 |
| 04067800 | Armstrong Creek near Armstrong Creek, Wis. | .488 | 103 | 148 | 182 | 231 | 271 | 315 | .07602 | C | 1958–1992 |
| 04068000 | Peshtigo River at High Falls near Crivitz, Wis. | -.083 | 2,000 | 2,600 | 2,980 | 3,440 | 3,770 | 4,080 | .03818 | G | 1913–1956 |
| 04069500 | Peshtigo River at Peshtigo, Wis. | .013 | 4,300 | 5,680 | 6,580 | 7,690 | 8,510 | 9,330 | .04118 | G | 1954–2000 |
| 04069700 | North Branch Oconto River near Wabeno, Wis. | .226 | 139 | 230 | 303 | 410 | 502 | 604 | .09931 | C | 1970–2000 |
| 04071000 | Oconto River near Gillett, Wis. | -.038 | 2,430 | 3,440 | 4,120 | 4,990 | 5,650 | 6,310 | .03600 | G | 1907–2000 |
| 04071700 | North Branch Little River near Coleman, Wis. | -.538 | 240 | 373 | 457 | 557 | 625 | 690 | .05680 | C | 1958–2000 |
| 04071800 | Pensaukee River near Pulaski, Wis. | -.194 | 802 | 1,200 | 1,460 | 1,800 | 2,050 | 2,300 | .05923 | C | 1961–2000 |
| 04071858 | Pensaukee River near Pensaukee, Wis. | -.359 | 1,600 | 2,710 | 3,490 | 4,510 | 5,270 | 6,030 | .09460 | G | 1973–1996 |
| 04072150 | Duck Creek near Howard, Wis. | -.367 | 1,410 | 2,690 | 3,680 | 5,030 | 61,00 | 7,190 | .16461 | G | 1989–2000 |
| 04073400 | Bird Creek at Wautoma, Wis. | -.008 | 81 | 113 | 135 | 162 | 183 | 204 | .05106 | C | 1959–2000 |
| 04073462 | White Creek at Spring Grove Road near Green Lake, Wis. | .122 | 124 | 243 | 349 | 517 | 669 | 846 | .21313 | G | 1982-2000 |
| 040734644 | Silver Creek at South Koro Road near Ripon, Wis. | .118 | 206 | 310 | 385 | 489 | 571 | 658 | .13481 | G | 1987–1995 |
| 04073468 | Green Lake inlet at County Highway A near Green Lake, Wis. | .193 | 223 | 335 | 418 | 533 | 626 | 725 | .11770 | G | 1987-2000 |
| 04073500 | Fox River at Berlin, Wis. | –.217 | 3,380 | 4,590 | 5,340 | 6,250 | 6,900 | 7,520 | .02769 | G | 1898-2000 |
| 04074300 | Mud Creek near Nashville, Wis. | –.057 | 62 | 77 | 86 | 97 | 104 | 111 | .04241 | C | 1970-2000 |
| 04074700 | Hunting River near Elcho, Wis. | .315 | 80 | 112 | 135 | 167 | 193 | 220 | .06501 | C | 1958–2000 |
| 04074850 | Lily River near Lily, Wis. | -.268 | 81 | 127 | 158 | 198 | 228 | 257 | .07377 | C | 1970–2000 |
| 04074950 | Wolf River at Langlade, Wis. | -.315 | 1,480 | 1,850 | 2,050 | 2,290 | 2,450 | 2,590 | .03439 | G | 1968–2000 |
| 04075200 | Evergreen Creek near Langlade, Wis. | .282 | 43 | 55 | 62 | 72 | 80 | 87 | .04365 | G | 1959–1997 |
| 04075500 | Wolf River above West Branch Wolf River near Keshena, Wis. | .319 | 1,740 | 2,120 | 2,360 | 2,670 | 2,890 | 3,120 | .03784 | G | 1928–1962 |
| 04077400 | Wolf River near Shawano, Wis. | .263 | 2,500 | 3,190 | 3,650 | 4,240 | 4,680 | 5,130 | .02900 | G | 1908–2000 |
| 0407809265 | Middle Branch Embarrass River near Wittenberg, Wis. | -.027 | 456 | 640 | 764 | 922 | 1,040 | 1,160 | .10083 | G | 1990–2000 |
| 04078500 | Embarrass River near Embarrass, Wis. | -.038 | 2,320 | 3,440 | 4,230 | 5,250 | 6,030 | 6,830 | .04512 | G | 1920–2000 |
| 04079000 | Wolf River at New London, Wis. | -.285 | 6,690 | 9,370 | 11,100 | 13,100 | 14,500 | 15,900 | .03470 | G | 1896–2000 |
| 04079700 | Spaulding Creek near Big Falls, Wis. | -.107 | 55 | 71 | 80 | 92 | 100 | 108 | .03693 | C | 1959–2000 |
| 04080000 | Little Wolf River at Royalton, Wis. | -.522 | 3,200 | 4,850 | 5,880 | 7,100 | 7,930 | 8,710 | .04555 | G | 1914–1984 |
| 04081000 | Waupaca River near Waupaca, Wis. | -.518 | 1060 | 1,540 | 1,840 | 2,180 | 2,410 | 2,620 | .04226 | G | 1917–1985 |
| 04081010 | Waupaca River tributary near Waupaca, Wis. | -.489 | 41 | 69 | 88 | 112 | 129 | 145 | .09376 | C | 1959–1981 |
| 04081900 | Sawyer Creek at Oshkosh, Wis. | -.234 | 554 | 1,030 | 1,400 | 1,920 | 2,330 | 2,770 | .09267 | C | 1961–2000 |
| 04083000 | West Branch Fond du Lac River at Fond du Lac, Wis. | -.698 | 762 | 1,140 | 1,360 | 1,610 | 1,770 | 1,910 | .08279 | G | 1939–1954 |
| 04083400 | East Branch Fond du Lac River tributary near Eden, Wis. | -.392 | 58 | 96 | 122 | 155 | 179 | 203 | .09570 | C | 1961–1963 |
| 04083500 | East Branch Fond du Lac River at Fond du Lac, Wis. | -.708 | 910 | 1,540 | 1,950 | 2,420 | 2,740 | 3,030 | .10851 | G | 1939–1954 |
| 04084445 | Fox River at Appleton, Wis. | -.316 | 12,600 | 15,100 | 16,500 | 18,000 | 19,000 | 19,900 | .04130 | G | 1986–2000 |
| 04085030 | Apple Creek near Kaukauna, Wis. | -.721 | 828 | 1,260 | 1,510 | 1,790 | 1,980 | 2,140 | .05885 | C | 1960–2000 |
| 04085100 | East River tributary at Greenleaf, Wis. | -.162 | 216 | 379 | 504 | 678 | 818 | 965 | .11004 | C | 1958–1980 |
| 040851385 | Fox River at Oil Tank Depot at Green Bay, Wis. | .220 | 15,000 | 19,700 | 22,900 | 27,100 | 30,200 | 33,400 | .08689 | G | 1989–2000 |
| 04085200 | Kewaunee River near Kewaunee, Wis. | -.221 | 2,650 | 4,450 | 5,760 | 7,510 | 8,860 | 10,300 | .07333 | G | 1958–2000 |
| 04085281 | East Twin River at Mishicot, Wis. | -.130 | 1,170 | 1,990 | 2,620 | 3,480 | 4,160 | 4,880 | .10540 | G | 1973–1996 |
| 04085300 | Neshota River tributary near Denmark, Wis. | -.101 | 191 | 342 | 460 | 629 | 767 | 915 | .09511 | C | 1959–2000 |
| 04085400 | Killsnake River near Chilton, Wis. | -.667 | 612 | 1,040 | 1,320 | 1,650 | 1,880 | 2,080 | .07025 | C | 1961–2000 |
| 04085427 | Manitowoc River at Manitowoc, Wis. | -.072 | 2220 | 3,670 | 4,760 | 6,250 | 7,440 | 8,700 | .09349 | G | 1973–2000 |
| 04085700 | Sheboygan River tributary near Plymouth, Wis. | -.012 | 113 | 182 | 233 | 303 | 360 | 419 | .10278 | C | 1959–1980 |
| 040857005 | Otter Creek at Willow Road near Plymouth, Wis. | -.559 | 137 | 243 | 315 | 405 | 470 | 532 | .15115 | G | 1991–2000 |
| 04086000 | Sheboygan River at Sheboygan, Wis. | -.551 | 3,140 | 4,990 | 6,170 | 7,580 | 8,560 | 9,480 | .05163 | G | 1917–2000 |
| 04086150 | Milwaukee River at Kewaskum, Wis. | -.049 | 901 | 1,450 | 1,850 | 2,410 | 2,840 | 3,300 | .12381 | G | 1968–1981 |
| 04086200 | East Branch Milwaukee River at New Fane, Wis. | -.137 | 214 | 353 | 455 | 593 | 702 | 815 | .13115 | G | 1969–1981 |
| 04086340 | North Branch Milwaukee River near Fillmore, Wis. | -.266 | 789 | 1,380 | 1,820 | 2,420 | 2,880 | 3,360 | .14051 | G | 1969–1981 |
| 04086360 | Milwaukee River at Waubeka, Wis. | -.317 | 2,020 | 3,380 | 4,340 | 5,590 | 6,540 | 7,490 | .11815 | G | 1968–1994 |
| 04086400 | Milwaukee River tributary near Fredonia, Wis. | -.576 | 55 | 105 | 140 | 185 | 218 | 251 | .12300 | C | 1962–1980 |
| 04086500 | Cedar Creek near Cedarburg, Wis. | -.136 | 918 | 1,750 | 2,420 | 3,400 | 4,220 | 5,110 | .07696 | G | 1931–2000 |
| 04086600 | Milwaukee River near Cedarburg, Wis. | -.217 | 2,940 | 3,980 | 4,630 | 5,410 | 5,960 | 6,490 | .06379 | G | 1982–2000 |
| 04087000 | Milwaukee River at Milwaukee, Wis. | .044 | 4,730 | 7,090 | 8,780 | 11,000 | 12,800 | 14,700 | .04427 | G | 1915–2000 |
| 04087030 | Menomonee River at Menomonee Falls, Wis. | .073 | 590 | 888 | 1,100 | 1,390 | 1,620 | 1,860 | .08530 | G | 1975–2000 |
| 04087050 | Little Menomonee River near Freistadt, Wis. | -.373 | 168 | 253 | 309 | 376 | 424 | 471 | .05998 | C | 1958–1993 |
| 04087088 | Underwood Creek at Wauwatosa, Wis. | .156 | 952 | 2,020 | 3,020 | 4,700 | 6,280 | 8,190 | .15610 | G | 1975–2000 |
| 04087100 | Honey Creek at Milwaukee, Wis. | .048 | 388 | 637 | 828 | 1,100 | 1,320 | 1,550 | .07748 | C | 1959-2000 |
| 04087120 | Menomonee River at Wauwatosa, Wis. | .086 | 3,680 | 6,240 | 8,260 | 11,200 | 13,600 | 16,300 | .08698 | G | 1962–2000 |
| 04087159 | Kinnickinnic River at S. 11th St. at Milwaukee, Wis. | -.059 | 3,840 | 5,380 | 6,410 | 7,700 | 8,670 | 9,640 | .07739 | G | 1982–2000 |
| 04087200 | Oak Creek near South Milwaukee, Wis. | -.241 | 316 | 550 | 725 | 962 | 1,150 | 1,340 | .07723 | C | 1958–2000 |
| 04087204 | Oak Creek at South Milwaukee, Wis. | .157 | 607 | 811 | 948 | 1,130 | 1,260 | 1,400 | .05081 | G | 1964–2000 |
| 04087220 | Root River near Franklin, Wis. | .261 | 999 | 1710 | 2,310 | 3,210 | 3,990 | 4,880 | .09745 | G | 1960–2000 |
| 04087230 | West Branch Root River Canal tributary near North Cape, Wis. | -.713 | 96 | 140 | 165 | 192 | 209 | 225 | .05445 | C | 1962–1993 |
| 04087233 | Root River Canal near Franklin, Wis. | -.362 | 767 | 1,020 | 1,170 | 1,350 | 1,460 | 1,570 | .04115 | G | 1964–2000 |
| 04087240 | Root River at Racine, Wis. | -.090 | 1,900 | 2,660 | 3,150 | 3,770 | 4,230 | 4,690 | .05264 | G | 1964–2000 |
| 04087250 | Pike Creek near Kenosha, Wis. | -.528 | 92 | 149 | 186 | 230 | 261 | 291 | .06323 | C | 1960–2000 |
| 04087257 | Pike River near Racine, Wis. | -.436 | 944 | 1,200 | 1,340 | 1,500 | 1,600 | 1,690 | .03787 | G | 1972–2000 |
| 05332000 | Namekagon River at Trego, Wis. | .121 | 1,050 | 1,330 | 1,510 | 1,740 | 1,900 | 2,060 | .06880 | G | 1915–1927 |
| 05332500 | Namekagon River near Trego, Wis. | .927 | 1,250 | 1,810 | 2,270 | 2,990 | 3,620 | 4,360 | .07686 | G | 1928–2000 |
| 05333100 | Little Frog Creek near Minong, Wis. | -.324 | 200 | 357 | 473 | 628 | 747 | 870 | .09064 | C | 1961–2000 |
| 05334100 | Sawyer Creek near Shell Lake, Wis. | -.144 | 44 | 68 | 84 | 105 | 121 | 138 | .08758 | C | 1960–1980 |
| 05335380 | Bashaw Brook near Shell Lake, Wis. | .155 | 98 | 174 | 236 | 331 | 413 | 505 | .10232 | C | 1959–1993 |
| 05339500 | St. Croix River near Rush City, Minn. | -.426 | 19,500 | 30,800 | 38,300 | 47,500 | 54,100 | 60,400 | .06335 | G | 1923–1961 |
| 05340300 | Trade River near Fredric, Wis. | .447 | 121 | 220 | 309 | 455 | 592 | 757 | .11123 | C | 1958–2000 |
| 05341500 | Apple River near Somerset, Wis. | -.299 | 1,180 | 1,650 | 1,930 | 2,280 | 2,520 | 2,760 | .03314 | G | 1905–2000 |
| 05341700 | Willow River tributary near New Richmond, Wis. | -.776 | 59 | 109 | 142 | 181 | 208 | 233 | .10752 | C | 1959–1980 |
| 05341900 | Kinnickinnic River tributary at River Falls, Wis. | -.381 | 789 | 2,060 | 3,250 | 5,140 | 6,800 | 8,660 | .13070 | C | 1959–2000 |
| 05344500 | Mississippi River at Prescott, Wis. | -.190 | 62,200 | 95,600 | 119,000 | 14,8000 | 171,000 | 193,000 | .04694 | G | 1929–2000 |
| 05346600 | Little Trimbelle Creek near Bay City, Wis. | .034 | 650 | 1,260 | 1,790 | 2,610 | 3,330 | 4,150 | .14984 | C | 1961–1980 |
| 05356200 | Kenyon Creek near Radisson, Wis. | -.340 | 167 | 254 | 312 | 383 | 434 | 484 | .08118 | C | 1960–1980 |
| 05357360 | Bear River near Powell, Wis. | -.233 | 414 | 591 | 706 | 846 | 948 | 1,050 | .05852 | C | 1970–2000 |
| 05357390 | Weber Creek near Mercer, Wis. | -.011 | 90 | 145 | 186 | 242 | 287 | 334 | .09569 | C | 1970–2000 |
| 05358100 | Smith Creek near Park Falls, Wis. | -.217 | 166 | 229 | 269 | 318 | 352 | 386 | .06055 | C | 1970–2000 |
| 05359200 | South Fork Flambeau River tributary near Park Falls, Wis. | -.399 | 30 | 56 | 76 | 103 | 124 | 145 | .12375 | C | 1960–1980 |
| 05359500 | South Fork Flambeau River near Phillips, Wis. | -.378 | 4,290 | 5,880 | 6,850 | 7,980 | 8,750 | 9,480 | .04089 | G | 1930–1975 |
| 05359600 | PRICE Creek near Phillips, Wis. | .456 | 145 | 212 | 264 | 339 | 402 | 470 | .07159 | C | 1958–2000 |
| 05360200 | Flambeau River tributary at Ladysmith, Wis. | –.023 | 17 | 27 | 34 | 43 | 51 | 59 | .09680 | C | 1960–1980 |
| 05361400 | Hay Creek near Prentice, Wis. | -.357 | 483 | 764 | 953 | 1,190 | 1,360 | 1,530 | .06369 | C | 1961–2000 |
| 05361420 | Douglas Creek near Prentice, Wis. | .125 | 545 | 798 | 980 | 1,220 | 1,420 | 1,620 | .07195 | C | 1970–2000 |
| 05361500 | South Fork Jump River near Ogema, Wis. | -.008 | 4,740 | 6,390 | 7,470 | 8,820 | 9,820 | 10,800 | .08911 | G | 1944–1954 |
| 05361600 | North Fork Jump River near Phillips, Wis. | -.532 | 132 | 196 | 236 | 282 | 313 | 342 | .06865 | C | 1970–2000 |
| 05362000 | Jump River at Sheldon, Wis. | -.051 | 8,130 | 12,300 | 15,200 | 19,000 | 22,000 | 25,000 | .04348 | G | 1916–2000 |
| 05364000 | Yellow River at Cadott, Wis. | .270 | 4,590 | 7,140 | 9,120 | 12,000 | 14,300 | 16,900 | .06554 | C | 1943–2000 |
| 05364100 | Seth Creek near Cadott, Wis. | –.344 | 247 | 410 | 524 | 670 | 780 | 889 | .07158 | C | 1962–2000 |
| 05364500 | Duncan Creek at Bloomer, Wis. | .057 | 879 | 1,820 | 2,680 | 4,050 | 5,310 | 6,780 | .10483 | C | 1945–2000 |
| 05365000 | Duncan Creek at Chippewa Falls, Wis. | -.176 | 1,940 | 2,770 | 3,310 | 3,990 | 4,480 | 4,970 | .09169 | G | 1934–1954 |
| 05365700 | Goggle-Eye Creek near Thorp, Wis. | .151 | 437 | 896 | 1,320 | 2,020 | 2,660 | 3,430 | .12687 | C | 1958–2000 |
| 05365707 | North Fork Eau Claire River near Thorp, Wis. | -.014 | 1,960 | 3,670 | 5,100 | 7,230 | 9,050 | 11,100 | .16058 | G | 1986–2000 |
| 05366000 | Eau Claire River near Augusta, Wis. | -.189 | 5,750 | 7,110 | 7,910 | 8,830 | 9,460 | 10,100 | .05710 | G | 1915–1926 |
| 05366500 | Eau Claire River near Fall Creek, Wis. | -.277 | 8,180 | 13,500 | 17,300 | 22,200 | 26,000 | 29,800 | .06094 | C | 1943–2000 |
| 05367030 | Willow Creek near Eau Claire, Wis. | .002 | 138 | 205 | 252 | 314 | 362 | 412 | .05979 | C | 1958–2000 |
| 05367480 | East Branch Pine Creek tributary near Dallas, Wis. | .161 | 137 | 226 | 296 | 398 | 484 | 578 | .09158 | C | 1960–2000 |
| 05367500 | Red Cedar River near Colfax, Wis. | .400 | 5,800 | 8,740 | 11,000 | 14,300 | 17,100 | 20,200 | .05985 | C | 1914–1990 |
| 05367700 | Lightning Creek at Almena, Wis. | -.416 | 471 | 781 | 993 | 1,260 | 1,460 | 1,650 | .06759 | C | 1958–2000 |
| 05368000 | Hay River at Wheeler, Wis. | -.109 | 3,340 | 5,630 | 7,350 | 9,720 | 11,600 | 13,600 | .07039 | G | 1934–2000 |
| 05369000 | Red Cedar River at Menomonie, Wis. | -.031 | 8,920 | 13,400 | 16,500 | 20,600 | 23,800 | 27,000 | .04271 | G | 1908–2000 |
| 05369800 | Eau Galle River tributary near Hersey, Wis. | .210 | 76 | 151 | 219 | 330 | 433 | 555 | .16192 | C | 1960–1980 |
| 05369945 | Eau Galle River at low-water bridge at Spring Valley, Wis. | -.254 | 2,600 | 4,210 | 5,350 | 6,830 | 7,950 | 9,080 | .12645 | G | 1982–1995 |
| 05370000 | Eau Galle River at Spring Valley, Wis. | -.608 | 1,390 | 2,290 | 2,870 | 3,550 | 4,030 | 4,470 | .07449 | G | 1942–2000 |
| 05370500 | Eau Galle River at Elmwood, Wis. | .140 | 3,760 | 7,670 | 11,300 | 17,100 | 22,500 | 28,900 | .21708 | G | 1942–1953 |
| 05370600 | Arkansaw Creek tributary near Arkansaw, Wis. | -.141 | 181 | 272 | 335 | 416 | 477 | 538 | .06516 | C | 1959–1993 |
| 05370900 | Spring Creek near Durand, Wis. | -.304 | 171 | 311 | 416 | 560 | 673 | 789 | .08562 | C | 1962–2000 |
| 05371300 | By Golly Creek near Nelson, Wis. | -.311 | 10 | 36 | 68 | 129 | 193 | 273 | .27526 | C | 1962–1980 |
| 05371800 | Buffalo River tributary near Osseo, Wis. | -.234 | 67 | 101 | 124 | 153 | 175 | 196 | .05853 | C | 1960–2000 |
| 05371920 | Buffalo River near Mondovi, Wis. | .063 | 1,450 | 2,490 | 3,300 | 4,490 | 5,480 | 6,560 | .10734 | C | 1974–2000 |
| 05372000 | Buffalo River near Tell, Wis. | -.252 | 2,910 | 5,190 | 6,890 | 9,220 | 11,100 | 13,000 | .12334 | G | 1933–1950 |
| 05378200 | Eagle Creek near Fountain City, Wis. | .342 | 891 | 1,530 | 2,080 | 2,920 | 3,670 | 4,530 | .11289 | C | 1961–2000 |
| 05378500 | Mississippi River at Winona, Minn. | -.197 | 89,400 | 128,000 | 153,000 | 184,000 | 207,000 | 229,000 | .03003 | G | 1879–2000 |
| 05379400 | Trempealeau River at Arcadia, Wis. | -.138 | 4,240 | 7,580 | 10,200 | 13,800 | 16,800 | 20,000 | .17306 | G | 1968–2000 |
| 05379500 | Trempealeau River at Dodge, Wis. | -.162 | 3,920 | 6,610 | 8,610 | 11,300 | 13,500 | 15,700 | .05763 | G | 1914–2000 |
| 05380800 | Black River tributary near Whittlesey, Wis. | -.233 | 114 | 168 | 203 | 248 | 281 | 313 | .06181 | C | 1960–2000 |
| 05380900 | Poplar River near Owen, Wis. | -.037 | 4,610 | 7,140 | 8,960 | 11,400 | 13,300 | 15,300 | .06617 | C | 1958–2000 |
| 05380970 | Cawley Creek near Neillsville, Wis. | -.189 | 2,020 | 3,740 | 5,090 | 7,010 | 8,570 | 10,200 | .09001 | C | 1961–2000 |
| 05381000 | Black River at Neillsville, Wis. | -.271 | 12,900 | 19,800 | 24,500 | 30,300 | 34,700 | 39,000 | .04130 | G | 1905–2000 |
| 05382000 | Black River near Galesville, Wis. | -.169 | 20,800 | 32,000 | 39,600 | 49,600 | 57,100 | 64,700 | .04836 | G | 1932–2000 |
| 05382200 | French Creek near Ettrick, Wis. | -.297 | 818 | 1,460 | 1,940 | 2,590 | 3,100 | 3,620 | .10613 | C | 1960–2000 |
| 05382300 | Beaver Creek tributary near Sparta, Wis. | .040 | 127 | 178 | 213 | 258 | 292 | 327 | .07281 | C | 1959–1980 |
| 05382500 | Little La Crosse River near Leon, Wis. | –.237 | 999 | 1,700 | 2,210 | 2,890 | 3,420 | 3,960 | .07038 | C | 1934–1981 |
| 05383000 | La Crosse River near West Salem, Wis. | -.117 | 2,470 | 3,820 | 4,770 | 6,030 | 6,990 | 7,980 | .05457 | G | 1914–1978 |
| 05386300 | Mormon Creek near La Crosse, Wis. | -.292 | 788 | 2,020 | 3,190 | 5,090 | 6,800 | 8,760 | .14656 | C | 1961–2000 |
| 05386500 | Coon Creek at Coon Valley, Wis. | -.183 | 2,180 | 3,900 | 5,230 | 7,070 | 8,560 | 10,100 | .17065 | G | 1934–1981 |
| 05387100 | North Fork Bad Axe River near Genoa, Wis. | -.132 | 851 | 2,090 | 3,290 | 5,300 | 7,170 | 9,380 | .13241 | C | 1959–2000 |
| 05388460 | Du Charme Creek at Eastman, Wis. | .018 | 70 | 131 | 183 | 261 | 329 | 405 | .13863 | C | 1961–1981 |
| 05389500 | Mississippi River at McGregor, Ia. | -.133 | 109,500 | 148,300 | 172,900 | 203,100 | 224,900 | 246,200 | .03576 | G | 1880–2000 |
| 05390140 | Muskrat Creek at Conover, Wis. | -.131 | 62 | 85 | 99 | 117 | 130 | 143 | .06163 | C | 1970–2000 |
| 05390240 | Fourmile Creek near Three Lakes, Wis. | -.105 | 80 | 98 | 108 | 120 | 128 | 136 | .03814 | C | 1970–2000 |
| 05391260 | Gudegast Creek near Starks, Wis. | .175 | 68 | 88 | 101 | 117 | 130 | 143 | .05001 | C | 1970–2000 |
| 05391950 | Squaw Creek near Harrison, Wis. | -.108 | 25 | 36 | 42 | 51 | 58 | 64 | .05962 | C | 1970–2000 |
| 05392150 | Mishonagon Creek near Woodruff, Wis. | -.326 | 68 | 85 | 94 | 105 | 112 | 119 | .02959 | C | 1958–2000 |
| 05392350 | Bearskin Creek near Harshaw, Wis. | .394 | 76 | 100 | 117 | 139 | 156 | 174 | .05049 | C | 1959–2000 |
| 05393500 | Spirit River at Spirit Falls, Wis. | -.549 | 1,630 | 2,400 | 2,860 | 3,390 | 3,750 | 4,080 | .04202 | G | 1942–2000 |
| 05393620 | Skanawan Creek near Tomahawk, Wis. | .263 | 75 | 123 | 160 | 216 | 263 | 316 | .16362 | C | 1970–1981 |
| 05393640 | Little Pine Creek near Irma, Wis. | .014 | 126 | 178 | 214 | 259 | 294 | 328 | .06279 | C | 1970–2000 |
| 05394000 | New Wood River near Merrill, Wis. | -.031 | 1,230 | 1,960 | 2,490 | 3,230 | 3,810 | 4,410 | .08813 | C | 1953–1980 |
| 05394200 | Devil Creek near Merrill, Wis. | .452 | 290 | 442 | 563 | 741 | 893 | 1,060 | .08165 | C | 1960–2000 |
| 05394500 | Prairie River near Merrill, Wis. | -.062 | 1,410 | 2,120 | 2,610 | 3,250 | 3,750 | 4,250 | .04415 | G | 1914–2000 |
| 05395020 | Lloyd Creek near Doering, Wis. | -.170 | 296 | 449 | 554 | 689 | 790 | 892 | .06970 | C | 1970–2000 |
| 05395100 | Trappe River tributary near Merrill, Wis. | -.181 | 133 | 233 | 308 | 413 | 497 | 585 | .08058 | C | 1959–2000 |
| 05396000 | Rib River at Rib Falls, Wis. | -.480 | 6,950 | 11,800 | 15,200 | 19,400 | 22,400 | 25,400 | .08037 | G | 1925–1957 |
| 05396100 | Pet Brook near Edgar, Wis. | -.009 | 717 | 1170 | 1,520 | 1,990 | 2,380 | 2,780 | .08734 | C | 1962–2000 |
| 05396300 | Wisconsin River tributary at Wausau, Wis. | -.068 | 243 | 427 | 572 | 777 | 946 | 1130 | .13267 | C | 1983–2000 |
| 05397500 | Eau Claire River at Kelly, Wis. | -.215 | 3,180 | 4,740 | 5,780 | 7,100 | 8,070 | 9,030 | .04256 | G | 1914–2000 |
| 05397600 | Big Sandy Creek near Wausau, Wis. | .219 | 496 | 804 | 1,050 | 1,400 | 1,700 | 2,030 | .08156 | C | 1959–2000 |
| 05399000 | Big Eau Pleine River near Colby, Wis. | -.132 | 2,640 | 4,530 | 5,970 | 7,950 | 9,530 | 11,200 | .14161 | G | 1942–1954 |
| 05399200 | Marsh Creek tributary near Abbotsford, Wis. | -.313 | 124 | 223 | 296 | 395 | 471 | 550 | .11085 | C | 1959–1980 |
| 05399500 | Big Eau Pleine River near Stratford, Wis. | -.192 | 7,890 | 13,200 | 17,100 | 22,300 | 26,400 | 30,600 | .05463 | G | 1914–2000 |
| 05400025 | Johnson Creek near Knowlton, Wis. | .369 | 892 | 1,360 | 1,720 | 2,240 | 2,680 | 3,170 | .09500 | C | 1973–2000 |
| 05400500 | Plover River near Stevens Point, Wis. | .052 | 738 | 1,040 | 1,250 | 1,520 | 1,720 | 1,930 | .09319 | G | 1914–1951 |
| 05400600 | Little Plover River near Arnott, Wis. | -.473 | 41 | 61 | 73 | 88 | 98 | 108 | .08562 | G | 1960–1975 |
| 05400650 | Little Plover River at Plover, Wis. | -.462 | 48 | 69 | 83 | 99 | 109 | 120 | .06093 | G | 1960–1987 |
| 05401050 | Tenmile Creek near Nekoosa, Wis. | -.268 | 191 | 261 | 304 | 356 | 392 | 427 | .05763 | G | 1964–2000 |
| 05401100 | Fourteenmile Creek near New Rome, Wis. | .101 | 231 | 308 | 358 | 423 | 471 | 519 | .06962 | G | 1961–1979 |
| 05401535 | Big Roche A Cri Creek near Adams, Wis. | .205 | 167 | 251 | 313 | 398 | 468 | 542 | .11350 | G | 1964–1978 |
| 05401800 | Yellow River tributary near Pittsville, Wis. | -.346 | 388 | 551 | 653 | 774 | 860 | 941 | .04770 | C | 1959–2000 |
| 05402000 | Yellow River at Babcock, Wis. | -.654 | 4,850 | 7,100 | 8,410 | 9,870 | 10,800 | 11,700 | .04208 | G | 1944–2000 |
| 05402500 | Yellow River at Sprague, Wis. | -.521 | 3,520 | 5,430 | 6,630 | 8,060 | 9,050 | 9,980 | .09808 | G | 1927–1940 |
| 05403000 | Yellow River at Necedah, Wis. | -.646 | 5,990 | 9,150 | 11,100 | 13,200 | 14,700 | 16,000 | .08511 | G | 1941–1957 |
| 05403500 | Lemonweir River at New Lisbon, Wis. | -.695 | 2,860 | 4,290 | 5,130 | 6,070 | 6,680 | 7,220 | .05027 | G | 1944–1994 |
| 05403520 | Webster Creek at New Lisbon, Wis. | -.710 | 196 | 328 | 410 | 506 | 571 | 630 | .07333 | C | 1961–2000 |
| 05403550 | Onemile Creek near Mauston, Wis. | -.214 | 550 | 1,080 | 1,510 | 2,130 | 2,650 | 3,210 | .10311 | C | 1958–2000 |
| 05403610 | Wisconsin River tributary at Wisconsin Dells, Wis. | -.501 | 10 | 20 | 27 | 37 | 45 | 53 | .13681 | C | 1962–1980 |
| 05403630 | Hulbert Creek near Wisconsin Dells, Wis. | .269 | 97 | 162 | 216 | 297 | 366 | 445 | .12340 | C | 1972–2000 |
| 05403700 | Dell Creek near Lake Delton, Wis. | .205 | 286 | 512 | 703 | 995 | 1,250 | 1,550 | .09854 | C | 1958–2000 |
| 05404116 | South Branch Baraboo River at Hillsboro, Wis. | -.345 | 915 | 1,950 | 2,800 | 4,050 | 5,070 | 6,170 | .18487 | G | 1988–2000 |
| 05404200 | Narrows Creek at Loganville, Wis. | -.566 | 1,730 | 3,130 | 4,110 | 5,340 | 6,230 | 7,090 | .08325 | C | 1958–2000 |
| 05405000 | Baraboo River near Baraboo, Wis. | -.401 | 2,940 | 4,480 | 5,480 | 6,700 | 7,570 | 8,400 | .04486 | G | 1914–2000 |
| 05405600 | Rowan Creek at Poynette, Wis. | -.059 | 265 | 558 | 820 | 1,230 | 1,600 | 2,020 | .11453 | C | 1961–2000 |
| 05406470 | Brewery Creek at Cross Plains, Wis. | -.209 | 118 | 206 | 273 | 363 | 435 | 510 | .14838 | G | 1985–2000 |
| 05406491 | Garfoot Creek near Cross Plains, Wis. | .102 | 87 | 122 | 146 | 179 | 203 | 229 | .10722 | G | 1985–1998 |
| 05406500 | Black Earth Creek at Black Earth, Wis. | -.239 | 443 | 735 | 945 | 1,220 | 1,440 | 1,650 | .06723 | G | 1954–2000 |
| 05406800 | Rocky Branch near Richland Center, Wis. | -.022 | 107 | 243 | 374 | 589 | 790 | 1,030 | .13916 | C | 1960–2000 |
| 05407100 | Richland Creek near Plugtown, Wis. | -.003 | 687 | 1,410 | 2,050 | 3,060 | 3,970 | 5,010 | .11895 | C | 1958–2000 |
| 05407200 | Crooked Creek near Boscobel, Wis. | .055 | 399 | 768 | 1,090 | 1,580 | 2,010 | 2,500 | .10273 | C | 1959–2000 |
| 05407400 | Morris Creek tributary near Norwalk, Wis. | -.580 | 377 | 690 | 909 | 1,190 | 1,380 | 1,580 | .11341 | C | 1959–1980 |
| 05408000 | Kickapoo River at La Farge, Wis. | .196 | 2,510 | 4,250 | 5,650 | 7,740 | 9,520 | 11,500 | .07215 | G | 1939–2000 |
| 05408500 | Knapp Creek near Bloomingdale, Wis. | -.122 | 537 | 1,100 | 1,580 | 2,320 | 2,950 | 3,660 | .17523 | G | 1954–1969 |
| 05408800 | Bishops Branch near Viroqua, Wis. | -.354 | 1,060 | 2,630 | 4,070 | 6,320 | 8,270 | 10,400 | .24061 | C | 1959–1969 |
| 05409830 | North Fork Nederlo Creek near Gays Mills, Wis. | .136 | 60 | 129 | 193 | 301 | 403 | 525 | .23001 | G | 1968–1979 |
| 05409890 | Nederlo Creek near Gays Mills, Wis. | .122 | 324 | 1,060 | 2,000 | 3,990 | 6,270 | 9,460 | .34378 | G | 1968–1980 |
| 05410000 | Kickapoo River at Gays Mills, Wis. | -.121 | 3,060 | 5,160 | 6,740 | 8,910 | 10,600 | 12,500 | .08414 | G | 1913–1977 |
| 05410490 | Kickapoo River at Steuben, Wis. | .218 | 2,730 | 4,870 | 6,670 | 9,440 | 11,900 | 14,700 | .07703 | G | 1982–2000 |
| 05413400 | Piegon Creek near Lancaster, Wis. | .111 | 406 | 838 | 1,240 | 1,880 | 2,480 | 3,180 | .11778 | C | 1960–2000 |
| 05413449 | Kickapoo Creek near North Andover, Wis. | .074 | 900 | 2,150 | 3,420 | 5,620 | 7,780 | 10,400 | .28172 | G | 1987–1996 |
| 05413500 | Grant River at Burton, Wis. | -.395 | 5,520 | 11,000 | 15,200 | 21,100 | 25,800 | 30,600 | .07369 | G | 1935–2000 |
| 05414000 | Platte River near Rockville, Wis. | -.209 | 3,730 | 7,440 | 10,500 | 15,000 | 18,700 | 22,800 | .07883 | G | 1935–2000 |
| 05414200 | Bear Branch near Platteville, Wis. | -.489 | 387 | 663 | 852 | 1,090 | 1,260 | 1,430 | .07644 | C | 1958–2000 |
| 05414213 | Little Platte River near Platteville, Wis. | -.184 | 1,950 | 3,540 | 4,770 | 6,490 | 7,890 | 9,370 | .15923 | C | 1988–2000 |
| 05414900 | Pats Creek near Elk Grove, Wis. | .422 | 481 | 1,150 | 1,890 | 3,320 | 4,850 | 6,910 | .16637 | C | 1960–2000 |
| 05415000 | Galena River at Buncombe, Wis. | .137 | 4,310 | 7,390 | 9,880 | 13,500 | 16,700 | 20,100 | .07721 | G | 1937–1992 |
| 05415500 | East Fork Galena River at Council Hill, Illi. | .051 | 1,980 | 4,180 | 6,190 | 9,450 | 12,400 | 16,000 | .13815 | G | 1940–1969 |
| 05423000 | West Branch Rock River near Waupun, Wis. | -.626 | 323 | 670 | 931 | 1,270 | 1,530 | 1,770 | .10544 | G | 1949–1981 |
| 05423300 | South Branch Rock River tributary near Waupun, Wis. | -.506 | 163 | 377 | 556 | 811 | 1,020 | 1,230 | .15136 | C | 1959–1980 |
| 05423500 | South Branch Rock River at Waupun, Wis. | -.496 | 447 | 778 | 1,010 | 1,300 | 1,510 | 1,710 | .08080 | G | 1949–2000 |
| 05423800 | East Branch Rock River tributary near Slinger, Wis. | -.085 | 164 | 222 | 260 | 307 | 341 | 374 | .05026 | C | 1960–1993 |
| 05424000 | East Branch Rock River near Mayville, Wis. | -.249 | 1,060 | 1,990 | 2,720 | 3,740 | 4,570 | 5,440 | .11921 | G | 1950–2000 |
| 05424300 | Rock River tributary near Watertown, Wis. | -.699 | 108 | 190 | 244 | 308 | 351 | 392 | .09865 | C | 1959–1980 |
| 05425500 | Rock River at Watertown, Wis. | -.253 | 2,110 | 3,110 | 3,770 | 4,580 | 5,180 | 5,770 | .04439 | G | 1932–2000 |
| 05425700 | Robbins Creek near Columbus, Wis. | -.753 | 151 | 253 | 316 | 389 | 437 | 480 | .07576 | C | 1960–2000 |
| 05425827 | Dup-Maunesha River near Sun Prairie, Wis. | -.258 | 448 | 661 | 802 | 976 | 1,100 | 1,230 | .08569 | C | 1973–2000 |
| 05426000 | Crawfish River at Milford, Wis. | -.476 | 2,280 | 3,290 | 3,910 | 4,630 | 5,120 | 5,580 | .03772 | G | 1931–2000 |
| 05426031 | Rock River at Jefferson, Wis. | .077 | 4,620 | 6,440 | 7,680 | 9,280 | 10,500 | 11,800 | .08277 | G | 1978–1994 |
| 05426100 | Scuppernong Creek near Wales, Wis. | .080 | 97 | 126 | 145 | 169 | 187 | 204 | .06193 | C | 1962–1980 |
| 05426250 | Bark River near Rome, Wis. | -.297 | 290 | 364 | 408 | 456 | 490 | 521 | .04965 | G | 1984–2000 |
| 05426500 | Whitewater Creek near Whitewater, Wis. | -.249 | 14 | 22 | 28 | 36 | 41 | 47 | .24343 | G | 1926–1954 |
| 05427000 | Whitewater Creek at Willis Ray Road near Whitewater, Wis. | -.062 | 185 | 306 | 398 | 524 | 625 | 732 | .13602 | G | 1927–1981 |
| 05427200 | Allen Creek near Fort Atkinson, Wis. | -.108 | 101 | 161 | 204 | 262 | 306 | 353 | .07360 | C | 1958–1993 |
| 05427570 | Rock River at Indianford, Wis. | -.110 | 5,650 | 7,600 | 8,850 | 10,400 | 11,500 | 12,500 | .05515 | G | 1976–2000 |
| 05427718 | Yahara River at Windsor, Wis. | .199 | 405 | 667 | 874 | 1,180 | 1,430 | 1,720 | .13485 | G | 1976–2000 |
| 05427800 | Token Creek near Madison, Wis. | -.351 | 232 | 406 | 532 | 698 | 825 | 954 | .08741 | C | 1961–2000 |
| 05427948 | Pheasant Branch at Middleton, Wis. | -.546 | 324 | 564 | 727 | 930 | 1,080 | 1,220 | .09161 | G | 1975–2000 |
| 05427965 | Spring Harbor Storm Sewer at Madison, Wis. | -.470 | 397 | 567 | 670 | 789 | 871 | 947 | .06103 | G | 1976–2000 |
| 05429500 | Yahara River near McFarland, Wis. | .068 | 416 | 536 | 614 | 710 | 780 | 849 | .03143 | G | 1930–2000 |
| 05430100 | Badfish Creek near Stoughton, Wis. | -.494 | 461 | 675 | 806 | 958 | 1,060 | 1,160 | .10237 | G | 1957–1966 |
| 05430150 | Badfish Creek near Cooksville, Wis. | -.455 | 616 | 783 | 876 | 980 | 1,050 | 1,110 | .05724 | G | 1978–2000 |
| 05430175 | Yahara River near Fulton, Wis. | .502 | 1,560 | 2,190 | 2,670 | 3,350 | 3,910 | 4,510 | .08950 | G | 1978–2000 |
| 05430403 | Fisher Creek tributary at Janesville, Wis. | -.103 | 425 | 607 | 728 | 882 | 996 | 1,110 | .08026 | C | 1982–2000 |
| 05430500 | Rock River at Afton, Wis. | -.374 | 6,350 | 8,730 | 10,200 | 11,900 | 13,000 | 14,100 | .03043 | G | 1914–2000 |
| 05431014 | Jackson Creek at Petrie Road near Elkhorn, Wis. | -.134 | 177 | 287 | 367 | 473 | 557 | 643 | .13122 | G | 1984–1995 |
| 054310157 | Jackson Creek tributary near Elkhorn, Wis. | -.636 | 126 | 167 | 189 | 212 | 228 | 241 | .05609 | G | 1984–2000 |
| 05431017 | Delavan Lake inlet at State Hwy. 50 at Lake Lawn, Wis. | -.213 | 340 | 545 | 689 | 878 | 1,020 | 1,170 | .10833 | G | 1984–2000 |
| 05431400 | Little Turtle Creek at Allens Grove, Wis. | .048 | 1,330 | 2,233 | 2,936 | 3,939 | 4,769 | 5,667 | .08519 | C | 1961–2000 |
| 05431486 | Turtle Creek at Carvers Rock Road near Clinton, Wis. | -.123 | 1,810 | 3,400 | 4,690 | 6,560 | 8,120 | 9,820 | .07659 | G | 1938–2000 |
| 05431500 | Turtle Creek near Clinton, Wis. | -.328 | 2,074 | 3,903 | 5,306 | 7,235 | 8,756 | 10,330 | .08868 | G | 1940–1981 |
| 05432300 | Rock Branch near Mineral Point, Wis. | .363 | 277 | 574 | 865 | 1,370 | 1,870 | 2,490 | .13182 | C | 1959–2000 |
| 05432500 | Pecatonica River at Darlington, Wis. | .077 | 3,100 | 6,220 | 9,020 | 13,400 | 17,500 | 22,100 | .09161 | G | 1937–2000 |
| 05433000 | East Branch Pecatonica River near Blanchardville, Wis. | -.077 | 2,170 | 4,090 | 5,680 | 8,010 | 9,980 | 12,100 | .08030 | G | 1940–2000 |
| 05433500 | Yellowstone River near Blanchardville, Wis. | -.642 | 1,430 | 3,210 | 4,620 | 6,510 | 7,950 | 9,370 | .10016 | C | 1955–2000 |
| 05434200 | Skinner Creek tributary near Monroe, Wis. | -.463 | 42 | 75 | 98 | 129 | 151 | 173 | .10576 | C | 1959–1980 |
| 05434500 | Pecatonica River at Martintown, Wis. | -.219 | 5,260 | 8,600 | 11,000 | 14,100 | 16,500 | 19,000 | .05719 | G | 1916–2000 |
| 05435900 | Sugar River tributary near Pine Bluff, Wis. | -.056 | 153 | 287 | 398 | 561 | 699 | 851 | .10646 | C | 1961–2000 |
| 05436000 | Mount Vernnon Creek near Mount Vernon, Wis. | -.135 | 280 | 504 | 679 | 926 | 1,130 | 1,340 | .13829 | G | 1955–1980 |
| 05436200 | Gill Creek near Brooklyn, Wis. | .344 | 106 | 187 | 258 | 369 | 469 | 585 | .10446 | C | 1960–2000 |
| 05436500 | Sugar River near Brodhead, Wis. | -.177 | 3,340 | 5,990 | 8,030 | 10,900 | 13,200 | 15,600 | .05817 | G | 1914–2000 |
| 05437200 | East Fork Raccoon Creek tributary near Beloit, Wis. | .052 | 139 | 320 | 498 | 801 | 1,090 | 1,440 | .14133 | C | 1958–1993 |
| 05543830 | Fox River at Waukesha, Wis. | -.103 | 923 | 1,320 | 1,590 | 1,920 | 2,170 | 2,420 | .05540 | G | 1960–2000 |
| 05544200 | Mukwonago River at Mukwonago, Wis. | -.501 | 214 | 254 | 274 | 296 | 310 | 322 | .02865 | G | 1974–2000 |
| 05544300 | Mukwonago River tributary near Mukwonago, Wis. | -.553 | 30 | 50 | 64 | 80 | 92 | 103 | .09608 | C | 1960–1981 |
| 05545100 | Sugar Creek at Elkhorn, Wis. | .166 | 127 | 215 | 286 | 391 | 481 | 580 | .09021 | C | 1962–2000 |
| 05545200 | White River tributary near Burlington, Wis. | -.062 | 95 | 158 | 205 | 270 | 323 | 378 | .07519 | C | 1958–2000 |
| 05545300 | White River near Burlington, Wis. | -.198 | 808 | 1,300 | 1,650 | 2,110 | 2,470 | 2,830 | .08984 | C | 1959–1982 |
| 05545750 | Fox River near New Munster, Wis. | .543 | 2,660 | 4,310 | 5,710 | 7,880 | 9,830 | 12,100 | .07927 | G | 1940–2000 |
| 05548150 | North Branch Nippersink Creek near Genoa City, Wis. | -.056 | 185 | 284 | 355 | 450 | 523 | 599 | .06716 | C | 1962–2000 |
| Regulated Stations | |||||||||||
| 04062011 | Brule River near Commonwealth, Wis. | .180 | 3,153 | 4,889 | 6,203 | 8,050 | 9,561 | 11,190 | .14200 | G | 1990–2000 |
| 04063000 | Menominee River near Florence, Wis. | -.132 | 7,473 | 10,800 | 13,010 | 15,820 | 17,900 | 19,980 | .03813 | G | 1915–2000 |
| 04066000 | Menominee River near Pembine, Wis. | -.126 | 13,400 | 18,600 | 21,900 | 26,100 | 29,100 | 32,100 | .05457 | G | 1950–1982 |
| 04067000 | Menominee River near Koss, MI | -.453 | 13,420 | 18,560 | 21,620 | 25,140 | 27,520 | 29,730 | .03456 | G | 1908–1981 |
| 04067500 | Menominee River near Mc Allister, Wis. | .070 | 14,100 | 19,700 | 23,400 | 28,300 | 32,000 | 35,800 | .04829 | G | 1945–2000 |
| 04084500 | Fox River at Rapide Croche Dam near Wrightstown, Wis. | -.819 | 12,800 | 16,800 | 18,800 | 20,900 | 22,100 | 23,200 | .02402 | G | 1918–2000 |
| 05333500 | St. Croix River near Danbury, Wis. | -.130 | 4,700 | 6,400 | 7,490 | 8,830 | 9,800 | 10,700 | .03180 | G | 1914–2000 |
| 05336000 | St. Croix River near Grantsburg, Wis. | -.121 | 10,300 | 14,400 | 17,100 | 20,400 | 22,900 | 25,300 | .04641 | G | 1923–1970 |
| 05340500 | St. Croix River at St. Croix Falls, Wis. | -.509 | 22,300 | 32,800 | 39,200 | 46,700 | 51,800 | 56,500 | .03364 | G | 1902–2000 |
| 05356000 | Chippewa River at Bishops Bridge near Winter, Wis. | -.565 | 2,980 | 4,640 | 5,680 | 6,900 | 7,740 | 8,520 | .04317 | G | 1912–2000 |
| 05356500 | Chippewa River near Bruce, Wis. | -.237 | 9,510 | 13,700 | 16,500 | 19,900 | 22,300 | 24,700 | .03888 | G | 1914–2000 |
| 05357500 | Flambeau River at Flambeau Flowage, Wis. | -.200 | 1,490 | 2,430 | 3,100 | 4,000 | 4,690 | 5,390 | .07766 | G | 1928–1960 |
| 05358000 | Flambeau River near Butternut, Wis. | .184 | 1,410 | 2,380 | 3,160 | 4,310 | 5,300 | 6,390 | .16259 | G | 1915–1938 |
| 05358500 | Flambeau River at Babbs Island, Wis. | -.576 | 4,190 | 6,100 | 7,250 | 8,550 | 9,420 | 10,200 | .04650 | G | 1930–1975 |
| 05360000 | Flambeau River near Ladysmith, Wis. | .080 | 8,490 | 11,500 | 13,500 | 16,100 | 18,000 | 20,000 | .03628 | G | 1903–1961 |
| 05360500 | Flambeau River near Bruce, Wis. | -.305 | 10,500 | 14,120 | 16,310 | 18,880 | 20,660 | 22,360 | .03734 | G | 1952–2000 |
| 05365500 | Chippewa River at Chippewa Falls, Wis. | -.357 | 38,400 | 53,200 | 62,300 | 72,900 | 80,300 | 87,400 | .03411 | G | 1884–2000 |
| 05367000 | Chippewa River at Eau Claire, Wis. | .874 | 38,200 | 52,200 | 63,300 | 79,600 | 93,600 | 109,000 | .14336 | G | 1903–1954 |
| 05369500 | Chippewa River at Durand, Wis. | .002 | 43,300 | 62,500 | 75,600 | 92,800 | 106,000 | 119,000 | .04285 | G | 1880–2000 |
| 05391000 | Wisconsin River at Rainbow Lake near Lake Tomahawk, Wis. | -.636 | 1,870 | 2,410 | 2,710 | 3,020 | 3,210 | 3,380 | .02282 | G | 1937–2000 |
| 05392000 | Wisconsin River at Whirlpool Rapids near Rhinelander, Wis. | -.520 | 3,000 | 3,930 | 4,450 | 5,010 | 5,390 | 5,720 | .02443 | G | 1906–1961 |
| 05393000 | Tomahawk River at Bradley, Wis. | -.049 | 1,245 | 1,776 | 2,134 | 2,591 | 2,935 | 3,282 | .05212 | G | 1930–1973 |
| 05395000 | Wisconsin River at Merrill, Wis. | -.403 | 13,600 | 18,800 | 21,900 | 25,500 | 28,000 | 30,400 | .03038 | G | 1903–2000 |
| 05398000 | Wisconsin River at Rothschild, Wis. | -.624 | 27,900 | 38,300 | 44,200 | 50,500 | 54,700 | 58,400 | .02830 | G | 1941–2000 |
| 05400000 | Wisconsin River at Knowlton, Wis. | -.703 | 36,210 | 47,490 | 53,520 | 59,830 | 63,770 | 67,190 | .04751 | G | 1921–1942 |
| 05400760 | Wisconsin River at Wisconsin Rapids, Wis. | -.580 | 33,400 | 46,500 | 54,100 | 62,500 | 68,000 | 73,100 | .02992 | G | 1982–2000 |
| 05401500 | Wisconsin River near Necedah, Wis. | -.621 | 32,400 | 45,700 | 53,300 | 61,700 | 67,200 | 72,200 | .03070 | G | 1903–1950 |
| 05404000 | Wisconsin River near Wisconsin Dells, Wis. | -.764 | 34,200 | 47,200 | 54,300 | 61,700 | 66,400 | 70,400 | .02845 | G | 1935–2000 |
| 05406000 | Wisconsin River at Prairie du Sac, Wis. | -.731 | 37,200 | 51,100 | 58,700 | 66,700 | 71,800 | 76,200 | .02801 | G | 1944–1953 |
| 05407000 | Wisconsin River at Muscoda, Wis. | -.689 | 35,900 | 48,800 | 55,900 | 63,400 | 68,200 | 72,400 | .02718 | G | 1881–2000 |
| 05425912 | Beaver Dam River at Beaver Dam, Wis. | -.283 | 495 | 625 | 701 | 787 | 846 | 901 | .05405 | G | 1986–2000 |
| 05431022 | Delavan Lake Outlet at Borg Road near Delavan, Wis. | -.492 | 227 | 328 | 389 | 460 | 508 | 553 | .08051 | G | 1984–2000 |
Table A-2. Drainage-basin characteristics for rural streamflow-gaging stations in Wisconsin
[mi2, square miles; ft/mi, feet per mile; in/hr, inches per hour; in., inches; snowfall, mean annual snowfall; ft3/s, cubic feet per second; Q100, 100-year flood.]
| Station number | Station name | Contributing area(mi2) | Slope(ft/mi) | Storage(percent) | Forest(percent) | 25-yr, 24-hrprecipitation(in.) | Snowfall(in.) | Soilpermeability(in./hr) | Q100 byregression(ft3/s) | Flood-frequency area |
|---|---|---|---|---|---|---|---|---|---|---|
| 04024400 | Stony Brook near Superior, Wis. | 1.86 | 56.3 | 0.00 | 51.8 | 4.79 | 52.9 | 0.12 | 698 | 4 |
| 04025200 | Pearson Creek near Maple, Wis. | 4.07 | 75.2 | .00 | 39.6 | 4.79 | 63.1 | .12 | 1,593 | 4 |
| 04025500 | Bois Brule River near Brule, Wis. | 118 | 3.60 | 15.4 | 85.0 | 4.79 | 74.9 | 2.98 | 2,021 | 4 |
| 04026200 | Sand River tributary near Red Cliff, Wis. | 1.09 | 204 | 1.75 | 98.0 | 4.79 | 81.5 | .12 | 589 | 4 |
| 04026300 | Sioux River near Washburn, Wis. | 13.7 | 48.6 | 1.21 | 82.6 | 4.79 | 71.5 | 2.19 | 1,614 | 4 |
| 04026400 | Spillerberg Creek near Cayuga, Wis. | 6.59 | 11.5 | 39.4 | 81.4 | 4.66 | 88.1 | 1.65 | 240 | 4 |
| 04026450 | Bad River near Mellen, Wis. | 82.0 | 11.2 | 11.9 | 96.1 | 4.66 | 94.5 | 1.65 | 2,952 | 4 |
| 04026700 | Trout Brook tributary near Marengo, Wis. | .66 | 179 | .00 | 24.2 | 4.66 | 91.5 | .12 | 511 | 4 |
| 04027000 | Bad River near Odanah, Wis. | 597 | 18.8 | 9.70 | 80.0 | 4.66 | 96.0 | 1.51 | 21,243 | 4 |
| 04027200 | Pearl Creek at Grandview, Wis. | 13.7 | 30.6 | 6.38 | 93.1 | 4.79 | 74.8 | 1.65 | 1,025 | 4 |
| 04027500 | White River near Ashland, Wis. | 301 | 19.1 | 13.1 | 80.0 | 4.66 | 66.1 | 2.18 | 9,106 | 4 |
| 04028000 | Montreal River at Ironwood, Mich | 61.4 | 8.62 | 15.7 | 81.1 | 4.66 | 172 | 1.65 | 2,271 | 4 |
| 04029700 | Boomer Creek near Saxon, Wis. | 5.33 | 84.6 | 13.1 | 84.1 | 4.66 | 128 | 1.65 | 636 | 4 |
| 04029990 | Montreal River at Saxon Falls near Saxon, Wis. | 264 | 18.6 | 15.9 | 82.1 | 5.28 | 107 | 1.65 | 9,267 | 4 |
| 04059900 | Allen Creek tributary near Alvin, Wis. | 1.02 | 12.0 | 5.60 | 81.2 | 4.24 | 78.3 | 4.18 | 21.0 | 3 |
| 04063640 | North Branch Pine River at Windsor Dam near Alvin, Wis. | 27.8 | 4.49 | 22.6 | 80.0 | 4.24 | 80.0 | 3.71 | 257 | 3 |
| 04063688 | South Branch Popple River near Newald, Wis. | 9.47 | 18.5 | 18.5 | 93.8 | 4.24 | 59.4 | 2.93 | 134 | 3 |
| 04063700 | Popple River near Fence, Wis. | 131 | 6.24 | 22.8 | 94.5 | 4.24 | 61.7 | 1.40 | 1,943 | 3 |
| 04063800 | Woods Creek near Fence, Wis. | 41.4 | 14.8 | 24.0 | 79.4 | 4.24 | 62.1 | 1.65 | 659 | 3 |
| 04066300 | Cole Creek near Dunbar, Wis. | 3.20 | 27.4 | 19.1 | 85.30 | 4.24 | 56.1 | 2.93 | 51.91 | 3 |
| 04066500 | Pike River at Amberg, Wis. | 255 | 12.6 | 17.2 | 86.0 | 4.24 | 54.4 | 3.68 | 1,684 | 3 |
| 04066700 | McCall Creek at Wausaukee, Wis. | 1.33 | 19.2 | 20.3 | 35.3 | 4.24 | 53.3 | .50 | 103.7 | 3 |
| 04067760 | Peshtigo River near Cavour, Wis. | 150 | 4.40 | 23.6 | 80.7 | 4.24 | 58.6 | 1.45 | 2,097 | 3 |
| 04067800 | Armstrong Creek near Armstrong Creek, Wis. | 23.1 | 7.52 | 36.5 | 61.5 | 4.24 | 58.9 | 2.04 | 317 | 3 |
| 04069500 | Peshtigo River at Peshtigo, Wis. | 1,120 | 6.21 | 18.4 | 72.0 | 4.24 | 51.2 | 2.41 | 7,727 | 3 |
| 04069700 | North Branch Oconto River near Wabeno, Wis. | 34.1 | 10.0 | 15.5 | 71.9 | 4.24 | 63.5 | 1.65 | 618 | 3 |
| 04071000 | Oconto River near Gillett, Wis. | 678 | 7.50 | 16.8 | 88.0 | 4.24 | 51.1 | 2.26 | 5,493 | 3 |
| 04071700 | North Branch Little River near Coleman, Wis. | 23.3 | 10.6 | 15.8 | 26.2 | 4.24 | 50.0 | .50 | 1,008 | 4 |
| 04071800 | Pensaukee River near Pulaski, Wis. | 48.8 | 11.0 | 6.53 | 3.50 | 4.24 | 49.9 | .57 | 2,371 | 4 |
| 04073400 | Bird Creek at Wautoma, Wis. | 3.59 | 27.7 | 5.57 | 31.8 | 4.38 | 41.8 | 4.33 | 70.2 | 3 |
| 04073500 | Fox River at Berlin, Wis. | 1,430 | .84 | 12.6 | 22.0 | 4.38 | 41.1 | 3.69 | 9,021 | 3 |
| 04074300 | Mud Creek near Nashville, Wis. | 9.05 | 6.87 | 37.9 | 90.1 | 4.24 | 66.5 | 2.91 | 111 | 3 |
| 04074700 | Hunting River near Elcho, Wis. | 9.00 | 6.09 | 29.2 | 80.1 | 4.24 | 64.7 | 1.48 | 197 | 3 |
| 04074850 | Lily River near Lily, Wis. | 45.6 | 10.1 | 16.8 | 85.1 | 4.24 | 61.8 | 2.50 | 559 | 3 |
| 04075200 | Evergreen Creek near Langlade, Wis. | 4.90 | 19.7 | 9.90 | 86.9 | 4.24 | 55.3 | 1.92 | 124 | 3 |
| 04075500 | Wolf River above West Branch Wolf River near Keshena, Wis. | 633 | 9.60 | 15.5 | 76.0 | 4.24 | 50.1 | 2.78 | 4,500 | 3 |
| 04077000 | Wolf River at Keshena Falls near Keshena, Wis. | 812 | 9.51 | 13.9 | 69.0 | 4.24 | 49.1 | 2.51 | 6,111 | 3 |
| 04078500 | Embarrass River near Embarrass, Wis. | 395 | 11.9 | 15.0 | 36.0 | 4.24 | 47.4 | 1.72 | 4,470 | 3 |
| 04079000 | Wolf River at New London, Wis. | 2,240 | 5.80 | 14.6 | 43.0 | 4.38 | 42.8 | 1.81 | 21,919 | 3 |
| 04079700 | Spaulding Creek near Big Falls, Wis. | 4.90 | 18.5 | 20.8 | 84.5 | 4.38 | 44.6 | 1.65 | 146 | 3 |
| 04080000 | Little Wolf River at Royalton, Wis. | 514 | 8.77 | 15.8 | 35.0 | 4.38 | 44.1 | 1.28 | 8,459 | 3 |
| 04081000 | Waupaca River near Waupaca, Wis. | 272 | 10.0 | 6.20 | 26.0 | 4.38 | 43.4 | 3.23 | 2,974 | 3 |
| 04081010 | Waupaca River tributary near Waupaca, Wis. | 1.00 | 30.4 | 1.00 | 4.00 | 4.38 | 43.4 | .50 | 172 | 3 |
| 04081900 | Sawyer Creek at Oshkosh, Wis. | 12.0 | 11.0 | .33 | 1.96 | 4.46 | 45.0 | .12 | 4,607 | 3 |
| 04083000 | West Branch Fond du Lac River at Fond du Lac, Wis. | 83.1 | 6.86 | 9.20 | 6.44 | 4.46 | 34.7 | .48 | 2,710 | 4 |
| 04083400 | East Branch Fond du Lac River tributary near Eden, Wis. | .99 | 70.0 | 1.68 | 3.36 | 4.46 | 35.5 | 1.25 | 172 | 4 |
| 04083500 | East Branch Fond du Lac River at Fond du Lac, Wis. | 78.4 | 3.85 | 7.30 | 6.00 | 4.46 | 34.4 | .70 | 2,029 | 4 |
| 04085030 | Apple Creek near Kaukauna, Wis. | 15.2 | 11.8 | .00 | 1.99 | 4.46 | 44.6 | .12 | 2,256 | 4 |
| 04085100 | East River tributary at Greenleaf, Wis. | 7.18 | 40.9 | 12.5 | 13.0 | 4.46 | 44.8 | .69 | 584 | 4 |
| 04085200 | Kewaunee River near Kewaunee, Wis. | 127 | 10.5 | .43 | 8.92 | 4.46 | 38.2 | .36 | 8,995 | 4 |
| 04085300 | Neshota River tributary near Denmark, Wis. | 4.31 | 22.9 | .00 | 2.60 | 4.46 | 42.0 | .12 | 964 | 4 |
| 04085400 | Killsnake River near Chilton, Wis. | 29.4 | 9.23 | 1.42 | 5.39 | 4.46 | 45.8 | .22 | 2,448 | 4 |
| 04085700 | Sheboygan River tributary near Plymouth, Wis. | 6.51 | 21.0 | 2.54 | 12.5 | 4.46 | 43.9 | .39 | 709 | 4 |
| 04086000 | Sheboygan River at Sheboygan, Wis. | 418 | 4.63 | 9.60 | 13.0 | 4.46 | 46.7 | .68 | 9,202 | 4 |
| 04086150 | Milwaukee River at Kewaskum, Wis. | 138 | 4.70 | 12.1 | 13.1 | 4.66 | 40.6 | .61 | 3,328 | 4 |
| 04086200 | East Branch Milwaukee River near New Fane, Wis. | 54.1 | 3.44 | 15.1 | 27.1 | 4.46 | 41.4 | 1.06 | 1,102 | 4 |
| 04086340 | North Branch Milwaukee River near Fillmore, Wis. | 148 | 4.10 | 6.50 | 14.1 | 4.66 | 42.6 | .86 | 3,710 | 4 |
| 04086360 | Milwaukee River at Waubeka, Wis. | 432 | 5.89 | 8.86 | 14.6 | 4.66 | 42.2 | .86 | 9,771 | 4 |
| 04086400 | Milwaukee River tributary near Fredonia, Wis. | .82 | 27.6 | 1.38 | .19 | 4.66 | 39.0 | .12 | 189 | 4 |
| 04086500 | Cedar Creek near Cedarburg, Wis. | 120 | 9.90 | 10.7 | 3.00 | 4.66 | 42.5 | .64 | 4,031 | 4 |
| 04087000 | Milwaukee River at Milwaukee, Wis. | 696 | 5.32 | 9.90 | 12.0 | 4.66 | 40.6 | .77 | 13,939 | 4 |
| 04087050 | Little Menomonie River near Freistadt, Wis. | 8.00 | 30.0 | .75 | 7.16 | 4.66 | 39.5 | .50 | 783 | 5 |
| 04087204 | Oak Creek at South Milwaukee, Wis. | 25.0 | 7.64 | 1.60 | 5.70 | 4.66 | 48.9 | .50 | 999 | 5 |
| 04087230 | West Branch Root River Canal tributary near North Cape, Wis. | 3.19 | 21.4 | 2.04 | 2.55 | 4.66 | 40.1 | .50 | 231 | 5 |
| 04087233 | Root River Canal near Franklin, Wis. | 57.0 | 6.58 | 1.20 | 1.90 | 4.66 | 41.1 | .50 | 2,139 | 5 |
| 04087240 | Root River at Racine, Wis. | 183 | 2.16 | 1.70 | 3.50 | 4.66 | 44.1 | .27 | 3,413 | 5 |
| 04087250 | Pike Creek near Kenosha, Wis. | 7.25 | 8.15 | .97 | .42 | 4.66 | 40.0 | .80 | 373 | 5 |
| 05333100 | Little Frog Creek near Minong, Wis. | 13.0 | 28.5 | 27.7 | 92.3 | 4.79 | 60.5 | 1.77 | 593 | 4 |
| 05334100 | Sawyer Creek near Shell Lake, Wis. | 1.04 | 67.8 | .96 | 16.8 | 4.79 | 43.7 | 1.65 | 193 | 4 |
| 05335380 | Bashaw Brook near Shell Lake, Wis. | 22.8 | 16.7 | 11.2 | 41.9 | 4.79 | 50.2 | 2.40 | 900 | 4 |
| 05340300 | Trade River near Frederic, Wis. | 6.34 | 53.8 | 11.2 | 44.2 | 4.79 | 57.2 | 1.65 | 1,003 | 2 |
| 05341700 | Willow River tributary near New Richmond, Wis. | 1.40 | 50.7 | .00 | 7.14 | 5.28 | 45.7 | 1.65 | 235 | 2 |
| 05341900 | Kinnickinnic River tributary at River Falls, Wis. | 7.26 | 96.0 | .00 | 3.17 | 5.28 | 46.1 | .46 | 4,512 | 2 |
| 05346600 | Little Trimbelle Creek near Bay City, Wis. | 19.9 | 34.9 | .00 | 17.6 | 5.28 | 42.5 | 1.24 | 2,732 | 2 |
| 05356200 | Kenyon Creek near Radisson, Wis. | 7.50 | 12.2 | 24.7 | 87.9 | 4.79 | 58.0 | 1.65 | 435 | 2 |
| 05357360 | Bear River near Powell, Wis. | 120 | 1.08 | 52.4 | 62.8 | 4.66 | 80.6 | 4.68 | 856 | 4 |
| 05357390 | Weber Creek near Mercer, Wis. | 7.10 | 14.6 | 10.8 | 90.3 | 4.66 | 87.4 | 1.65 | 402 | 4 |
| 05358100 | Smith Creek near Park Falls, Wis. | 9.46 | 12.8 | 20.3 | 63.9 | 4.66 | 74.1 | .80 | 499 | 3 |
| 05359500 | South Fork Flambeau River near Phillips, Wis. | 615 | 3.69 | 33.3 | 72.6 | 4.66 | 59.7 | 2.02 | 6,645 | 3 |
| 05359600 | Price Creek near Phillips, Wis. | 16.9 | 5.14 | 39.7 | 95.3 | 4.66 | 59.7 | 1.74 | 380 | 3 |
| 05360200 | Flambeau River tributary at Ladysmith, Wis. | .80 | 15.2 | 28.8 | 48.7 | 4.79 | 56.6 | 1.41 | 70.1 | 2 |
| 05361400 | Hay Creek near Prentice, Wis. | 21.9 | 15.6 | 24.8 | 61.6 | 4.66 | 53.3 | .48 | 1,411 | 3 |
| 05361420 | Douglas Creek near Prentice, Wis. | 24.6 | 22.7 | 8.90 | 74.4 | 4.66 | 51.5 | .80 | 1,301 | 3 |
| 05361600 | North Fork Jump River near Phillips, Wis. | 10.4 | 19.6 | 36.5 | 59.0 | 4.66 | 56.1 | 1.38 | 311 | 3 |
| 05362000 | Jump River at Sheldon, Wis. | 574 | 8.30 | 17.6 | 62.0 | 4.79 | 47.6 | .63 | 41,052 | 2 |
| 05364000 | Yellow River at Cadott, Wis. | 351 | 5.96 | 14.1 | 63.0 | 4.79 | 44.0 | .67 | 19,884 | 2 |
| 05364100 | Seth Creek near Cadott, Wis. | 3.04 | 43.8 | .66 | 32.9 | 4.79 | 43.8 | .50 | 1,108 | 2 |
| 05365000 | Duncan Creek at Chippewa Falls, Wis. | 114 | 6.75 | 1.60 | 11.0 | 4.79 | 46.2 | 2.01 | 3,223 | 2 |
| 05365700 | Goggle-Eye Creek near Thorp, Wis. | 6.70 | 20.0 | 6.42 | 16.9 | 4.66 | 45.3 | .20 | 2,795 | 2 |
| 05366000 | Eau Claire River near Augusta, Wis. | 506 | 7.40 | 5.70 | 45.0 | 4.79 | 43.4 | 1.72 | 15,517 | 2 |
| 05366500 | Eau Claire River near Fall Creek, Wis. | 758 | 6.36 | 4.40 | 43.5 | 4.79 | 45.0 | 1.77 | 20,102 | 2 |
| 05367030 | Willow Creek near Eau Claire, Wis. | 4.38 | 57.1 | .00 | 9.80 | 4.79 | 46.0 | 2.69 | 506 | 2 |
| 05367480 | East Branch Pine Creek tributary near Dallas, Wis. | 3.85 | 52.4 | .00 | 12.2 | 4.79 | 45.3 | 1.34 | 726 | 2 |
| 05367500 | Red Cedar River near Colfax, Wis. | 1,100 | 4.17 | 7.80 | 38.7 | 5.28 | 44.4 | 2.02 | 19,398 | 2 |
| 05367700 | Lightning Creek at Almena, Wis. | 19.8 | 17.1 | 5.56 | 8.14 | 4.79 | 52.2 | .79 | 2,393 | 2 |
| 05368000 | Hay River at Wheeler, Wis. | 426 | 6.12 | 3.20 | 32.4 | 5.28 | 44.4 | 2.12 | 9,872 | 2 |
| 05369000 | Red Cedar River at Menomonie, Wis. | 1,760 | 4.33 | 6.00 | 35.0 | 5.28 | 39.2 | 2.20 | 28,633 | 2 |
| 05369800 | Eau Galle River tributary near Hersey, Wis. | .65 | 68.2 | .00 | 33.8 | 5.28 | 45.7 | .63 | 294 | 2 |
| 05370600 | Arkansaw Creek tributary near Arkansaw, Wis. | 2.56 | 102 | .00 | 27.3 | 5.28 | 43.1 | 1.32 | 903 | 1 |
| 05370900 | Spring Creek near Durand, Wis. | 6.49 | 79.6 | .00 | 56.9 | 5.28 | 43.5 | 1.63 | 1,438 | 1 |
| 05371300 | By Golly Creek near Nelson, Wis. | .28 | 270 | .00 | 50.0 | 5.28 | 42.2 | 1.65 | 182 | 1 |
| 05371800 | Buffalo River tributary near Osseo, Wis. | 1.44 | 67.1 | .00 | 44.4 | 5.28 | 45.5 | 2.50 | 367 | 1 |
| 05371920 | Buffalo River near Mondovi, Wis. | 279 | 7.15 | .41 | 24.9 | 5.28 | 44.7 | 2.39 | 13,473 | 1 |
| 05372000 | Buffalo River near Tell, Wis. | 406 | 6.30 | 2.10 | 28.6 | 5.28 | 41.9 | 2.36 | 16,738 | 1 |
| 05378200 | Eagle Creek near Fountain City, Wis. | 26.8 | 40.9 | .00 | 47.6 | 5.28 | 41.8 | 1.65 | 3,684 | 1 |
| 05379500 | Trempealeau River at Dodge, Wis. | 643 | 3.64 | 1.40 | 25.8 | 5.28 | 45.4 | 1.77 | 18,913 | 1 |
| 05380800 | Black River tributary near Whittlesey, Wis. | 2.12 | 18.6 | 8.50 | 31.6 | 4.66 | 50.3 | .93 | 276 | 2 |
| 05380900 | Poplar River near Owen, Wis. | 157 | 7.04 | 4.17 | 22.2 | 4.66 | 46.1 | .50 | 13,027 | 2 |
| 05380970 | Cawley Creek near Neillsville, Wis. | 38.6 | 17.2 | .08 | 20.3 | 4.66 | 43.0 | .50 | 6,395 | 2 |
| 05381000 | Black River at Neillsville, Wis. | 756 | 5.81 | 7.30 | 30.8 | 4.66 | 41.6 | .62 | 42,318 | 2 |
| 05382000 | Black River near Galesville, Wis. | 2,120 | 5.51 | 8.20 | 43.7 | 5.28 | 37.7 | 2.15 | 59,559 | 1 |
| 05382200 | French Creek near Ettrick, Wis. | 14.3 | 33.8 | .00 | 26.6 | 5.28 | 41.2 | 1.65 | 2,250 | 1 |
| 05382300 | Beaver Creek tributary near Sparta, Wis. | 1.72 | 66.2 | .00 | 39.0 | 5.28 | 42.0 | 4.22 | 444 | 1 |
| 05382500 | Little La Crosse River near Leon, Wis. | 77.1 | 20.0 | 2.60 | 30.4 | 5.28 | 41.1 | 1.68 | 7,210 | 1 |
| 05383000 | La Crosse River near West Salem, Wis. | 398 | 6.98 | 3.10 | 31.9 | 5.28 | 39.8 | 2.99 | 16,895 | 1 |
| 05386300 | Mormon Creek near La Crosse, Wis. | 25.0 | 60.6 | .00 | 36.0 | 5.28 | 39.8 | 1.65 | 4,718 | 1 |
| 05387100 | North Fork Bad Axe River near Genoa, Wis. | 80.9 | 27.3 | .00 | 28.0 | 5.29 | 35.5 | 1.65 | 9,878 | 1 |
| 05388460 | Du Charme Creek at Eastman, Wis. | .30 | 200 | .00 | 30.0 | 5.29 | 37.3 | 1.65 | 204 | 1 |
| 05390140 | Muskrat Creek at Conover, Wis. | 10.2 | 8.45 | 4.47 | 92.3 | 4.66 | 79.7 | 3.37 | 237 | 3 |
| 05390240 | Fourmile Creek near Three Lakes, Wis. | 10.3 | 8.27 | 21.2 | 88.2 | 4.66 | 74.7 | 3.01 | 190 | 3 |
| 05391260 | Gudegast Creek near Starks, Wis. | 14.0 | 7.04 | 22.7 | 75.0 | 4.66 | 66.0 | 4.04 | 192 | 3 |
| 05391950 | Squaw Creek near Harrison, Wis. | 3.23 | 17.9 | 13.9 | 82.8 | 4.66 | 59.1 | 2.50 | 93 | 3 |
| 05392150 | Mishonagon Creek near Woodruff, Wis. | 13.9 | 6.77 | 26.2 | 82.4 | 4.66 | 83.5 | 6.22 | 132 | 3 |
| 05392350 | Bearskin Creek near Harshaw, Wis. | 19.6 | 6.48 | 28.7 | 69.3 | 4.66 | 57.6 | 6.27 | 170 | 3 |
| 05393500 | Spirit River at Spirit Falls, Wis. | 81.6 | 12.5 | 17.2 | 51.5 | 4.66 | 56.0 | .85 | 2,877 | 3 |
| 05393640 | Little Pine Creek near Irma, Wis. | 22.0 | 24.0 | 9.55 | 79.9 | 4.66 | 55.7 | 3.30 | 389 | 3 |
| 05394000 | New Wood River near Merrill, Wis. | 82.2 | 14.7 | 14.5 | 84.2 | 4.66 | 53.7 | .74 | 3,342 | 3 |
| 05394200 | Devil Creek near Merrill, Wis. | 9.58 | 10.5 | 2.48 | 26.4 | 4.66 | 52.9 | .50 | 1,095 | 3 |
| 05394500 | Prairie River near Merrill, Wis. | 184 | 10.4 | 23.2 | 74.6 | 4.66 | 53.5 | 1.54 | 3,308 | 3 |
| 05395020 | Lloyd Creek near Doering, Wis. | 7.80 | 25.5 | 2.57 | 74.4 | 4.24 | 56.3 | .71 | 503 | 3 |
| 05395100 | Trappe River tributary near Merrill, Wis. | 1.58 | 35.0 | .00 | 34.5 | 4.66 | 53.7 | .50 | 517 | 2 |
| 05396000 | Rib River at Rib Falls, Wis. | 303 | 11.8 | 6.80 | 55.4 | 4.66 | 51.4 | .89 | 21,860 | 2 |
| 05396100 | Pet Brook near Edgar, Wis. | 6.86 | 54.5 | .00 | 15.3 | 4.66 | 49.4 | .42 | 3,144 | 2 |
| 05397500 | Eau Claire River at Kelly, Wis. | 375 | 8.28 | 11.4 | 45.2 | 4.66 | 50.9 | 1.28 | 7,955 | 3 |
| 05397600 | Big Sandy Creek near Wausau, Wis. | 11.5 | 20.3 | .00 | 55.4 | 4.66 | 53.6 | .47 | 1,772 | 3 |
| 05399000 | Big Eau Pleine River near Colby, Wis. | 78.1 | 9.29 | 3.80 | 17.4 | 4.66 | 52.7 | .25 | 14,023 | 2 |
| 05399200 | Marsh Cr tributary near Abbotsford, Wis. | .56 | 62.2 | 8.93 | 16.0 | 4.66 | 53.7 | .25 | 492 | 2 |
| 05399500 | Big Eau Pleine River near Stratford, Wis. | 224 | 10.1 | 1.90 | 21.2 | 4.66 | 66.6 | .31 | 33,619 | 2 |
| 05400025 | Johnson Creek near Knowlton, Wis. | 25.1 | 32.6 | 2.55 | 56.4 | 4.66 | 47.3 | .41 | 2,788 | 3 |
| 05400500 | Plover River near Stevens Point, Wis. | 145 | 5.64 | 18.9 | 40.7 | 4.38 | 44.8 | 1.79 | 2,230 | 3 |
| 05400650 | Little Plover River at Plover, Wis. | 7.91 | 10.7 | 1.50 | 26.5 | 4.38 | 42.7 | 5.96 | 130 | 3 |
| 05401050 | Tenmile Creek near Nekoosa, Wis. | 55.8 | 6.54 | 8.00 | 22.7 | 4.38 | 43.8 | 8.46 | 367 | 3 |
| 05401535 | Big Roche A Cri Creek near Adams, Wis. | 52.8 | 4.83 | 1.50 | 38.7 | 4.38 | 41.7 | 7.28 | 527 | 3 |
| 05401800 | Yellow River tributary near Pittsville, Wis. | 7.23 | 20.1 | .30 | 27.5 | 4.38 | 44.3 | .57 | 866 | 3 |
| 05402000 | Yellow River at Babcock, Wis. | 215 | 7.63 | 4.90 | 39.2 | 4.38 | 43.5 | .77 | 13,219 | 2 |
| 05403000 | Yellow River at Necedah, Wis. | 491 | 6.07 | 9.40 | 48.7 | 4.38 | 34.3 | 1.68 | 13,502 | 2 |
| 05403500 | Lemonweir River at New Lisbon, Wis. | 507 | 3.65 | 15.6 | 44.2 | 4.38 | 41.9 | 2.88 | 6,559 | 2 |
| 05403520 | Webster Creek at New Lisbon, Wis. | 11.8 | 19.3 | .00 | 41.7 | 4.38 | 43.8 | 1.64 | 908 | 2 |
| 05403550 | Onemile Creek near Mauston, Wis. | 30.2 | 15.9 | .50 | 28.3 | 4.38 | 47.7 | 1.26 | 2,357 | 2 |
| 05403630 | Hulbert Creek near Wisconsin Dells, Wis. | 11.2 | 29.8 | .09 | 44.3 | 5.29 | 40.4 | 1.65 | 721 | 3 |
| 05403700 | Dell Creek near Lake Delton, Wis. | 44.9 | 11.6 | .94 | 28.5 | 5.29 | 40.9 | 2.40 | 1,483 | 3 |
| 05404200 | Narrows Creek at Loganville, Wis. | 40.1 | 29.1 | .00 | 13.0 | 5.29 | 43.6 | 1.59 | 4,350 | 5 |
| 05405000 | Baraboo River near Baraboo, Wis. | 609 | 2.02 | .60 | 28.8 | 5.29 | 38.2 | 1.48 | 12,300 | 5 |
| 05405600 | Rowan Creek at Poynette, Wis. | 10.4 | 30.4 | .30 | 8.90 | 5.18 | 33.9 | 1.42 | 1,152 | 5 |
| 05406500 | Black Earth Creek at Black Earth, Wis. | 42.8 | 9.42 | .20 | 21.8 | 5.18 | 34.9 | 1.52 | 1,469 | 1 |
| 05406800 | Rocky Branch near Richland Center, Wis. | 1.68 | 100 | .00 | 40.9 | 5.29 | 39.6 | 1.65 | 581 | 1 |
| 05407100 | Richland Creek near Plugtown, Wis. | 19.2 | 51.8 | .00 | 35.9 | 5.29 | 36.1 | 1.65 | 3,657 | 1 |
| 05407200 | Crooked Creek near Boscobel, Wis. | 12.9 | 51.1 | .00 | 35.1 | 5.29 | 35.3 | 1.65 | 2,562 | 1 |
| 05407400 | Morris Creek tributary near Norwalk, Wis. | 4.59 | 126 | .00 | 29.9 | 5.28 | 43.2 | 1.65 | 1,669 | 1 |
| 05408000 | Kickapoo River at La Farge, Wis. | 266 | 9.13 | .10 | 34.0 | 5.29 | 38.6 | 1.63 | 14,402 | 1 |
| 05410500 | Kickapoo River at Steuben, Wis. | 690 | 4.30 | .30 | 37.2 | 5.29 | 35.4 | 1.51 | 21,397 | 1 |
| 05413400 | Pigeon Creek near Lancaster, Wis. | 6.93 | 49.8 | .00 | 1.62 | 5.29 | 33.3 | 1.65 | 3,294 | 1 |
| 05413500 | Grant River at Burton, Wis. | 269 | 9.73 | .00 | 22.1 | 5.29 | 31.5 | 1.65 | 17,175 | 1 |
| 05414000 | Platte River near Rockville, Wis. | 142 | 11.5 | .00 | 22.3 | 5.29 | 34.1 | 1.65 | 10,672 | 1 |
| 05414200 | Bear Branch near Platteville, Wis. | 2.72 | 60.2 | .00 | 1.07 | 5.29 | 37.2 | 1.65 | 1,703 | 1 |
| 05414900 | Pats Creek near Elk Grove, Wis. | 8.50 | 26.9 | .00 | 4.00 | 5.29 | 35.7 | 1.65 | 2,268 | 1 |
| 05415000 | Galena River at Buncombe, Wis. | 125 | 11.3 | .00 | 4.10 | 5.29 | 33.2 | 1.62 | 15,145 | 1 |
| 05423000 | West Branch Rock River near Waupun, Wis. | 40.7 | 9.58 | 10.0 | 1.57 | 4.46 | 38.1 | .96 | 1,422 | 4 |
| 05423300 | South Branch Rock River tributary near Waupun, Wis. | 12.6 | 13.8 | 14.5 | 1.18 | 4.46 | 38.2 | 1.00 | 528 | 3 |
| 05423500 | South Branch Rock River at Waupun, Wis. | 63.6 | 8.33 | 8.20 | 1.50 | 4.46 | 38.2 | 1.51 | 1,624 | 3 |
| 05423800 | East Branch Rock River tributary near Slinger, Wis. | 4.42 | 74.2 | .99 | 7.56 | 4.66 | 39.0 | .80 | 663 | 5 |
| 05424000 | East Branch Rock River near Mayville, Wis. | 181 | 3.21 | 3.80 | 10.6 | 5.18 | 37.1 | .79 | 4,509 | 4 |
| 05424300 | Rock River tributary near Watertown, Wis. | 4.58 | 13.2 | .00 | 4.58 | 5.18 | 38.2 | .56 | 412 | 5 |
| 05425500 | Rock River at Watertown, Wis. | 969 | 1.38 | 12.1 | 9.10 | 5.18 | 39.5 | .99 | 6,454 | 5 |
| 05425700 | Robbins Creek at Columbus, Wis. | 8.01 | 21.0 | 1.99 | 3.86 | 5.18 | 36.2 | 1.65 | 533 | 5 |
| 05425827 | Maunesha River near Sun Prairie, Wis. | 26.0 | 12.9 | .87 | 3.45 | 5.18 | 34.6 | 1.47 | 1,518 | 5 |
| 05426000 | Crawfish River at Milford, Wis. | 762 | 2.50 | 11.1 | 7.40 | 5.18 | 37.2 | 1.18 | 7,026 | 5 |
| 05426100 | Scuppernong Creek near Wales, Wis. | 5.69 | 21.1 | 13.1 | 12.7 | 4.66 | 38.7 | 2.67 | 201 | 5 |
| 05427200 | Allen Creek near Fort Atkinson, Wis. | 10.2 | 15.5 | 4.11 | 3.24 | 5.18 | 37.1 | 2.98 | 459 | 5 |
| 05427800 | Token Creek near Madison, Wis. | 24.3 | 8.53 | 1.24 | 3.43 | 5.18 | 33.6 | 1.65 | 1,102 | 5 |
| 05430100 | Badfish Creek near Stoughton, Wis. | 39.8 | 8.01 | 1.78 | 4.40 | 5.18 | 32.4 | 1.92 | 1,518 | 5 |
| 05430500 | Rock River at Afton, Wis. | 3,340 | .74 | 11.4 | 7.90 | 5.18 | 31.5 | 1.20 | 14,853 | 5 |
| 05432300 | Rock Branch near Mineral Point, Wis. | 4.83 | 80.1 | .00 | 6.42 | 5.29 | 36.5 | .98 | 2,259 | 1 |
| 05432500 | Pecatonica River at Darlington, Wis. | 273 | 8.25 | .00 | 11.7 | 5.29 | 35.4 | 1.57 | 19,189 | 1 |
| 05433000 | East Branch Pecatonica River near Blanchardville, Wis. | 221 | 8.25 | .10 | 17.2 | 5.29 | 30.0 | .68 | 14,203 | 1 |
| 05433500 | Yellowstone River near Blanchardville, Wis. | 28.5 | 26.4 | .00 | 7.00 | 5.29 | 35.1 | .51 | 5,707 | 1 |
| 05434200 | Skinner Creek tributary near Monroe, Wis. | .48 | 136 | .00 | .00 | 5.18 | 37.9 | .12 | 325 | 1 |
| 05434500 | Pecatonica River at Martintown, Wis. | 1,030 | 2.27 | .30 | 11.5 | 5.18 | 29.6 | 1.08 | 13,577 | 1 |
| 05435900 | Sugar River tributary near Pine Bluff, Wis. | 7.42 | 43.9 | .00 | 10.8 | 5.18 | 33.8 | .42 | 910 | 1 |
| 05436000 | Mount Vernon Creek near Mount Vernon, Wis. | 16.4 | 25.0 | .00 | 13.0 | 5.18 | 34.0 | .36 | 1,270 | 1 |
| 05436200 | Gill Creek near Brooklyn, Wis. | 3.34 | 57.3 | .00 | 5.69 | 5.18 | 33.5 | 1.65 | 620 | 1 |
| 05436500 | Sugar River near Brodhead, Wis. | 523 | 3.18 | .90 | 12.0 | 5.18 | 31.9 | 1.08 | 8,843 | 1 |
| 05437200 | East Fork Raccoon Creek tributary near Beloit, Wis. | 4.64 | 24.3 | .00 | 3.85 | 5.18 | 30.2 | .78 | 554 | 5 |
| 05543830 | Fox River at Waukesha, Wis. | 126 | 6.73 | 5.20 | 6.70 | 4.66 | 39.3 | .56 | 2,854 | 5 |
| 05544300 | Mukwonago River tributary near Mukwonago, Wis. | 1.32 | 21.1 | .00 | 4.55 | 4.66 | 39.8 | 3.75 | 164 | 5 |
| 05545100 | Sugar Creek at Elkhorn, Wis. | 6.68 | 12.0 | 3.60 | 4.04 | 4.66 | 42.2 | .36 | 289 | 5 |
| 05545200 | White River tributary near Burlington, Wis. | 2.42 | 34.8 | .83 | 2.48 | 4.66 | 40.1 | 1.08 | 280 | 5 |
| 05545300 | White River near Burlington, Wis. | 97.5 | 15.1 | 15.4 | 13.3 | 4.66 | 37.8 | .81 | 2,171 | 5 |
| 05546500 | Fox River at Wilmot, Wis. | 868 | 1.11 | 7.80 | 10.0 | 4.66 | 44.2 | .74 | 6,185 | 5 |
| 05548150 | North Branch Nippersink Creek near Genoa City, Wis. | 13.5 | 12.8 | 3.80 | 1.67 | 4.66 | 42.8 | 2.75 | 557 | 5 |
Document Accessibility: Adobe Systems Incorporated has information about PDFs and the visually impaired. This information provides tools to help make PDF files accessible. These tools convert Adobe PDF documents into HTML or ASCII text, which then can be read by a number of common screen-reading programs that synthesize text as audible speech. In addition, an accessible version of Acrobat Reader 6.0, which contains support for screen readers, is available. These tools and the accessible reader may be obtained free from Adobe at Adobe Access.
| AccessibilityFOIAPrivacyPolicies and Notices | |
 |
|