
An estimated 205,000 tons of nitrogen and 38,100 tons of phosphorus are input annually into the lower Tennessee River Basin from nonpoint and point sources. Nonpoint sources include basinwide, diffuse inputs from fertilizers applied to crops, lawns, and golf courses, failing septic systems, livestock and pet waste, atmospheric deposition, and natural sources in the rocks and soil. Point sources of nutrients include discharges directly to streams and lakes, such as wastewater from municipal and industrial facilities. An unknown percentage of nutrients in fertilizers, livestock waste, and other basinwide inputs is transported to streams during storm events or mobilized by natural chemical processes in the soil and then transported by ground water into streams.
Nutrient inputs from nonpoint and point sources were estimated for the lower Tennessee River Basin and for 11 tributary basins (fig. 1). Basinwide information on nonpoint sources was available only for atmospheric deposition and agricultural sources, which includes commercial fertilizer inputs, nitrogen fixation by leguminous crops, and livestock waste. Nonpoint sources account for about 94 percent of the nitrogen inputs and 98 percent of the phosphorus inputs to the Basin. Despite the smaller percentage of total nutrient inputs, point sources can have noticeable effects on water quality, especially when streamflows are low.
The combustion of fossil fuels, such as oil and coal, by automobiles, electric utilities, and large industries is the major source of nitrogen in atmospheric deposition. Although atmospheric deposition contributes about 34,600 tons of total nitrogen annually to the lower Tennessee River Basin, atmospheric deposition is not considered to be a significant source of phosphorus to the lower Tennessee River Basin (Kingsbury and others, 1999).
Atmospheric inputs of total nitrogen range from 1.6 to 2.0 tons per square mile per year [(tons/mi2)/yr] in the 11 basins in the lower Tennessee River Basin. Although atmospheric inputs of total nitrogen are similar among the 11 basins, the percentage of inputs from atmospheric deposition is highly variable within each basin. Only 11 percent of the nonpoint-source inputs of annual total nitrogen are from atmospheric deposition in an agricultural tributary basin (Town Creek Basin); whereas, about 43 percent of the nonpoint-source inputs of annual total nitrogen are from atmospheric deposition in the undeveloped Sequatchie River Basin (fig. 1).
Inputs of nitrogen and phosphorus from fertilizers, nitrogen fixation by leguminous crops, and livestock waste contribute about 157,000 tons of nitrogen and 37,300 tons of phosphorus annually to the lower Tennessee River Basin. Inputs from agricultural activities are distributed throughout the basin and the percentage of these inputs transported to streams is difficult to estimate. Accumulation and denitrification in the soil and volatilization of nitrogen in livestock waste are just a few examples of how nutrients are assimilated and made unavailable for transport to a stream. In addition, corn, soybeans, cotton, and other crops grown in the Basin incorporate nutrients into plant biomass that is removed from the Basin when a crop is harvested and exported. Estimates of nutrient inputs from agricultural activities were adjusted by subtracting crop uptake from the sum of the fertilizer application, nitrogen fixation, and livestock waste. Crop uptake accounts for about 58,000 tons of nitrogen and 7,100 tons of phosphorus annually in the lower Tennessee River Basin. Corrections for other nutrient sinks were not estimated for this report.
Agricultural inputs accounted for the largest percentage of inputs of total nitrogen and total phosphorus in all the basins evaluated. Basinwide inputs of nutrients from agricultural activities ranged from 2.4 to 15 (tons/mi2)/yr for total nitrogen and 1.2 to 3.2 (tons/mi2)/yr for total phosphorus (fig. 1). The lowest inputs of total nitrogen and total phosphorus from agricultural activities occurred in basins where the percentage of crop and pasture land was least (Sequatchie River Basin and Buffalo River Basin). The highest agricultural inputs of total nitrogen were in the Town Creek Basin. Over 86 percent of the agricultural inputs in the Town Creek Basin are from livestock operations, mainly from confined animal operations. Phosphorus inputs were not estimated for Flint Creek Basin, Sequatchie River Basin, or Town Creek Basin because of limited concentration data, which prevented a comparison of inputs and outputs.
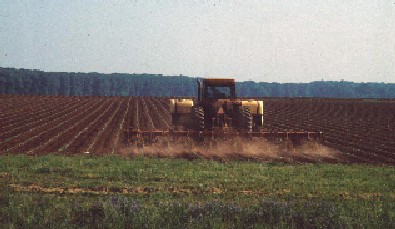
Row crops are grown predominantly along the flood plains of
the major tributaries and the main stem of the Tennessee River. Cotton, corn,
and soybeans are the primary row crops in the lower Tennessee River Basin.
Discharges from sewage treatment plants and industrial facilities contribute about 13,400 tons of nitrogen and 760 tons of phosphorus annually to the lower Tennessee River Basin. As noted previously, nutrient inputs from point sources enter streams directly. Undetermined amounts of nutrients can be assimilated in streams near discharge points and the remaining proportion of nutrients transported further downstream. Nutrient inputs from point sources accounted for less than 6 percent of the estimated nutrient inputs to the tributary basins. Point-source inputs of nutrients were lowest in the Flint Creek and Town Creek Basins and highest in the Clarks River Basin. Inputs from point sources in the tributary basins ranged from 0 to 0.61 (tons/mi2)/yr for total nitrogen and 0 to 0.14 (tons/mi2)/yr for total phosphorus (fig. 1).

Nutrients from point sources are discharged directly into streams
and can have noticeable effects on water quality, especially when streamflows
are low.
| AccessibilityFOIAPrivacyPolicies and Notices | |
 |
|