U.S. GEOLOGICAL SURVEY This document is also available in pdf format: Washington Geologic and Hydrologic Hazards U.S. Geological Survey (USGS) activities in Washington have increasingly focused on threats from geologic and hydrologic hazards in the rapidly growing urban area in northwestern Washington. Volcanic mudflows, landslides, earthquakes, and floods may have significant impacts on the region. The USGS is developing information for emergency-management agencies, city planners, and private industry for use in reduction of human and economic risks associated with these hazards. Volcanic Hazard Mount Rainier poses severe volcanic hazards to communities as far away as the Puget Sound, principally in the forms of volcanic mudflows and other debris flows that can sweep down the valleys draining the volcano. Geologic studies (http://vulcan.wr.usgs.gov/home.html) show that, during the past few thousand years, mudflows spanned valley floors well into the Puget Lowland about every 500 to 1,000 years. The USGS addresses these hazards through projects that determine the inundation area, frequency and origin of these flows, and through studies that investigate the eruptive style and stability of the volcano. The USGS, in cooperation with Pierce County and the University of Washington, has undertaken a 2-year pilot project to develop a warning system to detect mudflows before they reach threatened communities. This warning system employs a network of monitors that measure high-frequency ground motion associated with the flows. Upon detection, the system is intended to notify emergency-management officials who then initiate preplanned emergency responses. Landslide Hazards The USGS, the City of Seattle, and a geotechnical consulting firm under contract to the city are collaborating to produce a landslide-hazards map of Seattle and to establish rainfall thresholds for predicting the onset of landslides during storms. Susceptibility to, and potential hazards from, landslides will be determined using geological, topographic and material-properties data. Earthquake Hazards The densely populated Puget Lowland faces significant earthquake hazards. Large tremors have shaken the area since prehistoric times. Geologic investigations on southern Bainbridge Island, for example, indicate that a magnitude-7 earthquake occurred about 1,100 years ago on the Seattle Fault. The effects of that earthquake include 16 to 23 feet of uplift on the south side of the fault, subsidence north of the fault in the Seattle Basin, widespread liquefaction and development of a tsunami.
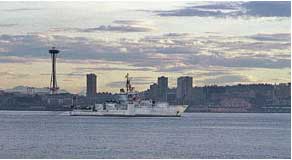
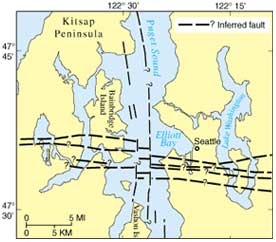
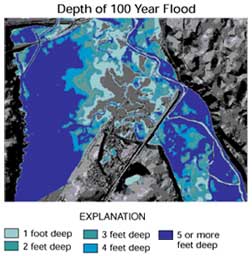
In 1998, the USGS conducted the SHIPS (Seismic Hazards in Puget Sound) experiment (fig. 1) in collaboration with several universities and the Geological Survey of Canada to reveal the Earth's structure and faults (fig. 2) to depths of about 15 miles below land surface. The USGS is incorporating information on active faults and crustal structure, earthquake recurrence, and earthquake-site response into new seismic-hazard maps that illustrate the probability of strong earthquake-induced ground motions. These maps provide critical input to the engineering community for building-code development and infrastructure design. Flood Hazards--New Flood-Mapping Technique The USGS has developed a new, less labor-intensive method of producing flood maps that reduces map-production time while generating maps of greater detail and comparable accuracy (http://wa.water.usgs.gov/pubs/ofr/floodgis/). The new method utilizes geographic information system (GIS) technology and newly available high-resolution digital-elevation information. GIS allows new types of maps to be generated, such as depth-of-flood maps (fig. 3), and provides the capability to overlay other information, such as roads and land use.
Real-Time Flood Alert and Simulation in Puyallup River Basin Pierce County and the USGS have partnered to develop a streamflow network and computer model that alerts the county of impending floods in the Puyallup River Basin. This model provides much more detailed results than those provided by the existing National Weather Service (NWS) River Forecast Center model. Two-day flood forecasts are made using precipitation and temperature forecasts from the NWS. A customized user interface provides a graphical display of gage locations where flood-alert threshold values have been exceeded.
Environmental Issues Nutrient Transport to Puget Sound The USGS, as part of the National Water-Quality Assessment (NAWQA) Program (http://wa.water.usgs.gov/projects/pugt), estimated the annual nutrient yields for each of the 16 major rivers that drain into Puget Sound. Yields from rivers draining the intensive agricultural and populous eastern part of the Puget Sound Basin are about three times larger than those from rivers draining the forested western part of the Basin. Excess nutrients in Puget Sound can lead to low dissolved-oxygen concentrations that can adversely affect the health of fish and other aquatic life. Contaminants in Fish Tissue and Streambed Sediments in Streams That Drain into Puget Sound An investigation of the occurrence of organic compounds and trace elements in streambed sediment and fish tissue and their relation to land use was a part of the USGS NAWQA Program. These contaminants accumulate over time in fish tissues and in fine-grained streambed sediments. Elevated levels of these contaminants, many of which are toxic or carcinogenic, were found primarily in samples obtained from urban streams. Nitrate Contamination of Central Columbia Plateau Ground Water More than 80 percent of the drinking water in the Central Columbia Plateau comes from ground water. A USGS NAWQA study of that area (http://wa.water.usgs.gov/projects/ccyk) indicates that nearly 20 percent of the wells sampled had nitrate concentrations that exceed EPA guidelines. Nitrogen fertilizers applied to agricultural fields are the primary source of elevated nitrate concentrations in shallow ground water. The presence of elevated concentrations indicates that pesticides used along with fertilizers also may be present in the ground water. In February 1998, the Columbia Basin Ground Water Management Area was established partly to work towards reducing nitrate concentrations in ground water (http://wa.water.usgs.gov/projects/cbgwma/). Declining Amphibian Populations Amphibian populations are reported to be declining worldwide during the last few decades. Increased mortality rates among many species are thought to be the result of their breeding in open water, where eggs, larvae and adults are directly exposed to pesticides, herbicides, acidification and ultraviolet radiation. In Washington, however, a declining population of salamanders may be the result of man's effort to develop recreational fisheries. The practice of stocking fish in several Cascade Range lakes from the late 1800's through the mid-1970's resulted in significant reductions in the salamander populations of those lakes. The fish ingested some of the resident salamanders, and both species competed for the same food supply. During the last 3 years, salamander populations have greatly increased at three lakes on the slopes of Mount Rainier, where more than 1,500 trout have been removed by the USGS and Oregon State University. Salmon Issues The USGS Western Fisheries Research Center in Seattle studies fish and aquatic resources to fulfill the science-information needs of natural-resource managers throughout the West. Established in the early 1930's, the center is nationally and internationally recognized for research on fish health, fish ecology, aquatic contaminants and aquatic ecosystems. Proposed Strategy for Restoration of Snake River Fall Chinook Salmon
Fall chinook salmon in the Snake River are listed as threatened under the Endangered Species Act. Hells Canyon, a 100-mile free-flowing reach of the Snake River, supports the largest remaining population of fall chinook salmon in the river. One strategy for salmon recovery is to supplement the natural population by releasing juvenile hatchery fish in rearing areas. When hatchery fish return as adults, they spawn naturally, thereby increasing in-river production. The USGS, in cooperation with the U.S. Fish and Wildlife Service and the Idaho Fishery Resource Office, is estimating travel rates and survival of both hatchery and wild fall chinook salmon through the lower Snake River hydropower system.
Marine Mammal and Salmon Interactions Increasing numbers of harbor seals are feeding on imperiled runs of chum and chinook salmon in Hood Canal, a large natural inlet forming the western portion of Puget Sound. The USGS Washington Cooperative Fish and Wildlife Research Unit, in collaboration with the Washington State Department of Fish and Wildlife, is studying seal foraging at the mouths of five rivers that flow into Hood Canal. Each river supports significant salmon runs, and each has large numbers of harbor seals near its mouth. Researchers are trying to determine which categories of seals (age, gender, etc.) are most responsible for salmon mortalities. The results of this research will help fishery managers devise plans for reducing seal predation to improve chances for long-term survival of salmon stocks. Restoration of Elwha River Native Salmon Fisheries The Elwha River once was famous for its salmon and steelhead runs. Most of these runs ceased to exist after construction of the Elwha (1910) and Glines Canyon (1925) dams. Congress, through passage of the Elwha Restoration Act, mandated restoration of these salmon runs. The Secretary of the Interior, after considering several alternatives, determined that removal of both dams was the only alternative that had the potential to restore the native fisheries. Samples collected in 1997 by the USGS, in cooperation with the Lower Elwha Klallam Tribe and the National Park Service, indicate that the concentrations of nutrients in the main-stem of the Elwha River, where the greatest potential for restoration exists, generally are very low. However, based on predictions that removal of both dams would significantly increase the available habitat and the influx of salmon, large increases in nutrients, sufficient to support a healthy fishery, would be expected from decomposing spawned-out salmon.
Habitat Potential for Endangered Yakima River Basin Fisheries Development of management plans for the recovery of endangered and threatened fish stocks requires, among other things, a sound understanding of the hydrology of a river basin. The hydrology of the Yakima River Basin is being studied as part of the Watershed and River Systems Management Program, a collaborative effort between the USGS and the Bureau of Reclamation (http://wa.water.usgs.gov/projects/yakimawarsmp/warsmp/). As part of that project, preliminary estimates of streamflow in 59 subbasins have been made to help determine the distribution of fish-habitat potential (fig. 5) under pre-development-type conditions throughout the basin. Map Products Ten-Meter Digital-Elevation Models Topographic data are the foundation for many water, geological and fish habitat studies. In 1993, a partnership was formed among the USGS, the Washington Department of Natural Resources (DNR), the USDA Forest Service and local governments to complete a statewide coverage of 30-meter-resolution digital-elevation data (called Digital-Elevation Models or DEM's). More recently, watershed-planning efforts and fish-habitat studies are increasing the need for higher-resolution digital representations of terrain data. As a result, new partnerships have been formed to create a 10-meter-resolution digitalelevation data base for the State. Ten-meter DEM's are already available for parts of western Washington and are planned to be completed for the Cascade Range and parts of eastern Washington by the end of 1999. Single-Edition Topographic Maps The USGS and the Forest Service are cooperatively producing 540 1:24,000-scale single-edition topographic maps that cover National Forest lands throughout Washington. USGS and Forest Service base-map data will be combined to create maps that contain more detailed landownership and road information than is present on standard USGS topographic maps. The Forest Service will assemble, and update as needed, the various map-data layers, and the USGS will print and distribute the resulting maps. Single-edition maps, like standard USGS products, are available from map dealers, USGS Earth Science Information Centers (http://mapping.usgs.gov/esic), and National Forest Visitor Centers Digital Orthophotos The USGS manages the National Aerial Photography Program and the National Digital Orthophoto Program to ensure the availability of digital orthophotos. Two other agencies have participated in the production of digital orthophotos for Washington State. The DNR, designated as the State mapping agency, acquires aerial photos and produces digital orthophotos for State and private lands in Washington. The Forest Service acquires aerial photos and produces digital orthophotos for National Forest lands in Washington. To eliminate duplication of effort, coordination of these programs began in 1996. Cooperative programs have been established to incorporate Forest Service digital orthophotos into the USGS national data base and to convert DNR digital orthophotos to USGS specifications. Descriptions and ordering information for aerial photographs and digital orthophotos are available through the USGS Earth Science Information Offices and the Global Land Information System (http://edcwww.cr.usgs.gov/webglis/). Water Resources Data The USGS, in cooperation with local, State, and other Federal agencies, collects and disseminates such water data as streamflow, reservoir and lake stage, ground-water levels, water quality and precipitation. Current and historical data for Washington are available at http://wa.water.usgs.gov. River-stage and flow-rate data are updated about every 4 hours for more than 150 streamflow-gaging sites. During floods, river-stage and flow-rate data for over 70 of these sites are updated every 15 minutes. These data are used by the NWS, the U.S. Army Corps of Engineers, and State and local emergency-management agencies for forecasting and managing flood fighting, evacuation and rescue operations.
|