One Hundred Years of Streamflow Measurements in Massachusetts and Rhode IslandBy Mary S. Ashman, Roy S. Socolow, and Joseph L. ZancaUSGS Fact Sheet FS-2004-3056 |
The U.S. Geological Survey (USGS) has been collecting streamflow data in Massachusetts and Rhode Island for over 100 years. Since the first streamflow measurements were made in the late 19th century, the isolated sites where streamflow data were collected have evolved into a monitoring network of 112 streamflow-gaging stations. Today, nearly three-quarters of the stations have satellite telemetry equipment to make streamflow data available to the public on the World Wide Web within 4 hours of collection. Data from this network are used by Federal, State, and local government agencies, water-resources managers, National Weather Service river forecasters, watershed associations, university scientists, recreational enthusiasts, and citizens with an interest in their local rivers.
From its inception in the 19th century, the USGS streamflow-gaging network has served the public interest. From providing information about streamflow to mill owners to providing data to river forecasters, data from this network have helped water-resource managers make sound decisions in managing water resources in Massachusetts and Rhode Island. This fact sheet summarizes the history and development of this network and demonstrates how data are collected from it. It discusses how the network has historically served the public interest, continues to do so today after a century of continuous data collection, and how it will do so in the future.
From its beginning, the USGS streamflow-gaging network has evolved in response to the needs of the public. In the late 19th century, streamflow-gaging activities in Massachusetts and Rhode Island began at the behest of industries that used the power of flowing water. Many of these industries were mills along the swiftly flowing rivers of Massachusetts and Rhode Island. At that time, a mill employee or local resident measured the stream stage, the height of the water surface with respect to a reference elevation. Discharge, the volume of water flowing past a point during a unit of time, was measured by the USGS when the office hydrographer (now called a hydrologist or a hydrologic technician) traveled to the site. Usually discharge was measured at least once a month, but could be less frequent if travel was difficult. Measurement intervals and the types of data differed from site to site. At some sites, the stage was measured each day if the river was free of ice; and at others, the stage was measured sporadically and a monthly mean for stage was calculated from the measurements. The entire data-collection effort was overseen by USGS personnel, and the stage and monthly mean discharge values were published in the USGS Water-Supply and Irrigation Paper series (Barrows and Hoyt, 1905).
The first streamflow-gaging station in Massachusetts with the longest continuous record of data was installed on the Connecticut River at Sunderland in March 1904. In 1929, it was moved 9 miles north to Montague City, where it still operates today. The second such station was established in August 1909 on The Quaboag River in West Brimfield, and the third in August 1912 on the Ware River at Gibbs Crossing (Socolow and others, 2003). By 1930, 17 stations were operating in Massachusetts, all but 2 of which were in western Massachusetts. In Rhode Island, the oldest currently operating streamflow-gaging station was built in 1929 on the Blackstone River at Woonsocket in an area also heavily industrialized with mills.
Over the years, the network has grown in response to floods and droughts. Severe flooding in the 1930s provided an impetus for additional flow-monitoring stations. The number of stations increased from a total of 15 in Massachusetts and Rhode Island before the floods to about 60 during the late 1930s and early 1940s. Six of Rhode Island’s 22 continuous streamflow-gaging stations were installed shortly after the devastating hurricane of 1938. After the extended drought of the 1960s, 25 new stations were installed in the two states.
 |
|---|
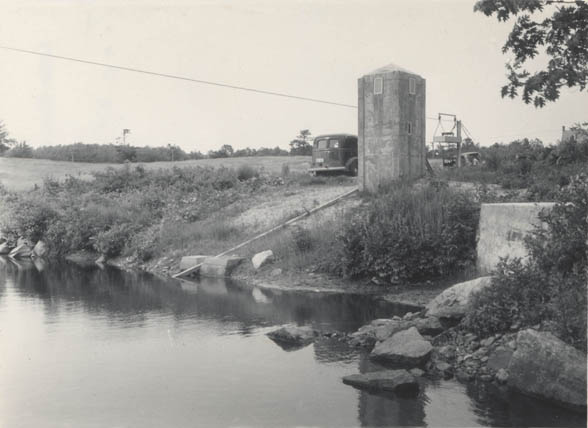
Streamflow-gaging station Little River at Oxford, Massachusetts. This 1940 photo shows the gage house, cable car and cableway. |
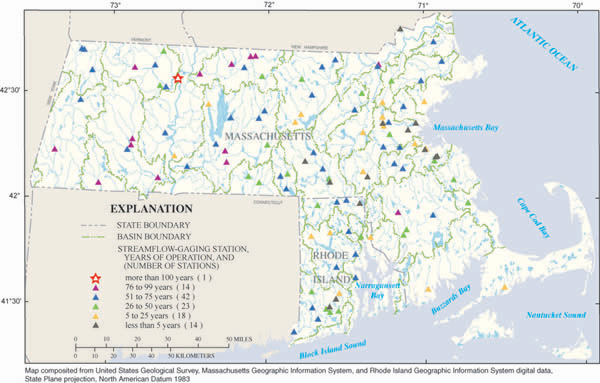
Today (2004) 90 stations in Massachusetts and 22 in Rhode Island provide continuous streamflow data (fig. 1). The total number of stations in both states reached a maximum of 114 in 1973, at which time some stations were discontinued because of changes in water-resource-management needs (Zarriello and Socolow, 2003). The total number of stations from 1973 until the present has fluctuated around 100, and now stands at 112. In both states, stations are cooperatively funded by the USGS and by other Federal, State, and local government agencies, with the USGS maintaining and operating the stations and publishing the streamflow data annually.
Data from these networks serve the dual purpose of meeting site-specific and regional needs. Examples of site-specific needs include the regulation of dam storage and release, and monitoring the magnitude and frequency of flooding and low flows. Examples of regional needs include flood forecasting in cooperation with the National Weather Service, developing regionalized flow estimates for use at sites where there are no streamflow data, and determining long-term changes in streamflow. Streamflow data are also used to study patterns of contamination in river water and sediments and to determine how land use affects streamflows.
In addition to the continuously operating streamflow-gaging network, the USGS installs and operates temporary stations, usually for 1 or 2 years, to collect data for specific investigations. These short-term stations may be installed in such diverse settings as the outlets of ponds, inside culverted waterways in urban areas, or in wetlands. Some short-term stations record stage only. When the data have been collected or the investigation ends, the station is usually discontinued. For example, MA-RI office personnel recently installed temporary stations to collect streamflow and water-quality data for several tributaries to the Charles River.
 |
|---|
Figure 1. Locations and periods of record for the 112 streamflow-gaging stations currently operating in Massachusetts and Rhode Island. |
The technology for measuring and transmitting stage data has changed greatly during the past 100 years from manual field observations to automated acquisition, processing, and dissemination. From the 1920s to the 1950s, stage recorders used a float that moved up and down with the water surface. Through a cable and pulley, the float’s movements were transferred to a pen, which traced the stage record onto graph paper taped to a revolving drum. The graphs were manually read and interpreted.
Electronic storage and processing of streamflow data began in the early 1960s, when recorders were developed that punched stage readings into paper tapes. These tapes were then read by a computer and the data were stored in electronic files. During the 1970s, data recorders with satellite-telemetry equipment were introduced. Within the past 14 years, the percentage of telemetered stations in Massachusetts and Rhode Island has increased from 20 percent to 72 percent. At 4-hour intervals, the data are transmitted to a satellite, which relays them to a central USGS computer. The data are then sent from the central USGS computer to the computer in the local USGS office in Massachusetts. By the mid-1990s, all streamflow-gaging stations in Massachusetts and Rhode Island were equipped with digital data recorders.
In contrast, techniques for measuring discharge have changed little during the past 100 years. Discharge measurements and stream-channel surveys are still made by USGS personnel who visit the stations about every 2 months. Because erosion and deposition of bed and bank material can change the shape of the channel at the station site, the stage and discharge data for each station must be periodically remeasured. A current meter is still used to measure the water velocity at predetermined points along a marked tagline (fig. 2), a suspended cableway, or a bridge across the river. The depth of the water is also measured at each point. These depth and velocity measurements are used to compute the total volume of water flowing past the tagline during a specific interval of time.
 |
|---|
Figure 2. The USGS measures discharge on the Connecticut River at Montague City, Massachusetts, 2001. |
Once six to eight paired measurements of stage and discharge have been collected for a station, these values are plotted on a graph. A line of best fit, called a rating curve, is drawn through the plotted points (fig. 3). A rating curve is a graphical tool that relates stage to discharge over the entire range of a river’s flow, from extremely low to extremely high flows. Today, the mathematical function represented by the rating curve is programmed and stored in USGS computers to compute discharge from measurements of stage.
 |
|---|
Figure 3. The rating curve for the Connecticut River at Montague City streamflow-gaging station, Massachusetts (the oldest continuously operating station in Massachusetts). |
Stage and discharge data are usually available to the public on the World Wide Web within 4 hours of the time measurements were taken (Zarriello and Socolow, 2003). Data on the World Wide Web also include all historical records of daily mean streamflow. Streamflow data collected during each water year (October through the following September) are published in an annual data report, which in recent years has also become available on the World Wide Web. Other USGS reports document streamflow measurements made at temporary stations installed for specific investigations.
Advances in streamflow-gaging technology are expected to improve the accuracy and reliability of streamflow measurements under a wide range of hydrologic conditions. Two goals in Massachusetts and Rhode Island are to equip all stations with telemetry and to increase the frequency of transmission at all stations from every 4 hours to every hour. Most of the recent advances, however, consist of the development of equipment to measure water velocity indirectly. Flow sensors, such as the acoustic Doppler current profiler, can make thousands of velocity and depth measurements in rapid succession as they are towed across a river. Such equipment makes the collection of streamflow data safer and cheaper, particularly during floods, on large rivers with rapid flows, or in confined spaces such as culverted waterways and storm drains. Satellite technology is also improving; in the future, it might be possible to make streamflow measurements from space. Such observations would be especially important for floods on rivers in remote areas.
As demands on water resources increase, so do the demands for streamflow data. Specifically, the link between surface-water and ground-water resources is receiving an increasing amount of attention. Because streams and ground water may be hydraulically connected with one another, they constitute a single resource. Withdrawals at wells near streams can greatly reduce streamflow, and in some cases, can cause streams to run dry. To address this concern, the USGS has used data from both surface- and ground-water sources to determine how best to allocate water supplies, particularly during the summertime when flows are low. Computer models can simulate the effects of alternative water-management scenarios on the availability of water. In addition, the USGS has developed regional relations to estimate streamflow data for ungaged sites (Zarriello and Socolow, 2003). Such relations have been refined and expanded to many ungaged areas to provide complete regional sets of streamflow data to the public. Finally, long-term streamflow records show trends that can be correlated with changes in human activities or with climate change.
The collection of streamflow data for Massachusetts and Rhode Island is a vital aspect of water-resources planning and hydrologic research. The streamflow-gaging network provides the information needed by water-resource managers to make informed decisions about using and protecting surface-water resources to prevent the loss of life and property, to protect public health, and to ensure a continuing source of water to meet society’s needs. Maintaining the streamflow-gaging network will ensure that reliable streamflow data will remain available to the public.
 |
|---|
Cows drowned probably during the 1927 Connecticut River flood. |
Intense rain, snowmelt, and storm surges are major causes of floods. Although damage from floods can be severe, most floodsare restricted to small areas around rivers. Drought is a moisture deficit that has an adverse effect on vegetation, animals, and people over a sizeable area. Streamflows can become depleted during a drought if water is withdrawn too rapidly from nearby wells. Whereas the duration of a flood is typically a few days, droughts can last for several years, or even decades. Near-real-time records from USGS streamflow-gaging stations are used by Federal, State, local emergency-management agencies, and the National Weather Service to warn the public in advance of floods to reduce the loss of life and damage to property, and to manage water levels in streams during droughts so that the depletion of streamflow can be minimized.
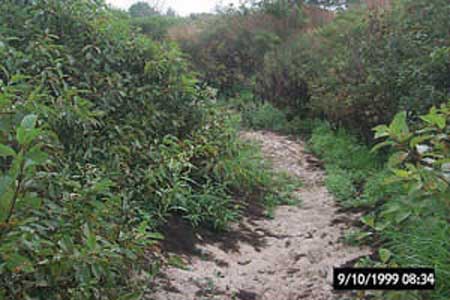
The worst flood on record in Massachusetts and Rhode Island was the result of intense rain and a storm surge before and during the hurricane of September 21, 1938. In early April 2004, intense rains caused flooding in Massachusetts (fig. 4). The longest and most severe drought on record lasted from 1961 to 1969 in Massachusetts and from 1963 to 1967 in Rhode Island. The most recent drought affecting Massachusetts and Rhode Island occurred in the spring and summer of 1999.
 |
|---|
Figure 4. Recent hydrograph from the Massachusetts-Rhode Island office’s Web page for the Montague City station, Connecticut River, with the flood peak of April 2, 2004. A flood of this magnitude has a probability of occurring about once every 2 years. |
Visit the USGS national water-watch Web site at http://water.usgs.gov/waterwatch for more information about floods and droughts. Go to http://ma.water.usgs.gov/water/water_floods.htm for more information about floods and high flows, and to http://ma.water.usgs.gov/water/drought_index.htm for more information about droughts and low flows in Massachusetts and Rhode Island.
 |
|---|
The dry bed of the Ipswich River during the drought of 1999. |
For more information about USGS streamflow gaging and other USGS activities in Massachusetts and Rhode Island, contact the USGS offices in Northborough, MA, 1-508-490-5000, and Providence, RI, 1-401-331-9050, or visit http://ma.water.usgs.gov/ for online data and links.
Prepared by Mary S. Ashman, Roy S. Socolow, and Joseph L. Zanca. Graphic design by Mark V. Bonito.
This report is presented in Portable Document Format (PDF). To view and print report you will need to have PDF Viewer or Adobe Acrobat Reader (available as freeware). Users with visual disabilities can click here for conversion tools and information to help make PDF files more accessible
Accessible text version FS2004-3056.txt (17 kilobytes)
Printable PDF version FS2004-3056_web.pdf (3,562 KB) -- 4 pages
The citation for this report, in USGS format, is as follows:
Ashman, M.S., Socolow, R.S., and Zanca, J.L., One Hundred Years of Streamflow Measurements in Massachusetts and Rhode Island, FS-2004-3056, 4 p.
For more information about USGS activities in Massachusetts-Rhode Island District, visit the USGS Massachusetts-Rhode Island Home Page
| AccessibilityFOIAPrivacyPolicies and Notices | |
 |
|