Contaminants in the Mississippi River
U.S. GEOLOGICAL SURVEY CIRCULAR 1133
Reston, Virginia, 1995
Edited by Robert H. Meade
Pesticides in the Mississippi River
Donald A. Goolsby and Wilfred E. Pereira
Introduction
The Mississippi River basin contains the largest and most intensively
farmed region in the Nation. In order to increase yields from crops,
large amounts of pesticides are used to protect against weeds,
insects, and other pests. The major categories of pesticides are
herbicides, insecticides, and fungicides. It is estimated that about
two-thirds of all pesticides used for agriculture in the United States
are applied to cropland and pasture land in the Mississippi River
Basin (Gianessi and Puffer, 1990). The intense use of pesticides is
of concern because of potential adverse effects on the quality and use
of water resources. The most immediate concerns are for aquatic life
and for the 18 million people in the basin who rely on surface-water
sources for drinking water.
Nitrogen Applied to Croplands
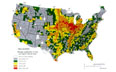
(Click on image for a larger version, 99K)
Figure 37. -- An estimated 5.5 million metric
tons of nitrogen fertilizer were applied to croplands in the
Mississippi River Basin during 1991. This map was prepared by
W.A. Battaglin of the U.S. Geological Survey to show the geographical
distribution of the estimated use of nitrogen fertilizer in the Nation
during 1991. County estimates were made by J.J. Fletcher of West
Virginia University, using fertilizer expense estimates from the 1987
Census of Agriculture. State totals were compiled by the National
Fertilizer and Environmental Research Center of the Tennessee Valley
Authority. Agricultural lands of the Corn-Belt States of Iowa,
Illinois, Indiana, and Minnesota clearly are potential sources of
nutrients in the Mississippi River.
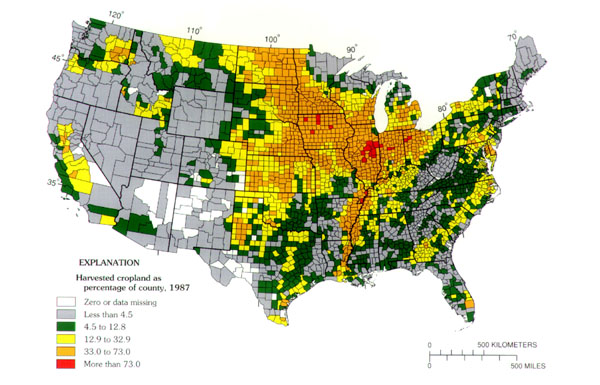
Harvested Croplands

(Click on image for a larger version, 99K)
Figure 38. -- Cropland in the United States is
concentrated most heavily in the areas drained by the Mississippi
River. In this map, prepared by W.A. Battaglin of the U.S. Geological
Survey from data supplied by the U.S. Department of Commerce, Bureau
of the Census, Census of Agriculture, harvested cropland is expressed
as a percentage of the total area of each county. The Mississippi
River Basin contains about 65 percent of the total harvested cropland
in the Nation, producing about 80 percent of the corn and soybeans,
and much of the cotton, rice, sorghum, and wheat (U.S. Department of
Agriculture, 1985; U.S. Department of Commerce, 1989).
Many of the pesticides used in the basin are present in the
Mississippi River and its tributaries. A regional-scale study of a
10-State area in the upper Midwest showed that large amounts of
herbicides are flushed into streams during storm runoff in late spring
and summer each year, following application of herbicides to cropland
(Thurman and others, 1992). Storm runoff produces high concentrations
of many herbicides in streams across the upper Midwest from Nebraska
to Ohio for periods of several weeks to several months. Concentration
of herbicides in some small streams may exceed 100 micrograms per
liter (µg/L) for short periods of time. Flow from these streams,
in turn, transports significant amounts of herbicides into large
rivers such as the Missouri, Ohio, and Mississippi, and eventually to
the Gulf of Mexico (Pereira and Rostad, 1990; Goolsby and others,
1991; Pereira and Hostettler, 1993).
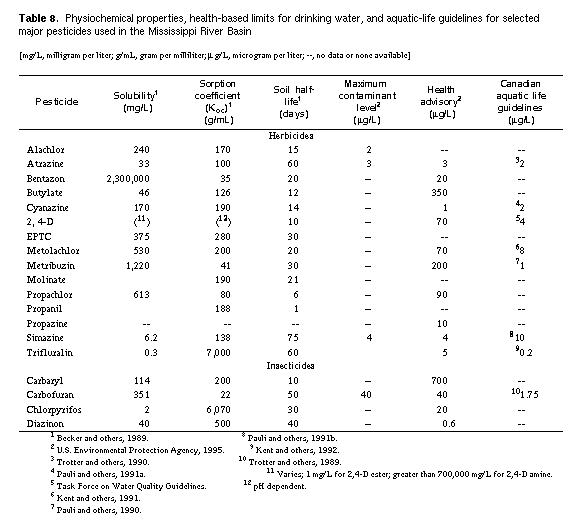
Sources and Properties of Pesticides
Pesticides include a wide variety of synthetic organic and inorganic
compounds used to control weeds, insects, nematodes and other pests.
The U.S. Environmental Protection Agency (Aspelin and others, 1992)
estimated that in 1991 about 490 million kilograms (kg) of pesticides
were used annually in the United States. These include herbicides
(285 million kg), insecticides (113 million kg), and fungicides (54
million kg). About three-fourths of the total annual pesticide use is
for agriculture (Aspelin and others, 1992). In 1991, about 218
million kg of pesticides were used on major field crops alone, of
which about 84 percent were herbicides (U.S. Department of
Agriculture, 1992).
Pesticides derived from point and nonpoint sources in the Mississippi
River basin are transported into the Mississippi River in runoff from
agricultural and urban areas, discharge from reservoirs and aquifers,
and atmospheric deposition (Nations and Hallberg, 1992). The
physiochemical properties of the pesticides themselves, as well as
other factors such as usage, rainfall, and farming practices, are
important in governing the amounts and concentrations that actually
occur in streams. Several important physiochemical properties of the
most widely used pesticides in the Mississippi River basin are given
in table 8. These include water solubility, soil half-life, and soil
sorption coefficient (Koc). Water solubility determines
how easily pesticides wash off soil and crop residues and how easily
they leach through the soil. Pesticides with solubilities greater
than about 30 milligrams per liter (mg/L) are considered to be soluble
and more likely to wash off the soil during storms. Soil half-life is
the length of time required for pesticides to degrade in the soil to
one-half their previous concentration. The longer the soil half-life
the more persistent the pesticide, and the longer it will be available
to wash off in storm runoff. The half-life of pesticides, once they
are in surface water, is generally much longer than in soil because
water contains much less organic matter and fewer micro-organisms to
degrade the pesticides. Many pesticides are highly persistent in
streamwater and in reservoirs, but very little specific information is
available on pesticide half-lives in natural water bodies. The soil
sorption coefficient is a measure of the tendency of a pesticide to
attach to soil particles. The larger the Koc value the
more strongly the pesticide will be adsorbed to soil. Those with
Koc values less than about 500 tend to be transported
primarily in the dissolved phase. Those with Koc values of
more than 1000 are transported primarily on suspended-sediment
particles.
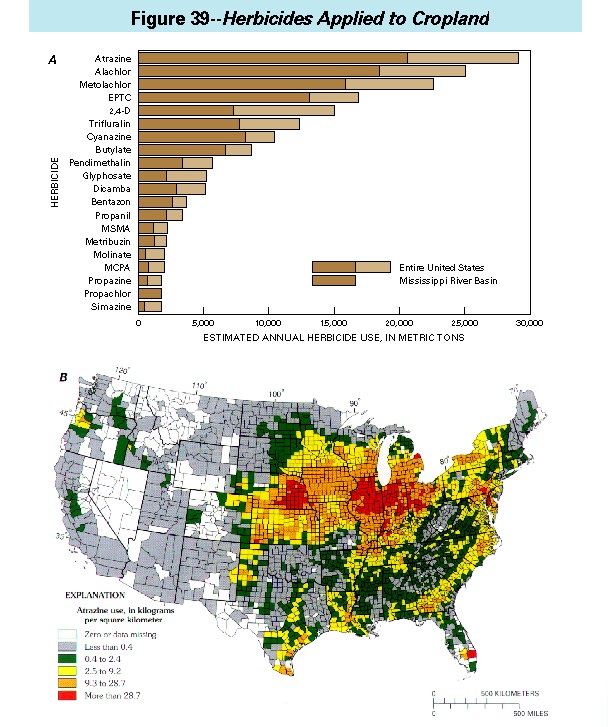
Herbicides Applied to Croplands

(Click on image for a larger version, 132K)
Figure 39. -- Most of the pesticides used in the
Mississippi River Basin are herbicides used for weed control. Data
portrayed in this figure, representing the years 1987--89, were
obtained from Resources for the Future (Gianessi and Puffer, 1990).
-
A
-
The 20 most heavily used herbicides are shown in this graph. The most
heavily applied herbicides are atrazine, alachlor, and metolachlor,
which are used in the production of corn and soybeans.
-
B
-
Atrazine is used most heavily in the upper Midwest, generally to
control broad-leaved weeds in cornfields. Other herbicides used
extensively on corn and soybean fields have geographical patterns of
use similar to that of atrazine, but the amounts are somewhat
less.
The physiochemical properties listed in table 8 indicate that
relatively soluble and mobile compounds such as atrazine, alachlor,
metolachlor, and many other herbicides are transported primarily in
the dissolved phase.
This group of compounds includes the majority of pesticides in use
today. However, soil half-life and other factors such as intensity of
use, application methods, and climatic conditions are also important
in determining transport in surface water. Most of the older "first
generation" chlorinated insecticides, such as DDT, chlordane, and
dieldrin (not shown in table 8), are insoluble in water, have long
soil half-lives, and large Koc values. Consequently, they
are transported primarily on sediment particles. Most of these
first-generation chlorinated insecticides are banned and are no longer
used in the United States, but continue to persist in the Mississippi
River Basin from previous use because of long soil half-lives. Also,
because these chlorinated insecticides are relatively insoluble in
water and have large Koc values, they partition into the
organic coatings of sediments or accumulate in the fatty tissues of
fish and other stream biota (Moore and Ramamoorthy, 1984), which is
not true for most pesticides currently in use.
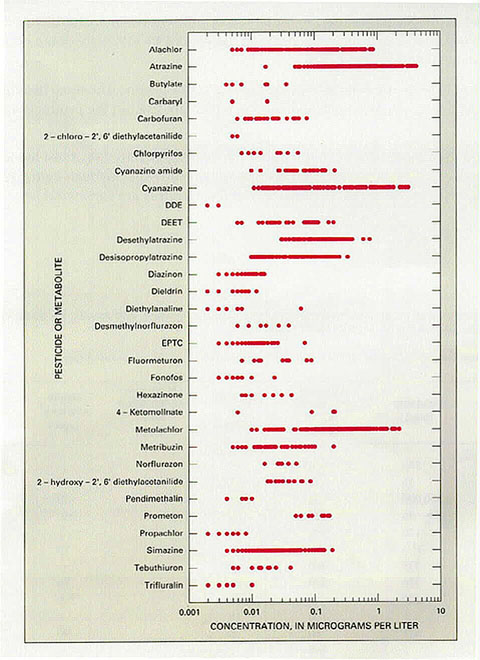
Pesticides in the River
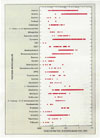
(Click on image for a larger version, 99K)
Figure 40. -- The concentrations of 32 pesticides
and pesticide-degradation products dissolved in waters collected from
the main-stem Mississippi River during 1987--92 are shown here in dot
plots. These plots show the distribution and range in concentration
for each pesticide. Each dot represents one sample. The dot plots
summarize a diverse body of data that represents concentrations during
different seasons of the year at numerous locations. The samples on
which the plots are based were collected (1) during 10 downriver
sampling trips between July 1987 and May 1992 and (2) approximately
weekly at 3 fixed stations on the Mississippi River (Clinton, Iowa;
Thebes, Illinois; Baton Rouge, Louisiana) from April 1991 through
September 1992. The concentrations of pesticides measured near the
mouths of tributaries that flow into the Mississippi River generally
are slightly higher than those shown in this figure. Specific
sampling locations and analytical data are given by Coupe and others
(1995) and Pereira and others (1995).
Drinking-Water Standards and Aquatic-Life Guidelines
The maximum contaminant levels (MCLs), or drinking-water standards,
that have been established by the U.S. Environmental Protection Agency
(1995) for several pesticides also are shown in table 8. MCLs are
based on annual average concentrations and are legally enforceable
under the Safe Drinking Water Act. MCLs are based on analyses of a
minimum of four samples per year, and a violation occurs only if the
average concentration in these samples exceeds the MCL. Further, MCLs
apply to water delivered at the tap and not the raw water source.
However, conventional water treatment removes very little of the
water-soluble pesticides currently used in the Mississippi River
Basin. At present (1995) MCLs are established only for individual
compounds and do not consider the possible effects of complex mixtures
of pesticides and their degradation products.
Health advisories (HAs) have been established for many other
pesticides (table 8). HAs are the recommended maximum concentrations
in drinking water for lifetime exposure and are not legally
enforceable. However, in time, the lifetime HAs for many pesticides
may become enforceable MCLs.
Many pesticides may have adverse effects on aquatic life, but
at present (1995), the U.S. Environmental Protection Agency has
established standards or criteria for aquatic life for very few
current-generation pesticides. However, Environment Canada has
established water-quality guidelines for specific water uses in Canada
that include drinking water, aquatic life, and agricultural uses of
water (Wong and Kent, 1988). The guidelines are numerical
concentrations recommended to support and maintain a designated water
use. Because U.S. guidelines or criteria for aquatic life do not
presently exist for most pesticides in current use, the Canadian
pesticide water-quality guidelines, where available, have been
included in table 8 as points of reference for pesticide
concentrations measured in the Mississippi River Basin.
Occurrence and Temporal Distribution of Pesticides in Water
More than 40 pesticides and pesticide degradation products were
detected during 1987--92 in water samples collected from the
Mississippi River or from the mouths of large rivers that flow
directly into the Mississippi (Goolsby and Battaglin, 1993).
Thirty-two pesticides and pesticide degradation products that were
detected in 5 percent or more of the nearly 600 water samples
collected during the study period are shown in figure 40. The
pesticides detected most frequently and in highest concentrations were
the most extensively used compounds with low Koc values
such as atrazine, alachlor, metolachlor, and cyanazine. In contrast,
several other extensively used compounds such as butylate, EPTC, and
trifluralin (fig. 39A) were detected infrequently and in low
concentrations. The most persistent compounds were alachlor,
atrazine, cyanazine, desethylatrazine (an atrazine degradation
product), metolachlor, and simazine, all of which are herbicides.
These herbicides were detected in low concentrations in more than 75
percent of the samples analyzed. Two herbicides, atrazine and
metolachlor, were detected in more than 95 percent of the samples.
Although numerous pesticides were detected in many samples, only three
compounds, atrazine, alachlor, and cyanazine, exceeded MCLs or HAs in
only a small percentage of samples. The average annual concentrations
were far below MCLs or HAs. Atrazine and cyanazine concentrations in
a few samples also exceeded the Canadian aquatic-life guidelines
(compare concentrations shown in figure 40 with the guidelines listed
in table 8).
For a period of several weeks during May through July, atrazine,
cyanazine, and to a lesser extent alachlor concentrations in the
Mississippi River main stem and in tributaries may exceed MCLs or HAs.
However, because the annual average concentrations of these compounds
are well below health-based limits, there is no violation of the Safe
Drinking Water Act and the water would be considered suitable for
public supply from the standpoint of pesticides.
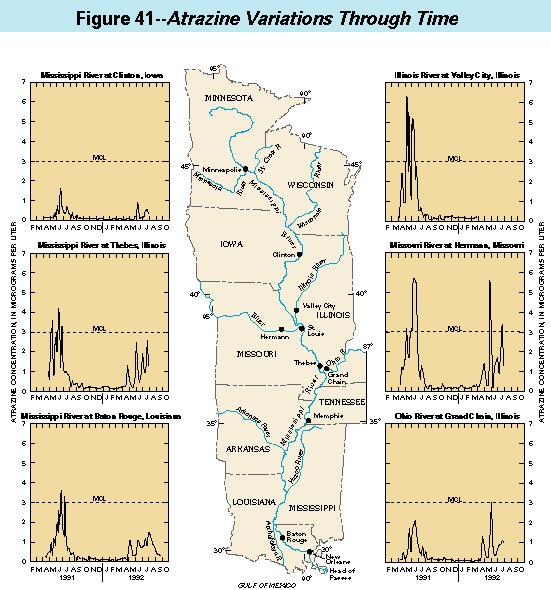
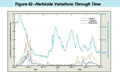
Atrazine Variation Through Time

(Click on image for a larger version, 99K)
Figure 41. -- Pronounced seasonal variations are
typical of pesticide concentrations in the Mississippi River and its
tributaries. Atrazine, the example portrayed in this figure, is more
concentrated during late spring and early summer than during other
parts of the year. Concentrations shown here are based on samples
collected approximately weekly (more frequently during late spring and
early summer, less frequently at other times). Runoff caused by
rainstorms following the application of atrazine to cornfields early
in the growing season flushes a portion of the atrazine into streams
that eventually flow into the Mississippi River. Most other major
herbicides show a seasonal pattern of runoff similar to that of
atrazine. Data from two growing seasons, 1991 and 1992, are shown
here. The differences in concentrations between 1991 and 1992
probably are caused by differences in the intensity and timing of
rainfall. Pesticides will be transported in storm runoff as long as
their residues remain on the soil or on plant surfaces. As the
growing season progresses and wanes, concentrations of pesticides in
storm runoff decrease to low levels. For a few weeks of 1991 and
1992, concentrations of atrazine, cyanazine, and (to a lesser extent)
alachlor reached or exceeded maximum contaminant levels (MCLs) or
health advisories (HAs). However, the average annual concentrations
of these compounds were well below these health-based limits.
Therefore, these pesticide concentrations did not violate the Safe
Drinking Water Act or make the water unsuitable for public supply.
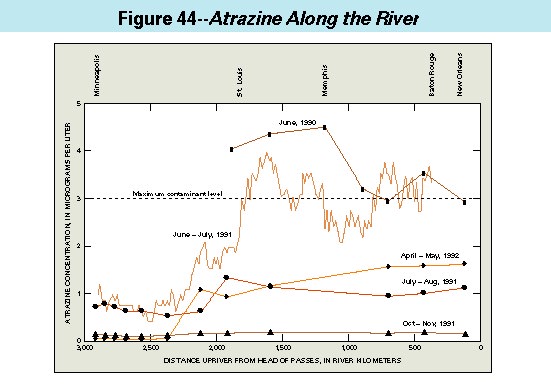
Spatial Distribution of Pesticides in Water
The majority of all pesticides used in the Mississippi River Basin are
applied in the upper part of the basin. Consequently, streams
draining Illinois, Iowa, Indiana, eastern Nebraska, and southern
Minnesota contribute the largest quantities of pesticides to the
Mississippi River. As water flows downriver from the Minneapolis
area, inflow from tributary streams results in large and often
dramatic increases in pesticide concentrations during May through
July, as illustrated in figure 44.
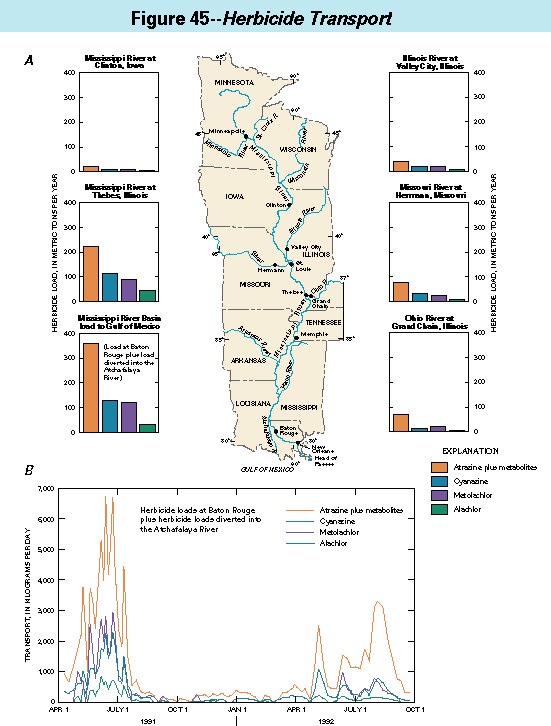
Mass Transport of Pesticides
Two major objectives of our Mississippi River study were to determine
the predominant source areas for pesticides and to estimate the mass
transport of these chemicals from major tributaries into the
Mississippi River and to the Gulf of Mexico for a 1-year period. The
transport for each pesticide of interest was calculated for each day
of the year using either measured or estimated daily pesticide
concentrations and mean daily streamflow. Pesticide concentrations
were estimated by linear interpolations for days on which no samples
were collected. The estimated daily transports were then summed to
obtain an estimate of annual transport. Mass-transport estimates were
made in this manner for the six sites where approximately weekly
samples were collected. The annual mass transport of pesticides to
the Gulf of Mexico was estimated from concentrations measured at Baton
Rouge, Louisiana, and streamflow at Baton Rouge plus the streamflow
diverted from the Mississippi into the Atchafalaya River upstream from
Baton Rouge (fig. 45). Loads of 21 major pesticides and degradation
products transported by the Mississippi River at four locations and by
three major tributaries during a 1-year period (April 1, 1991, through
March 31, 1992) are given in table 9.
Iowa and Illinois are the predominant sources for most pesticides
transported by the Mississippi River. The Upper Mississippi River
Basin, excluding the Missouri River Basin, constitutes about 22
percent of the total Mississippi River drainage basin, but contributes
about 40 percent of the atrazine, and 50 percent or more of many other
pesticides transported by the Mississippi River (table 9). The area
receives essentially all of the streamflow discharged from Iowa and
Illinois, which contain the most intensive crop-production areas in
the basin (fig. 38). These two States apparently also are the sources
for much of the agricultural chemicals transported by the Mississippi
River. The Ohio River Basin is the source of about one-half the
butylate and most of the simazine transported by the Mississippi River
(table 9), and the Missouri River Basin is the predominant source for
trifluralin.
Although the annual mass transport appears to be large for several
pesticides (table 9), it represents only a small fraction, generally
less than 3 percent, of the pesticide mass applied annually to
cropland in the basin. The mass of pesticides discharged from the
Mississippi River Basin to the Gulf of Mexico during April 1991
through March 1992 expressed as a percentage of the annual mass
applied to cropland was 0.2 percent for alachlor, 0.8 percent for
metolachlor, 1.6 percent for atrazine and cyanazine, and 2.7 percent
for simazine. A similar fraction of the mass of these pesticides
applied in the Illinois, Ohio, and Missouri River Basins was
discharged from these rivers. These percentages may be higher or
lower in other years, depending on rainfall patterns.
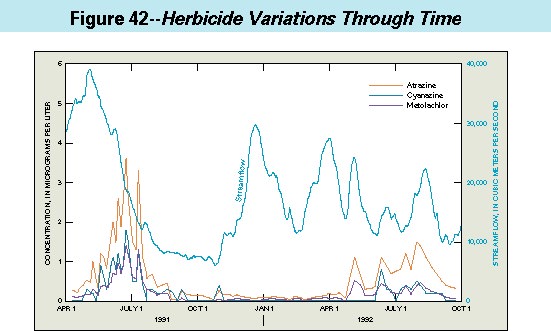
Herbicide Variations Through Time
(Click on image for a larger version, 50K)
Figure 42. -- Temporal variations in the concentrations
of herbicides in the Mississippi River reflect two factors: (1) the
application of the herbicides on croplands, and (2) the rainfall and runoff
events that follow the applications. This figure shows the concentrations
of three herbicides measured in the Mississippi River at Baton Rouge,
Louisiana, at weekly to biweekly intervals between April 1991 and September
1992. Plotted in the figure is the streamflow at Baton Rouge plus the flow
diverted into the Atchafalaya River above Baton Rouge. The heavier
rainfalls during the planting and post-planting periods in 1991 resulted in
greater streamflows, more flushing of herbicides from the fields, and
higher herbicide concentrations than in 1992.
Summary
Most streams throughout the Midwestern United States contain water
with high concentrations of pesticides for several weeks to several
months following the application of pesticides to farmlands.
Concentrations generally are largest and may briefly exceed
health-based limits for drinking water during runoff from the first
storms after application. Concentrations decrease during later runoff
events. More than 40 pesticides and pesticide degradation products
were detected in the Mississippi River. Most of these were at
concentrations less than 0.5 µg/L. Maximum concentrations during
1991--92 of the most extensively used herbicides such as alachlor,
atrazine, cyanazine, and metolachlor ranged from 3 µg/L to about 6
µg/L in large rivers such as the Mississippi, Missouri, and Ohio,
compared to 50 to more than 100 µg/L reported in previous studies
of smaller tributaries. These high concentrations generally represent
extreme conditions that do not persist past midsummer. The average
annual concentrations of all pesticides measured in the Mississippi
River are well below health-based limits and do not violate the Safe
Drinking Water Act. Low concentrations (0.05 to 0.2 µg/L) of a few
pesticides are detectable year-round in the Mississippi River Basin
owing to storage and subsequent discharge from surface- and
ground-water reservoirs. The total mass of pesticides discharged from
the Mississippi River and its major tributaries from April 1991
through March 1992 represents a small fraction (from less than 0.1 to
about 3 percent) of the amounts applied. About 40 percent of the
atrazine mass and more than 50 percent of the mass of many other
heavily used pesticides discharged to the Gulf of Mexico originate in
the Upper Mississippi River Basin, above the confluence with the
Missouri River. This area constitutes only about 22 percent of the
drainage area of the Mississippi River Basin. Varying climatic
conditions cause considerable variation in the maximum annual
pesticide concentrations and in the annual loads. Wet years with
intense rainfall shortly after application of pesticides tend to have
the highest pesticide concentrations in streams and the highest
loads.
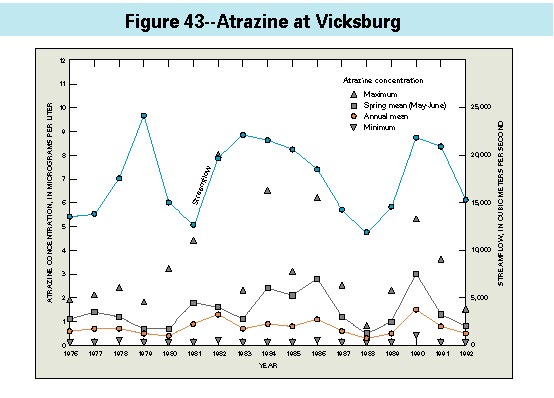
Atrazine at Vicksburg
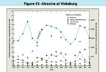
(Click on image for a larger version, 50K)
Figure 43. -- Long-term records on atrazine
concentrations in the Lower Mississippi River at Vicksburg,
Mississippi, are shown in this figure. Concentration data for
1976--90 were collected by Ciba Geigy (the manufacturer of atrazine),
its contractors, and other chemical companies, and are based on 11--51
samples per year (Tierney, 1992). Concentration data for 1991--92 are
those shown in figures 41 and 42 for the station at Baton Rouge (Coupe
and others, 1995). Mean annual streamflows are those measured in the
Mississippi River at Vicksburg, Mississippi. The minimum, mean, and
maximum values of atrazine concentration show no apparent upward or
downward trends during the 17 years portrayed here, but after the
mid-1980s the mean and maximum concentrations do tend to parallel the
year-to-year increases and decreases of streamflow.
Atrazine Along the River
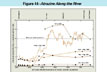
(Click on image for a larger version, 50K)
Figure 44. -- Atrazine concentrations in the Mississippi
River are consistently low for the first 600 kilometers below Minneapolis,
and they increase rapidly downriver as the river collects water from
tributaries that drain the Corn Belt. Shown here are measurements of
atrazine in waters collected from the Mississippi River during five
different sampling trips: the discrete points connected by straight-line
segments represent samples collected in downstream sequences; the
continuous line labeled June-July 1991 represents samples collected from
the river, at 10-mile intervals, in upriver sequence. Highest
concentrations were measured during the months immediately following the
application of atrazine (June 1990, June-July 1991). Details are best
shown in the data of June-July 1991, which represent the most intensive
sampling: a doubling of atrazine concentrations between river kilometers
2250 and 2000, where the Rock, Cedar, and Des Moines Rivers deliver
pesticides, including atrazine, from northern Iowa and Illinois; another
significant increase below river kilometer 1900 as a result of inflows from
the Illinois and Missouri Rivers; a decrease near kilometer 1530 where the
Mississippi is diluted by inflow from the Ohio River. The variability in
atrazine concentration between river kilometer 1530 and Baton Rouge
probably results from short-term storm runoff pulses entering the
Mississippi from the Missouri River and other major tributaries (Moody and
Goolsby, 1993). These runoff pulses have high concentrations of pesticides
and can produce water masses in the Mississippi River that are interspersed
with water containing lower concentrations. This is analogous to turning
on a point source of pesticide for a few days and then turning it off.
This kind of spatial variability was also observed during another upriver
transect (not shown in the figure) made in late May 1990, and to a lesser
extent in upriver transects conducted in late September 1991 and late March
1992. Details of procedures for collecting and analyzing the samples and
complete listings of the data represented in the figure are given by
Goolsby (1995) and Pereira and others (1995).
Herbicide Transports

(Click on image for a larger version, 99K)
Figure 45. -- The four pesticides (all herbicides)
transported in the largest quantities by the Mississippi River are atrazine
(plus two of its metabolites, desethylatrazine and desisopropylatrazine),
cyanazine, metolachlor, and alachlor.
- A
-
The loads of these four herbicides discharged to the Gulf of Mexico during
the 1-year period from April 1, 1991, through March 31, 1992, ranged from
365,700 kg for atrazine and its metabolites to 33,700 kg for alachlor.
This was a period of slightly greater than average streamflow, so these
figures might represent herbicide transports somewhat greater than average.
Most of the herbicides discharged into the Mississippi River originate in
the Upper Mississippi, Missouri, and Ohio River Basins. Except for
atrazine, there appear to be no significant inputs of most herbicides
between the Ohio River confluence and Baton Rouge, a distance of about
1,160 river kilometers. This distance represents a traveltime in the river
of about 10 days. The annual alachlor load in this reach decreased from
47,900 kg below the Ohio River confluence to 33,700 kg at Baton Rouge, a
decrease of about 30 percent. This decrease is believed to be due
primarily to degradation (and, possibly, volatilization) of alachlor in the
Mississippi River.
- B
-
Temporal distributions of the rates at which the four major herbicides were
transported by the Mississippi River to the Gulf of Mexico have been
calculated here from the data on streamflow and concentrations, much of
which was shown earlier in figure 42. For complete data, see Coupe and
others (1995). Most of the herbicide transport during this period of study
occurred during May and June, shortly after herbicide application. Maximum
transport rates were about 6,500 kg per day for atrazine and two of its
metabolites, about 3,000 kg per day for metolachlor, about 2,000 kg per day
for cyanazine, and about 700 kg per day for alachlor. Other herbicides
were transported at much lower rates. The rates of transport and total
masses of these four herbicides transported were considerably lower in 1992
than in 1991, probably as the result of less intense rainfall and less
flushing of herbicides from cropland in 1992.
REFERENCES
- Aspelin, A.L., Grube, A.H., and Toria, R., 1992,
- Pesticide industry
sales and usage, 1990 and 1991 market estimates: Washington, D.C.,
U.S. Environmental Protection Agency, 37 p.
- Becker, R.L., Herzfeld, D., Ostlie, K.R., and Stamm-Katovich, E.J.,
1989,
- Pesticides: Surface runoff, leaching, and exposure concerns:
University of Minnesota, Minnesota Extension Service AG-BU-3911, 32
p.
- Coupe, R.H., Goolsby, D.A., Iverson, J.L., Markovchick, D.J., and
Zaugg, S.D., 1995,
- Pesticide, nutrient, water-discharge, and
physical-property data for the Mississippi River and some of its
tributaries, April 1991-September 1992: U.S. Geological Survey
Open-File Report 93-657, 116 p.
- Gianessi, L.P., and Puffer, C.M., 1990,
- Herbicide use in the United
States: Resources for the Future, 127 p. [Revised 1991].
- Goolsby, D.A., 1995,
- Dissolved herbicides, in Moody, J.A.,
ed., Chemical data for water samples collected during four upriver
cruises on the Mississippi River between New Orleans, Louisiana, and
Minneapolis, Minnesota, May 1990-April 1992: U.S. Geological Survey
Open-File Report 94-523, p. 19--87.
- Goolsby, D.A., and Battaglin, W.A., 1993,
- Occurrence, distribution and
transport of agricultural chemicals in surface waters of the
Midwestern United States, in Goolsby, D.A., Boyer, L.L., and
Mallard, G.E., eds., Selected papers on agricultural chemicals in
water resources of the Midcontinental United States: U.S. Geological
Survey Open-File Report 93-418, p. 1--25.
- Goolsby, D.A., Coupe, R.H., and Markovchick, D.J., 1991,
- Distribution
of selected herbicides and nitrate in the Mississippi River and its
major tributaries, April through June 1991: U.S. Geological Survey
Water-Resources Investigations Report 91-4163, 35 p.
- Kent, R.A., Pauli, B.D., Trotter, D.M., and Gareau, J., 1991,
- Canadian
water quality guidelines for metolachlor: Ottawa, Environment Canada
Scientific Series no. 184, 34 p.
- Kent, R.A., Taché, P.-Y., and Pauli, B.D., 1992,
- Canadian water
quality guidelines for trifluralin: Ottawa, Environment Canada
Scientific Series no. 190, 92 p.
- Moody, J.A., and Goolsby, D.A., 1993,
- Spatial variation of triazine
herbicide concentrations in the lower Mississippi River: Environmental
Science and Technology, v. 27, no.10, p. 2120--2126.
- Moore, J.W., and Ramamoorthy, S., 1984,
- Organic chemicals in natural
waters---Applied monitoring and impact assessment: New York,
Springer-Verlag, 289 p.
- Nations, B.K., and Hallberg, G.R., 1992,
- Pesticides in Iowa
precipitation: Journal of Environmental Quality, v. 21,
p. 486--492.
- Pauli, B.D., Kent, R.A., and Wong, M.P., 1990,
- Canadian water quality
guidelines for metribuzin: Ottawa, Environment Canada Scientific
Series no. 179, 44 p.
- ___ 1991a,
- Canadian water quality guidelines for cyanazine: Ottawa,
Environment Canada Scientific Series no. 180, 26 p.
- ___ 1991b,
- Canadian water quality guidelines for simazine: Ottawa,
Environment Canada Scientific Series no. 187, 29 p.
- Pereira, W.E., and Hostettler, F.D., 1993,
- Nonpoint source
contamination of the Mississippi River and its tributaries by
herbicides: Environmental Science and Technology, v. 27, no. 8,
p. 1542--1552.
- Pereira, W.E., Moody, J.A., Hostettler, F.D., Rostad, C.E., and
Leiker, T.J., 1995,
- Concentrations and mass transport of pesticides
and organic contaminants in the Mississippi River and some of its
tributaries, 1987--89 and 1991--92: U.S. Geological Survey Open-File
Report 94-376, 169 p.
- Pereira, W.E., and Rostad, C.E., 1990,
- Occurrence, distribution, and
transport of herbicides and their degradation products in the lower
Mississippi River and its tributaries: Environmental Science and
Technology, v. 24, p. 1400--1406.
- Task Force on Water Quality Guidelines, undated,
- Canadian Water
Quality Guidelines, Chapter 3, Freshwater aquatic life: Ottawa,
Environment Canada, chap. 3, p. 36.
- Thurman, E.M., Goolsby, D.A., Meyer, M.T., and Kolpin, D.W., 1992,
- A
reconnaissance study of herbicides and their metabolites in surface
water of the Midwestern United States using immunoassay and gas
chromatography/mass spectrometry: Environmental Science and
Technology, v. 26, no. 12, p. 2440--2447.
- Tierney, D.P., 1992,
- A review of historical surface water monitoring
for atrazine in the Mississippi, Missouri, and Ohio Rivers,
1975--1991: Greensboro, N.C., Ciba Geigy Corporation. Technical Report
6-92, 69 p.
- Trotter, D.M., Baril, A., Wong, M.P., and Kent, R.A., 1990,
- Canadian
water quality guidelines for atrazine: Ottawa, Environment Canada
Scientific Series no. 168, 106 p.
- Trotter, D.M., Kent, R.A., and Wong, M.P., 1989,
- Canadian water
quality guidelines for carbofuran: Ottawa, Environment Canada
Scientific Series no. 169, 34 p.
- U.S. Department of Agriculture, 1985,
- Agricultural statistics:
Washington, D.C., U.S. Government Printing Office, 551 p.
- ___ 1992,
- Agricultural resources---Inputs situation and outlook:
Economic Research Service publication AR-25, February 1992, 66 p.
- U.S. Department of Commerce, 1989,
- Census of agriculture data, final
county file (machine readable data): Washington, D.C., Bureau of the
Census.
- U.S. Environmental Protection Agency, 1995,
- Drinking water regulations
and health advisories: U.S. Environmental Protection Agency, Office of
Water, 11 p.
- Wong, M.P., and Kent, R.A., 1988,
- Developing Canadian water quality
pesticide guidelines for the protection of aquatic life: Water
Pollution Control Research Journal of Canada, v. 23, no. 4,
p. 500--509.
Continue to '
Polychlorinated Biphenyls and other Synthetic Organic Contaminants
Associated with Sediments and Fish in the Mississippi River
', or return to '
Contents
'
Contaminants in the Mississippi River
U.S. GEOLOGICAL SURVEY CIRCULAR 1133
Reston, Virginia, 1995
Edited by Robert H. Meade
http://water.er.usgs.gov/pubs/circ1133/pesticides.html
Maintainer:
h2o Webserver Team
Last Modified: 1230 01 Oct 96 ghc