 |
Estimated Use of Water in the United States in 2000
This section has been revised since its initial release.
Domestic
Domestic water use is water used for indoor and outdoor household purposes. Common indoor uses include drinking, preparing food, bathing, washing clothes and dishes, and flushing toilets. The major outdoor uses are watering lawns and gardens. Water for domestic use may be delivered from a public supplier or be self-supplied. In this report, domestic use refers to self-supplied withdrawals only. For self-supplied domestic water, the source usually is a well. All self-supplied domestic withdrawals were considered freshwater. Self-supplied domestic population was defined as the difference between the total population for 2000, as determined by the U.S. Census Bureau, and the population served by public suppliers. Public-supply deliveries to domestic users and consumptive use were not reported for 2000.
Self-supplied domestic withdrawals and population are listed by State in table 6. ![]() For 2000, withdrawals were an estimated 3,590 Mgal/d or 4,030 thousand acre-feet per year. Self-supplied domestic withdrawals were about 1 percent of total freshwater withdrawals and about 2 percent of total freshwater withdrawals for all categories excluding thermoelectric power. About 43.5 million people were self-supplied. Ground water was the primary source of the water (98 percent). Between 1995 and 2000, self-supplied domestic withdrawals increased about 6 percent and the self-supplied domestic population increased about 2 percent. However, the self-supplied domestic population was 15 percent of the total U.S. population.
For 2000, withdrawals were an estimated 3,590 Mgal/d or 4,030 thousand acre-feet per year. Self-supplied domestic withdrawals were about 1 percent of total freshwater withdrawals and about 2 percent of total freshwater withdrawals for all categories excluding thermoelectric power. About 43.5 million people were self-supplied. Ground water was the primary source of the water (98 percent). Between 1995 and 2000, self-supplied domestic withdrawals increased about 6 percent and the self-supplied domestic population increased about 2 percent. However, the self-supplied domestic population was 15 percent of the total U.S. population.
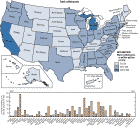
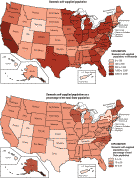
The geographic distribution of total withdrawals for self-supplied domestic use, self-supplied domestic population, and self-supplied domestic population as a percentage of the State total population is shown in figures 6a and 6b, respectively.
 The largest self-supplied domestic withdrawals and self-supplied populations were in California and Michigan. These two States represented 15 percent of the total self-supplied domestic withdrawals and 15 percent of the total self-supplied domestic population. Some States, such as the U.S. Virgin Islands, Maine, and Vermont, had large percentages of the total State population that were self-supplied.
Self-supplied domestic withdrawals are rarely measured or reported.
 Therefore, self-supplied domestic withdrawals were estimated using self-supplied domestic population and per capita use coefficients. Coefficients varied from one geographic region to another. Domestic per capita use coefficients were either derived using public-supply delivery data for domestic use, or were obtained from a State agency, a planning or research organization, or were obtained from published values in the technical literature.
Water Use in the United States | USGS Water Resources of the United States
For more information: wu-info@usgs.gov