Index of Subjects |
Supply and Use of Earth Resources
 (Larger Version, 116K GIF) |
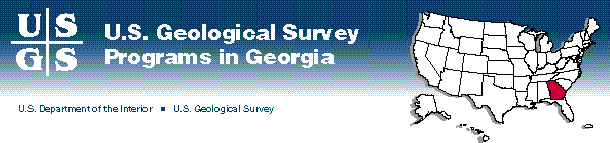
| Figure 1. Area of use of principal aquifers and generalized diagram showing aquifers and physiographic provinces in Georgia. |
 (Larger Version, 165K GIF) |
| Figure 2. Average annual discharge of major streams in Georgia. |
Basic water-resources data collected by the USGS provide information that is essential to water-resources management. The USGS operates and collects data at 134 continuous-record and 102 partial-record streamflow-gaging stations, 18 reservoir stage and contents gaging stations, about 170 continuous-record observation wells, and numerous miscellaneous sites. These data provide information that is used daily by managers to make decisions that concern water supply, flood control, hydroelectric power, irrigation, bridge design, wildlife management, and pollution abatement. Water-resource management also requires information on the use of water for public supplies, irrigation, industry, and power generation. Water use during 1990, excluding use for thermoelectric power generation, was 2,290 million gallons per day (fig. 3).
 (Larger Version, 83K GIF) |
| Figure 3. Water use in Georgia, by county, 1990. |
Water Limitations in the Apalachicola-Chattahoochee-Flint River Basin
During the period from 1970 to 1990, water used for public supply in the Apalachicola-Chattahoochee-Flint River Basin, which includes the Metropolitan Atlanta area, more than tripled to almost 460 million gallons per day. Severe droughts and increased development in the area have resulted in shortages and restrictions on limited surface-water supplies. In northern Georgia, ground water has not been a major source of supply because of its sporadic occurrence in the crystalline rocks of the Piedmont Physiographic Province (fig. 1). The USGS is using state-of-the-science geologic and geophysical techniques to address the feasibility of using ground water as a supplemental source of supply in this region. The USGS also is evaluating how changes in surface- and ground-water withdrawals affect regional water availability, and areas where ground-water resources are overused or underused. Preliminary results for the lower part of the Basin indicate that pumping increases in the Basin could cause a reduction in ground-water discharge to streams and result in reduced flow to Apalachicola Bay, especially during droughts.
Geology and Geohydrology of Northern Georgia
Quality of Water Resources
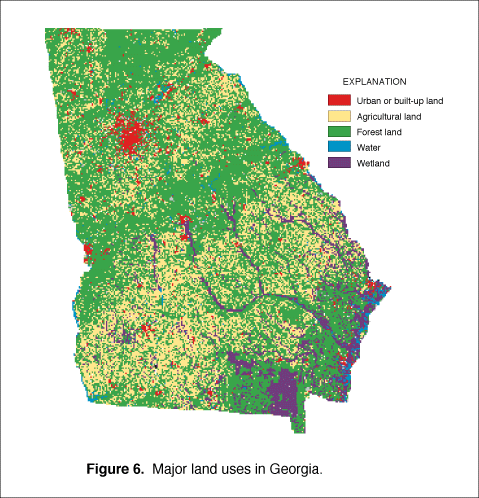
The quality of water is vital to support society's needs and to sustain rich and diverse ecosystems in Georgia. The USGS is studying the effects of land use on the physical, chemical, and biological quality of water. Recent studies have focused on water-quality effects of point- and nonpoint-sources of pollutants from urban watersheds, and nonpoint-sources from agricultural and forested (managed for silviculture) watersheds (fig. 6, on back page).
Phosphorus in the Upper Chattahoochee River
The annual phosphorus load at monitoring sites on the Chattahoochee River upstream and downstream from Atlanta from 1980 to 1993 is shown in figure 4. The difference between the two curves shown on the graph indicates the effect of point and nonpoint sources from Atlanta on the phosphorus load in the River. Reductions in point-source phosphorus loads have been documented, and phosphorus loads in the river downstream from Atlanta declined by about 54 percent from 1988 to 1993. However, phosphorus loads discharged to the Chattahoochee River from Atlanta wastewater-treatment facilities in 1996 remained higher than legislated maximum levels.
 (Larger Version, 83K GIF) |
| Figure 4. Phosphorus loads in the Chattahoochee River upstream and downstream from Atlanta, 1980 to 1993. |
Pesticides From Urban and Agricultural Sources
Agricultural land uses (fig. 6, on back page) often are assumed to be the primary source of pesticides in the environment. Water samples collected weekly from March 1993 through April 1994 from streams that drain urban and agricultural watersheds were analyzed for many commonly used pesticides. Twenty-four herbicides and eight insecticides were detected in water samples. Preliminary findings indicate that more pesticides are present in water from urban watersheds, generally at higher concentrations and for a greater part of the year, than in water from agricultural watersheds. In general, the trace concentrations of pesticides detected do not exceed U.S. Environmental Protection Agency (USEPA) drinking-water standards for human health. However, concentrations of several insecticides detected in urban watersheds exceed guidelines for the protection of aquatic life.
Fish Communities in Urban Streams
Because aquatic organisms respond directly to the quality of the water they inhabit, they are useful indicators of the cumulative effects of water quality. The USGS surveyed fish communities in Chattahoochee River tributaries and compared streams that receive runoff from the Metropolitan Atlanta area with a stream in a forested basin. In general, the urban basins had fewer than one-half the number of fish in the forested basins, and about 90 percent of the fish in urban basin were nonnative species. Fish that live in urban streams generally are tolerant of a wide range of water-quality conditions, and after such mishaps as chemical or sewage spills that decrease fish populations, these fish types are opportunistic and can repopulate urban streams rapidly.
Water Quality During Tropical Storm Alberto
 (Larger Version, 116K GIF) |
| Figure 5. Herbicide concentrations and discharge in the Flint River at Newton. |
 (Larger Version, 165K GIF) |
| Figure 6. Major land uses in Georgia. |
Water Quality in a Major Aquifer
The Floridan aquifer system is one of the most productive in the United States and is the source of water supply for the city of Valdosta and much of the surrounding area in southeastern Georgia. Water quality in the Upper Floridan aquifer is affected by direct recharge from Withlacoochee River water (fig. 2) through sinkholes in and near the streambed north of Valdosta. The river water contains naturally occurring organic matter and receives little filtration as it recharges the aquifer, which results in high concentrations of organic carbon, hydrogen sulfide, and methane in ground water downgradient from the recharge area. The USGS measured and characterized water quality in the Upper Floridan aquifer. Concentrations of naturally occurring constituents in ground water from several locations were used to trace the movement of recharge water in the Upper Floridan aquifer. Findings from this investigation were used by water-resource managers and planners to assess the contamination potential of the aquifer by recharge from the Withlacoochee River and to delineate areas suitable for new public water-supply wells.
Natural Hazards
Natural hazards cause losses that average about $52 billion per year in the United States. In Georgia, the USGS provides information on natural hazards, which include floods, droughts, earthquakes, sinkholes, and coastal storm surges.
Flood Hazards
In July 1994, parts of central and southwestern Georgia in the Flint and the Ocmulgee River Basins were inundated by floods that resulted from as much as 28 inches of rainfall produced by Tropical Storm Alberto. The floods caused 33 deaths and property damage estimated to be nearly $1 billion as highways, water systems, crops, and homes were inundated. Damage from such a severe flood cannot be averted completely, but with reliable estimates of river stages and discharge, communities can be warned of impending danger. The USGS operates data transmitters at 56 of its continuous stage-monitoring stations Statewide. Fifteen of these stations in the affected basins provided near-realtime tracking of flood conditions during Tropical Storm Alberto. Personnel of the USGS worked throughout the flood to maintain stream gages, to measure peak-flow rates and flood-elevation profiles, and to provide critical information to emergency management personnel and the public.
Geologic Hazards
Earth-Resources Information
Hydrologic and Geologic Information
which describes hydrologic conditions, current investigations, and the availability of other information products.
Biological Resources Information
The USGS Biological Resources Division (formerly the National Biological Service) provides information to improve the understanding of priority species, fisheries, songbirds, and forests in Georgia. At the request of Federal and State agencies, scientists conduct investigations of forest and aquatic habitats and species in Georgia. For example, scientists are studying the effects of pine timberland management on habitats required by migratory birds and woodpeckers. The USGS has provided essential information for management of important game fish such as the striped bass. Other investigations are assessing the effects of streamflow regulation on the spawning and foraging habitats necessary to sustain diverse fish populations.
Mapping the Earth
The USGS also provides extensive,digital-mapping data that are widely used in geographic information system (GIS) data bases. The USGS National Geospatial Data Clearinghouse WWW site
distributes a variety of aerial photographs and satellite-image data products that cover the entire State. The Center for Spatial Analysis Technology, which is a joint research effort of the USGS, the Georgia Environmental Protection Division, and the Georgia Institute of Technology, performs GIS analysis and research.