The following procedures and suggestions supplement those given in the Techniques of Water-Resources Investigations (TWRI) on Low-Flow Investigations. Some of these are items that should have been in the TWRI, some are based on subsequent work, and some should make reports more useful. Adherence to these guidelines should produce efficiency in defining low-flow characteristics and promptness in furnishing this information to the public.
Frequency curves for sites with 10 or more years of daily-flow record may be obtained by using computer program A- 969 (see WATSTORE, vol. 1, chapt. 4, sec. 6). Ordinarily, the fitted log Pearson III frequency curve should be used, but if that curve fails to fit the data at the lower end, a graphical interpretation should be made on the computer printout. The graphical curve should be considered the basic frequency curve for low flows (see bottom of page 5, TWRI).
It may be desirable to provide seasonal low-flow frequency curves or curves for a year other than the climatic year (beginning April 1) for some uses and regions.
Low-flow frequency curves prepared for gaged streams affected by regulation or diversion should be based on the longest period of homogeneous record under present conditions. Characteristics taken from these frequency curves should be qualified as being applicable only as long as the existing pattern of regulation and/or diversion exists. A trend analysis might help to identify the homogeneous period of record of regulated streams and of streams in the areas where continued ground water withdrawals have gradually lowered water tables.
Extension of low-flow frequency curves to large recurrence intervals generally should be drawn or checked graphically. The low-discharge end of a mathematically fitted frequency curve with a positive skew will be affected by the data points having recurrence intervals of less than 2 years, but the shape of the low-discharge part of a low-flow frequency curve depends on ground-water contributions and on evapotranspiration, and may be unrelated to the shape of the upper part, which is affected by additional factors. In other words, annual low flows at a site do not necessarily belong to a single population. Low-flow characteristics at large recurrence intervals are less reliable than others, not only because of extrapolation, but also because these low flows are more likely to be affected by man's activities.
A recommended procedure for estimating low-flow characteristics at partial-record stations is given in the TWRI. Six to ten base-flow measurements, made in various recessions over a 2-year period, usually are adequate to define the relation with concurrent flows at the index station. One or two of these measurements should be at high-base flow to better define the slope of the relation. Accuracy of this method is discussed in a later section.
Measurement at a partial-record station for more than 2 years usually is not justified; additional measurements are unlikely to improve the relation appreciably. Additional effort will be more productive if applied to other ungaged sites.
Estimates at partial-record stations ordinarily should be limited to 7Q2 and 7Q,O; estimation of the whole frequency curve is discouraged because that practice tends to imply an accuracy that is not warranted. Estimates of low-flow characteristics for long periods of consecutive days (those periods which usually include substantial storm runoff) are not commonly made, because the suitability of the base-flow relation as a transfer mechanism for such characteristics has not been demonstrated.
The partial-record method ordinarily should be used at regular gaging stations having records of less than about 10 years. See pages 8 to 10, TWRI , for justification.
At sites where only one base-flow measurement is available, 7Q2 or 7Q,o may be estimated. Various methods may be employed depending on other available data. See page 11, TWRI, for one. Another is the assumption that the ratios of low-flow characteristics at two sites are the same as the ratios of concurrent base flows; this assumption should not be made blindly.
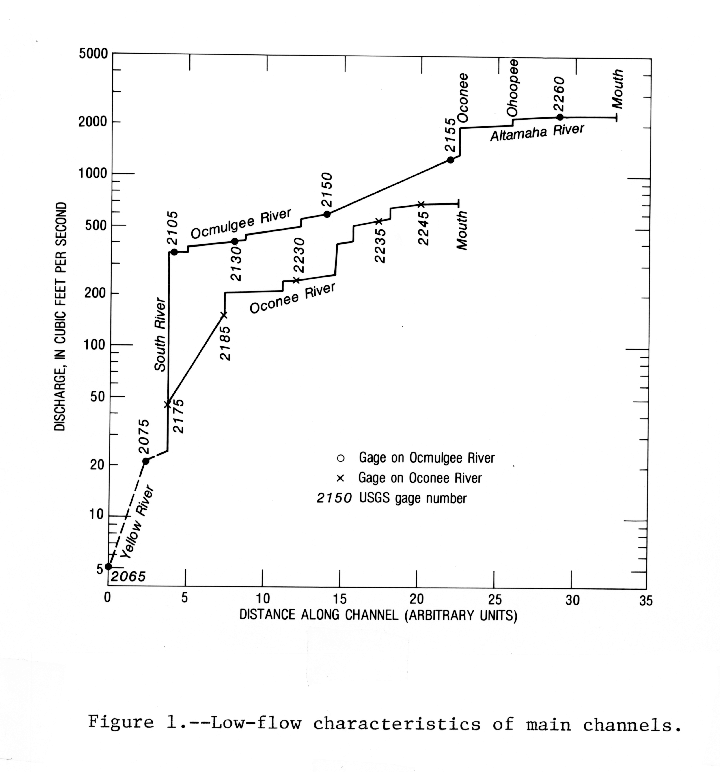
Interpolation between gaged points on a stream is best accomplished by plotting each low-flow characteristic against distance along the channel, and using available tributary low-flow characteristics to interpret the characteristic at any point on the channel. See figure 1, which is based on information published in WRI 77-127. A plot of flow against drainage area is undesirable, because it is not continuous at tributaries, and its use requires measuring drainage area at each site of interest.
A low-flow report may include regressions of low-flow characteristics on basin characteristics, and/or other methods of estimating low-flow characteristics at ungaged sites. Such methods should be presented for use when the information is needed before base-flow measurements can be obtained at the site.
Definition.--The 7-day 10-year low flow (7Q,O) is the discharge at 10-year recurrence interval taken from a frequency curve of annual values of the lowest mean discharge for 7 consecutive days (the 7-day low flow).
Interpretation.--The 7-day low flow will be less than the 7-day 10-year low flow at intervals averaging 10 years in length; or the probability is 1/10 that the 7-day low flow in any one year will be less than the 7-day 10- year low
flow.Low-flow frequency characteristics are misinterpreted in many published WRD reports.
Recommendation 8 of Langbein's Committee on Credibility of Data says:
"All published reports should contain assessment of errors inherent in the technique, the data, and in the computed results. Separate reports might be prepared from time to time on the question of errors inherent in the data and in the findings. Those would be especially useful as reference material for data compilations."
A low-flow report should include some statements about accuracy of results, even though it is not possible to assess that accuracy closely. On the other hand, the report should not put an accuracy value on each estimate. One can lose credibility by making unwarranted claims about the ability to estimate accuracy as well as by ignoring accuracy.
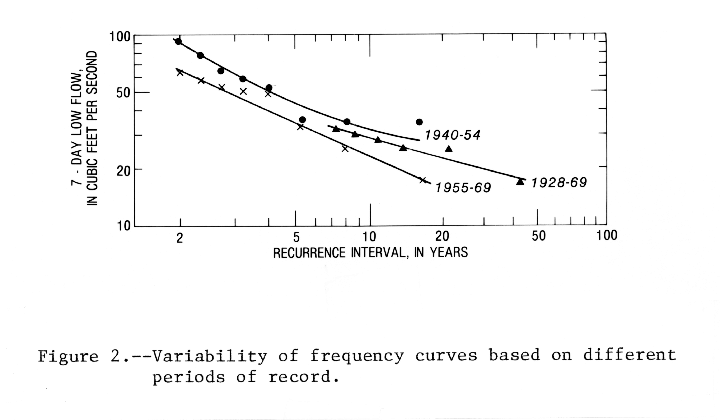
The reliability of 7Q10 (or some other characteristic) from a gagingstation record generally increases with the length of record but the inclusion or exclusion of a significant drought may be a dominant factor. The general relation for estimating the reliability of a point on a frequency curve, in terms of years of record and variability, assumes that the data are completely random. This assumption is not fully acceptable for low flows; a succession of highs or lows is common. Thus, the purely statistical estimate of reliability of a frequency curve is weak. An indication of reliability is given by the length and the period of record used. See figure 2 for the variability of the frequency curve for different periods of record (the minimum occurred in 1955).
The accuracy of an estimate at a partial-record site depends principally on: (1) how well the base- flow relation is defined, (2) how far that relation has to be extrapolated, and (3) the reliability of the estimate at the index station. A method of computing the accuracy of an estimate is proposed in Water- Supply Paper 1542-B. Another method defines accuracy as the graphical estimate of the standard error of the base-flow relation. A general statement about accuracy of estimates at partial-record sites could be based on an empirical test such as is described below.
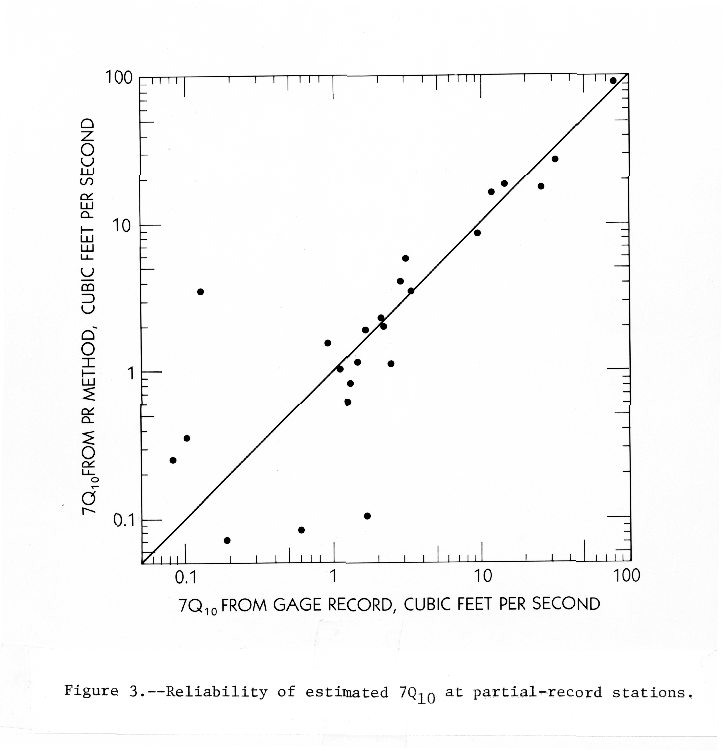
Pairs of gaging stations on different nearby streams were selected. Each stream had a published 7Q10. One of each pair was designated the partialrecord station and the other the index station. Five base flows were selected from each of 2 consecutive years from the published records of the designated "partial-record" station. These 10 discharges were related to the concurrent daily discharges at the index station. The relation line was defined graphically without knowledge of 7Q10 at the sites. Then, the 7Q10 at the index station was transferred through the relation to estimate the 7Q10 at the "partial-record" station.
This procedure was used on 11 pairs in Pennsylvania, 6 in Indiana, 3 in Arkansas, 3 in South Carolina, and 1 in Missouri. The estimates are plotted against the 7Q10 taken from the frequency curve at the site in figure 3. Reliability of an estimate depends principally on how well the relation curve is defined,, and how far the relation needs to be extrapolated. The plot indicates that estimates based on good relations and small extrapolations should be within about 30 percent of that defined from the frequency curve, if the estimates are several second/feet or more. The six points that are farthest from the curve of figure 3 are based on long extrapolations of poorly defined relations. Much better results than these six would be obtained in some regions.
Accuracy of estimates made from a regression on basin characteristics is usually stated as the standard error of the regression. The standard error of prediction at an individual ungaged site is, of course, greater.
Accuracy should not be stated in equivalent years of record. The relation between standard error and equivalent years is non-linear, rather erratic, and highly variable areally. Equivalent years do not tell the user how accurate an estimate may be.
In reporting accuracy, one should remember that estimates given today may be updated in a few years on the basis of more data and/or improved analytical techniques.
The demand for low-flow information is growing rapidly. Districts are urged to analyze their low-flow data promptly and make it available to the public. Rather than wait until a complete and detailed report can be prepared, a brief report giving only the 7Q10 at gaged sites and partialrecord sites, and references to methods used, would be desirable.
Content of a more comprehensive report should be governed by the guidelines given above, the data available, and the needs for information. Only relevant information should be included. The user is primarily interested in results; a brief description of the analytical methods used, and brief statements of the accuracy of results and limits of application should be adequate.
The Water Resources Division should respond to the needs of cooperators and other Federal agencies. If time is available, get one or more base flow measurements and analyze. If the information is needed within a short time, one or more of the following may be used:
The estimate should be appropriately qualified. The estimate, the method of estimation, and the person to whom the estimate was given should be documented. The District should ensure that different estimates are not given out for the same site; except, of course, when the recent one is based on more information.


 Back to memo