PROVISIONAL DATA SUBJECT TO REVISION
Click to hidestation-specific text
Funding for this site is provided by:
 Site Information
LOCATION.--Lat 42°19'28.0", long
75°46'16.5" referenced to North American Datum of
1983, Chenango County, NY, Hydrologic Unit 02050102, on left
bank 0.3 mi downstream from bridge on State Highway 206 at
Greene, and 0.6 mi downstream from Birdsall Brook.
DRAINAGE AREA.--593 mi².
PERIOD OF RECORD.--February 1937 to September 1970, annual maximum only--1971-2009, October 2009 to current year.
REVISIONS HISTORY.--WDR NY-69-1: Drainage area. 1999 (M).
GAGE.--Water-stage recorder. Datum of gage is 892.58 ft above NGVD of 1929 (levels by Corps of Engineers) and 891.98 ft above NAVD of 1988.
REMARKS.--Slight diversion from upstream tributaries into Mohawk River basin for operation of Erie (Barge) Canal.
Water Years 2014-18: Records good except those for estimated daily discharges, which are fair. Water Years 2019-23: Records good except those for estimated daily discharges, which are poor.
EXTREMES FOR PERIOD OF RECORD.--Maximum discharge, 27,100 ft³/s, June 28, 2006, gage height, 21.16 ft; minimum discharge, 37 ft³/s, Sept. 20, 1939.
PERIOD OF DAILY RECORD1.-- WATER TEMPERATURE: May 2012 to September 2013. SPECIFIC CONDUCTANCE: May 2012 to September 2013.
INSTRUMENTATION1.--A YSI 600-LS continuous monitor with water temperature and specific conductance from May 2012 to September 2013 at 15-minute-interval readings.
EXTREMES FOR PERIOD OF DAILY RECORD1.--WATER TEMPERATURE: Maximum, 24.5°C, July 1, 2012; minimum, 0.0°C, on many days during winter period. SPECIFIC CONDUCTANCE: Maximum, 373 uS/cm @ 25°C, June 30, 2012; minimum, 105 uS/cm @ 25°C, Aug. 9, 2013.
1 Water-Quality Records
 WaterAlert – get an
email or text (SMS) alert based on your chosen threshold.
WaterAlert – get an
email or text (SMS) alert based on your chosen threshold.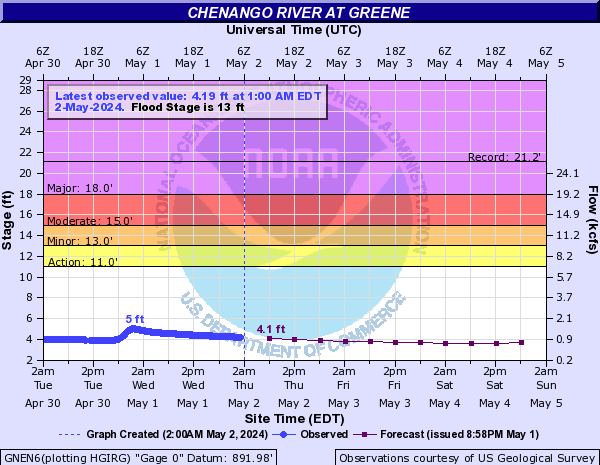
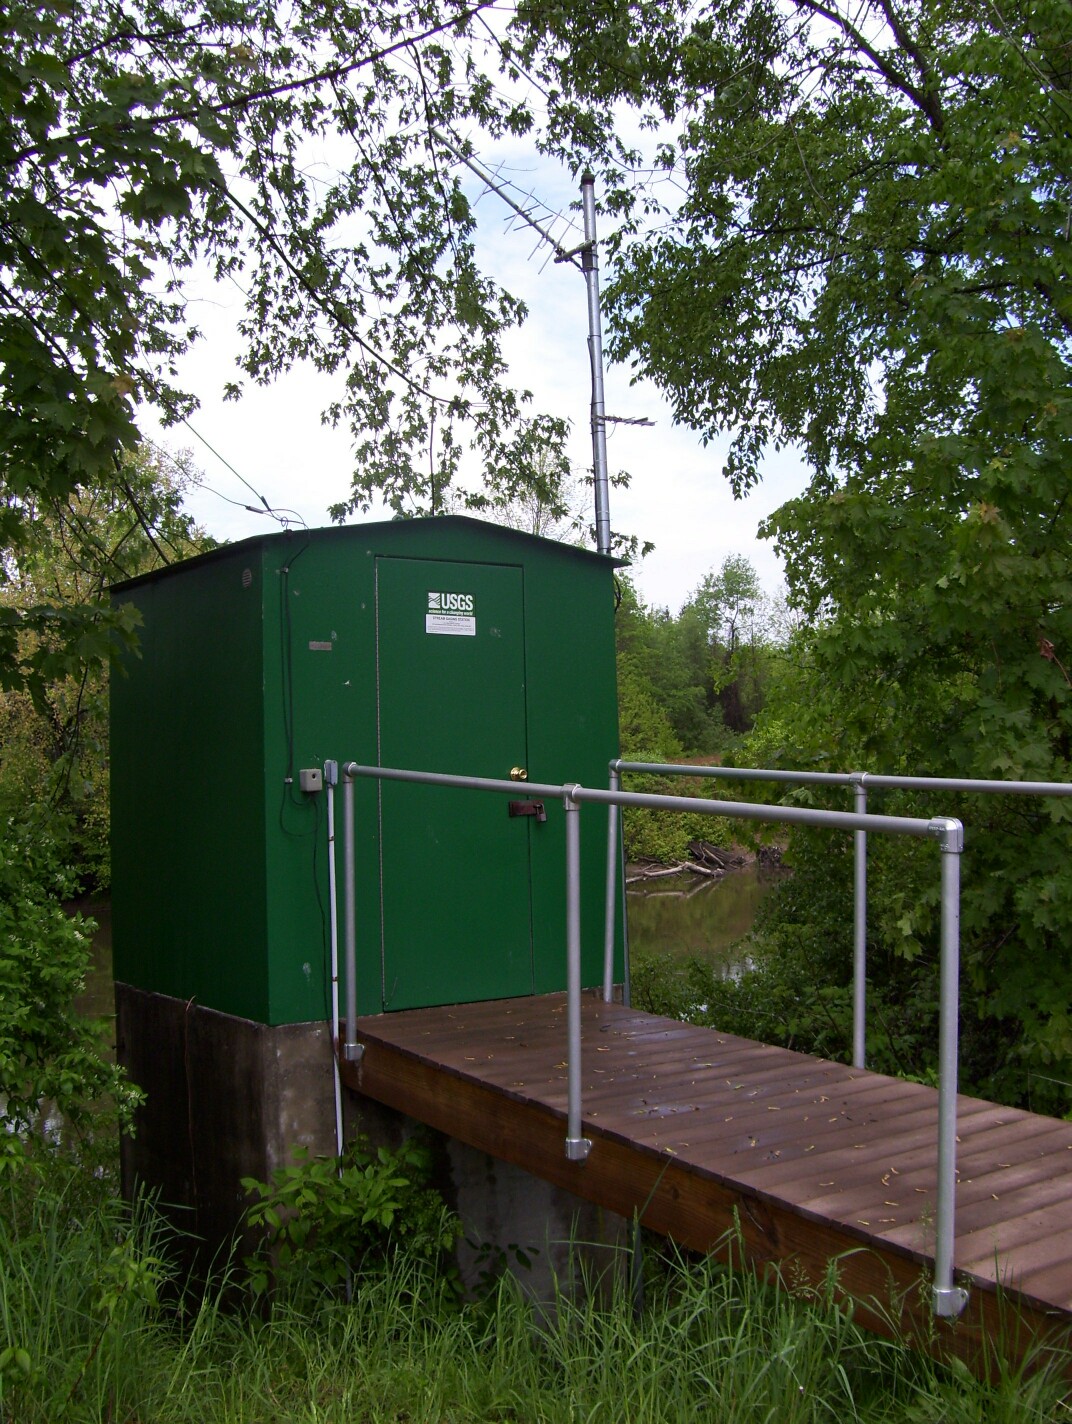 Station image
Summary of all available data for this site
Instantaneous-data availability statement

