PROVISIONAL DATA SUBJECT TO REVISION
Click to hidestation-specific text
Funding for this site is provided by:
 Site Information
LOCATION.--Lat 42°40'43", long
75°30'38" referenced to North American Datum of 1983,
Chenango County, NY, Hydrologic Unit 02050102, on right bank 20
ft downstream from bridge on State Highway 80, 0.5 mi west of
Sherburne, and 0.5 mi downstream from Handsome Brook.
DRAINAGE AREA.--263 mi².
PERIOD OF RECORD.--May 1938 to March 1995, annual maximum only--1996-2004, April 2004 to current year.
REVISIONS HISTORY.--WSP 851: 1938 (M). WSP 1502: 1955. WSP 2103: Drainage area.
GAGE.--Water-stage recorder. Datum of gage is 1,037.16 ft above NGVD of 1929 and 1,036.86 above NAVD of 1988. July 22 to Dec. 9, 1953, nonrecording gage, and Dec. 10, 1953 to Jan. 26, 1955, water-stage recorder, at temporary site 1.5 mi downstream at datum approximately 11.9 ft lower, during period of construction of highway bridge.
REMARKS.--Slight diversion from upstream tributaries into Mohawk River basin for operation of Erie (Barge) Canal.
Water Years 2014-15: Records good except those for estimated daily discharges, which are fair.
Water Years 2016-23: Records good except those for estimated daily discharges, which are poor.
EXTREMES FOR PERIOD OF RECORD.--Maximum discharge, 11,400 ft³/s, June 28, 2006, gage height, 11.35 ft; maximum gage height, 13.72 ft, Feb. 17, 1954, site and datum then in use; maximum gage height, 11.64 ft, Sept. 8, 2011, present site and datum; minimum discharge, 12 ft³/s, Sept. 25, 1964.
EXTREMES OUTSIDE PERIOD OF RECORD.--Flood of Mar. 18, 1936, reached a stage of 10.6 ft, present datum, discharge, about 12,500 ft³/s, from records of National Weather Service.
 WaterAlert – get an
email or text (SMS) alert based on your chosen threshold.
WaterAlert – get an
email or text (SMS) alert based on your chosen threshold.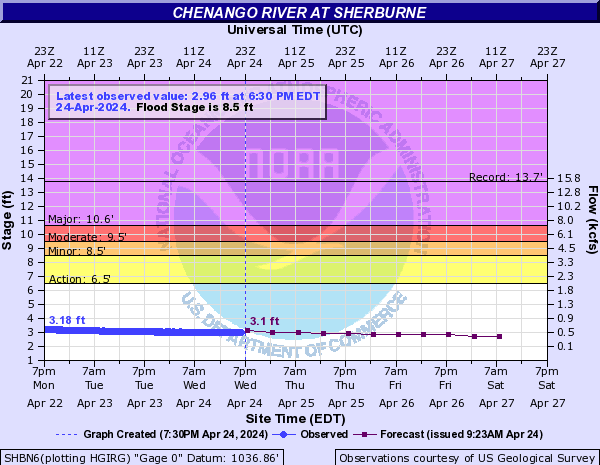
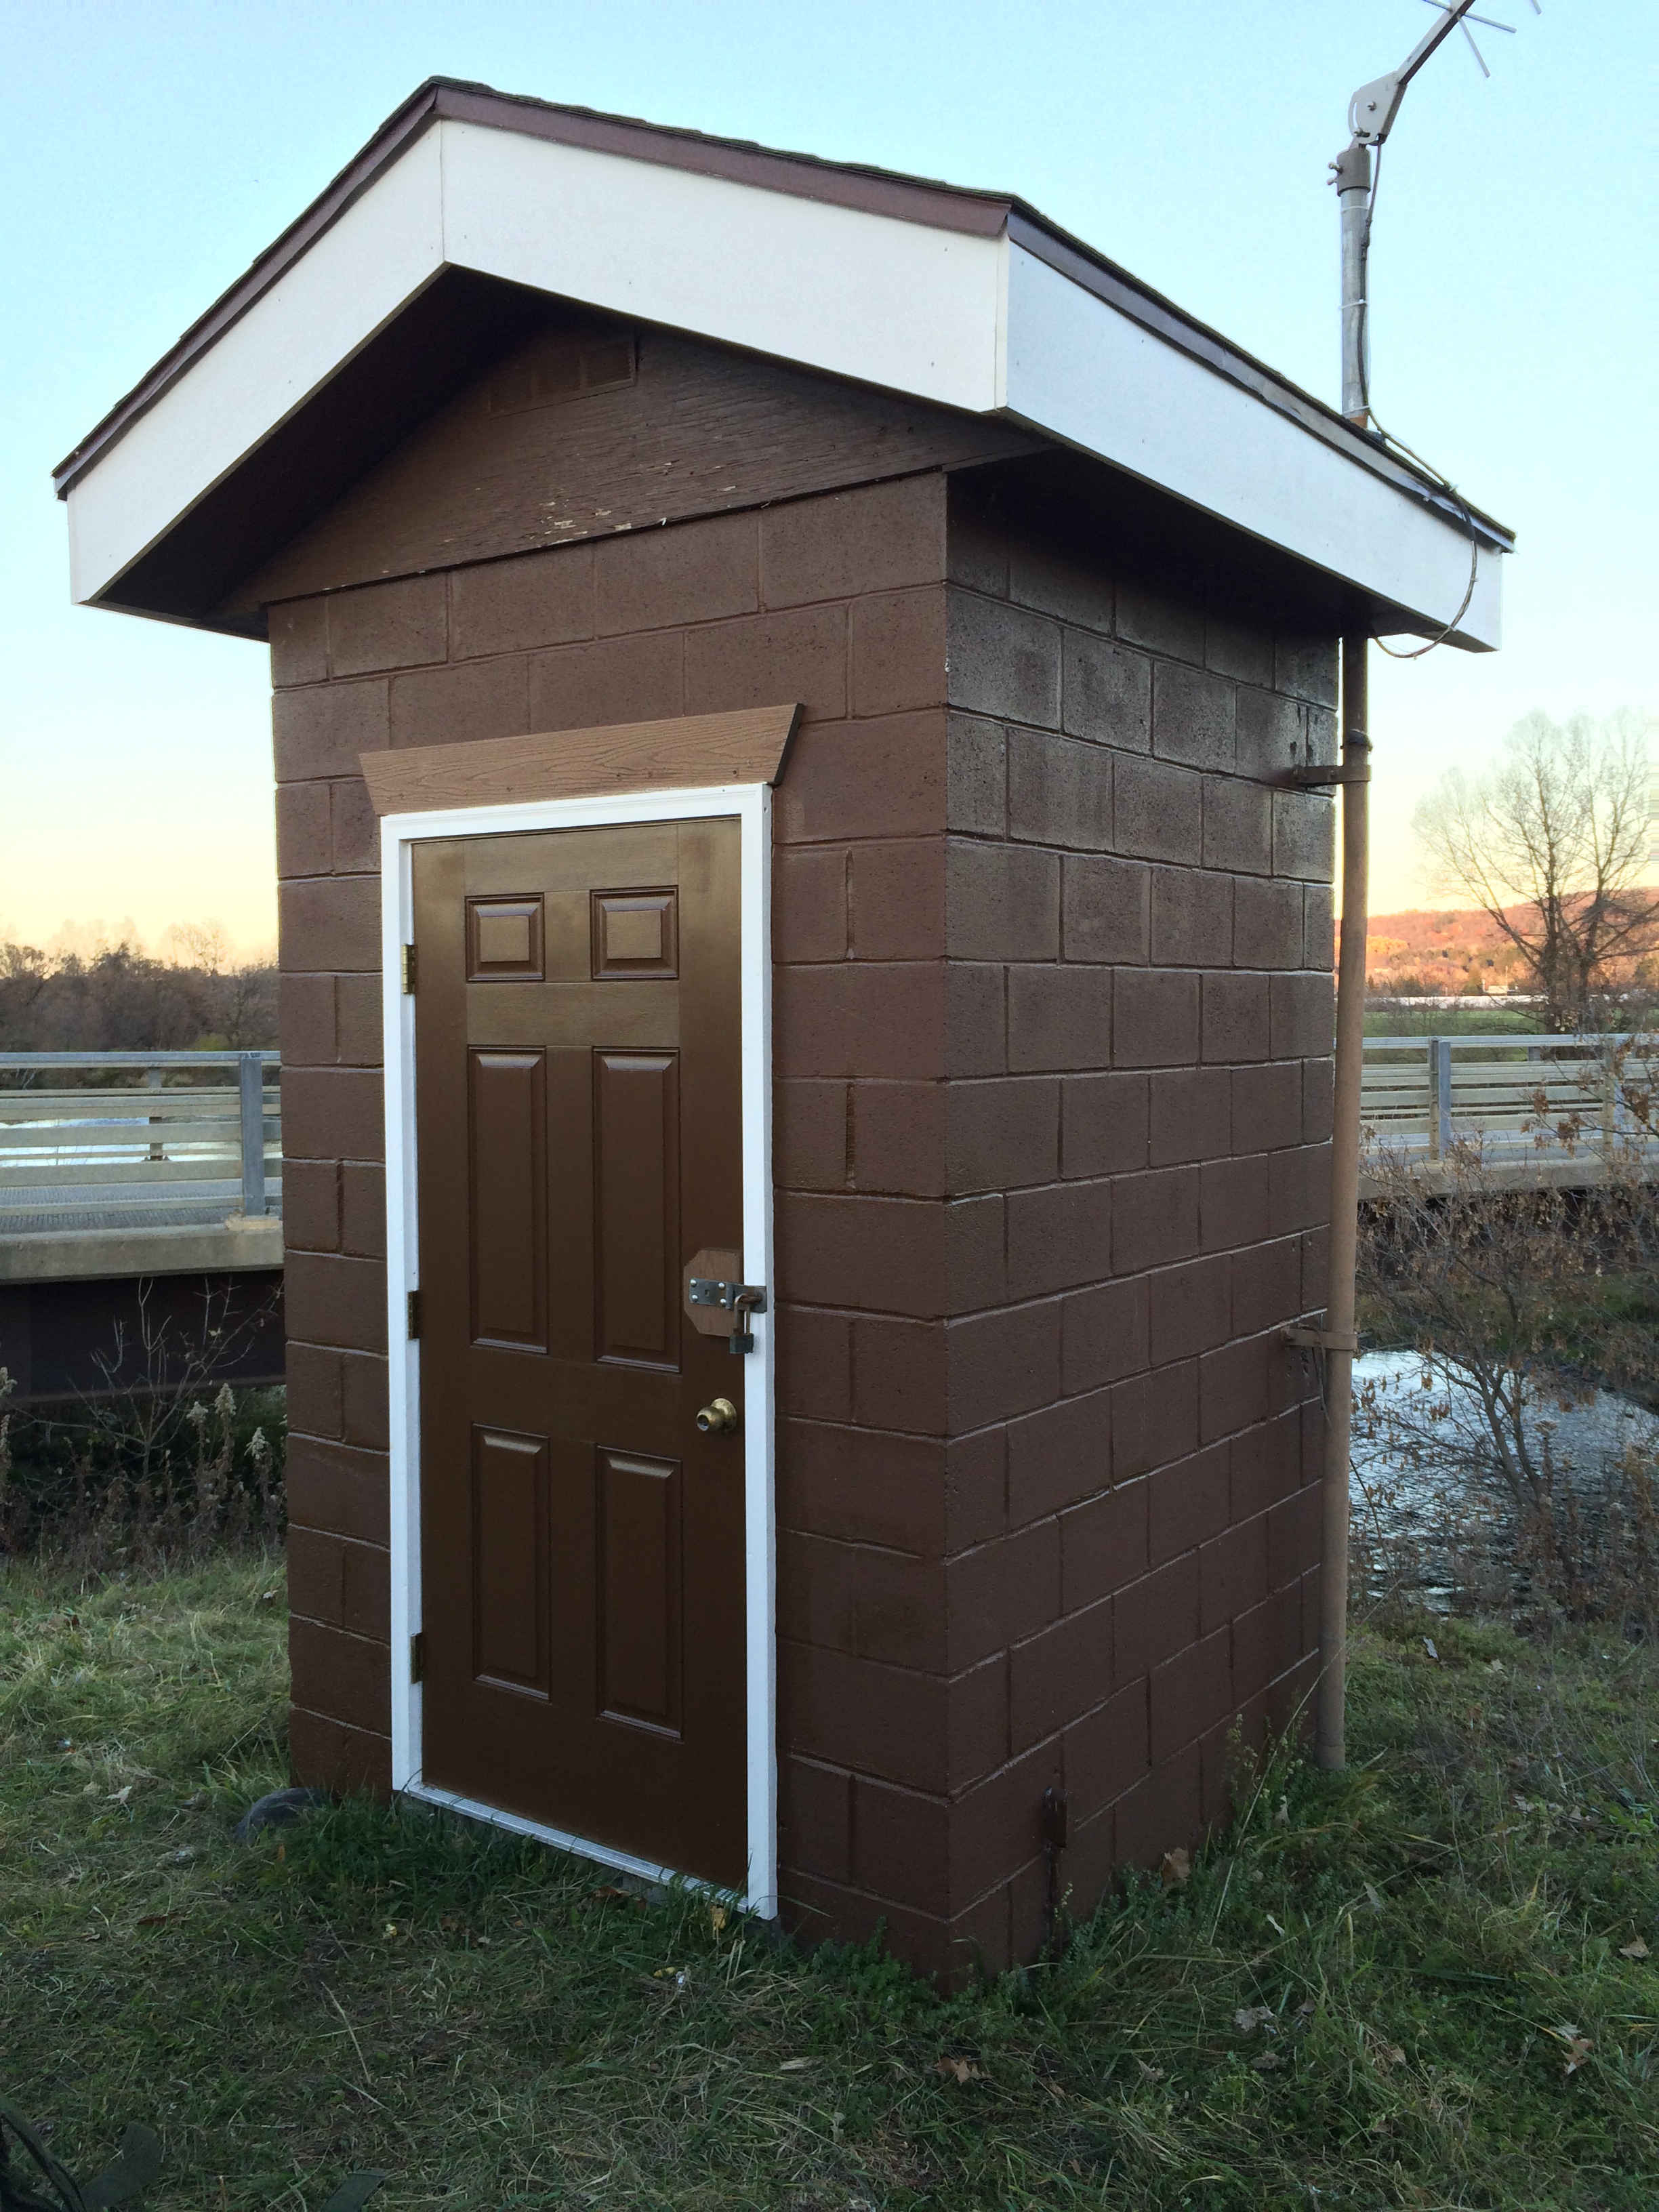 Station image
Summary of all available data for this site
Instantaneous-data availability statement

