PROVISIONAL DATA SUBJECT TO REVISION
Click to hidestation-specific text
Funding for this site is provided by:
 Site Information
LOCATION.--Lat 42°22'40", long
75°24'22" referenced to North American Datum of 1983,
Chenango County, NY, Hydrologic Unit 02050101, on right bank
400 ft downstream from Chenango-Otsego County highway bridge at
Rockdale, and 0.7 mi downstream from Kent Brook.
DRAINAGE AREA.--520 mi².
PERIOD OF RECORD.--November 1929 to September 1933, January 1937 to March 1995, annual maximum only--1996-2000, October 2000 to current year.
REVISIONS HISTORY.--WDR NY-74-1: 1973 (P). WDR-US-2011: 2006. WDR-US-2014: (period of record minimum).
GAGE.--Water-stage recorder. Datum of gage is 992.25 ft above NGVD of 1929 (levels by Corps of Engineers) and 991.95 ft above NAVD of 1988. Prior to January 1937, nonrecording gage at bridge 400 ft upstream at datum 0.73 ft higher.
REMARKS.--Water Years 2014-23: Records good except those for estimated daily discharges, which are poor.
EXTREMES FOR PERIOD OF RECORD.--Maximum discharge, 21,100 ft³/s, Sept. 8, 2011, gage height, 14.22 ft; minimum daily discharge, 27 ft³/s, Sept. 20-27, 1964; minimum instantaneous discharge, not determined.
 WaterAlert – get an
email or text (SMS) alert based on your chosen threshold.
WaterAlert – get an
email or text (SMS) alert based on your chosen threshold.
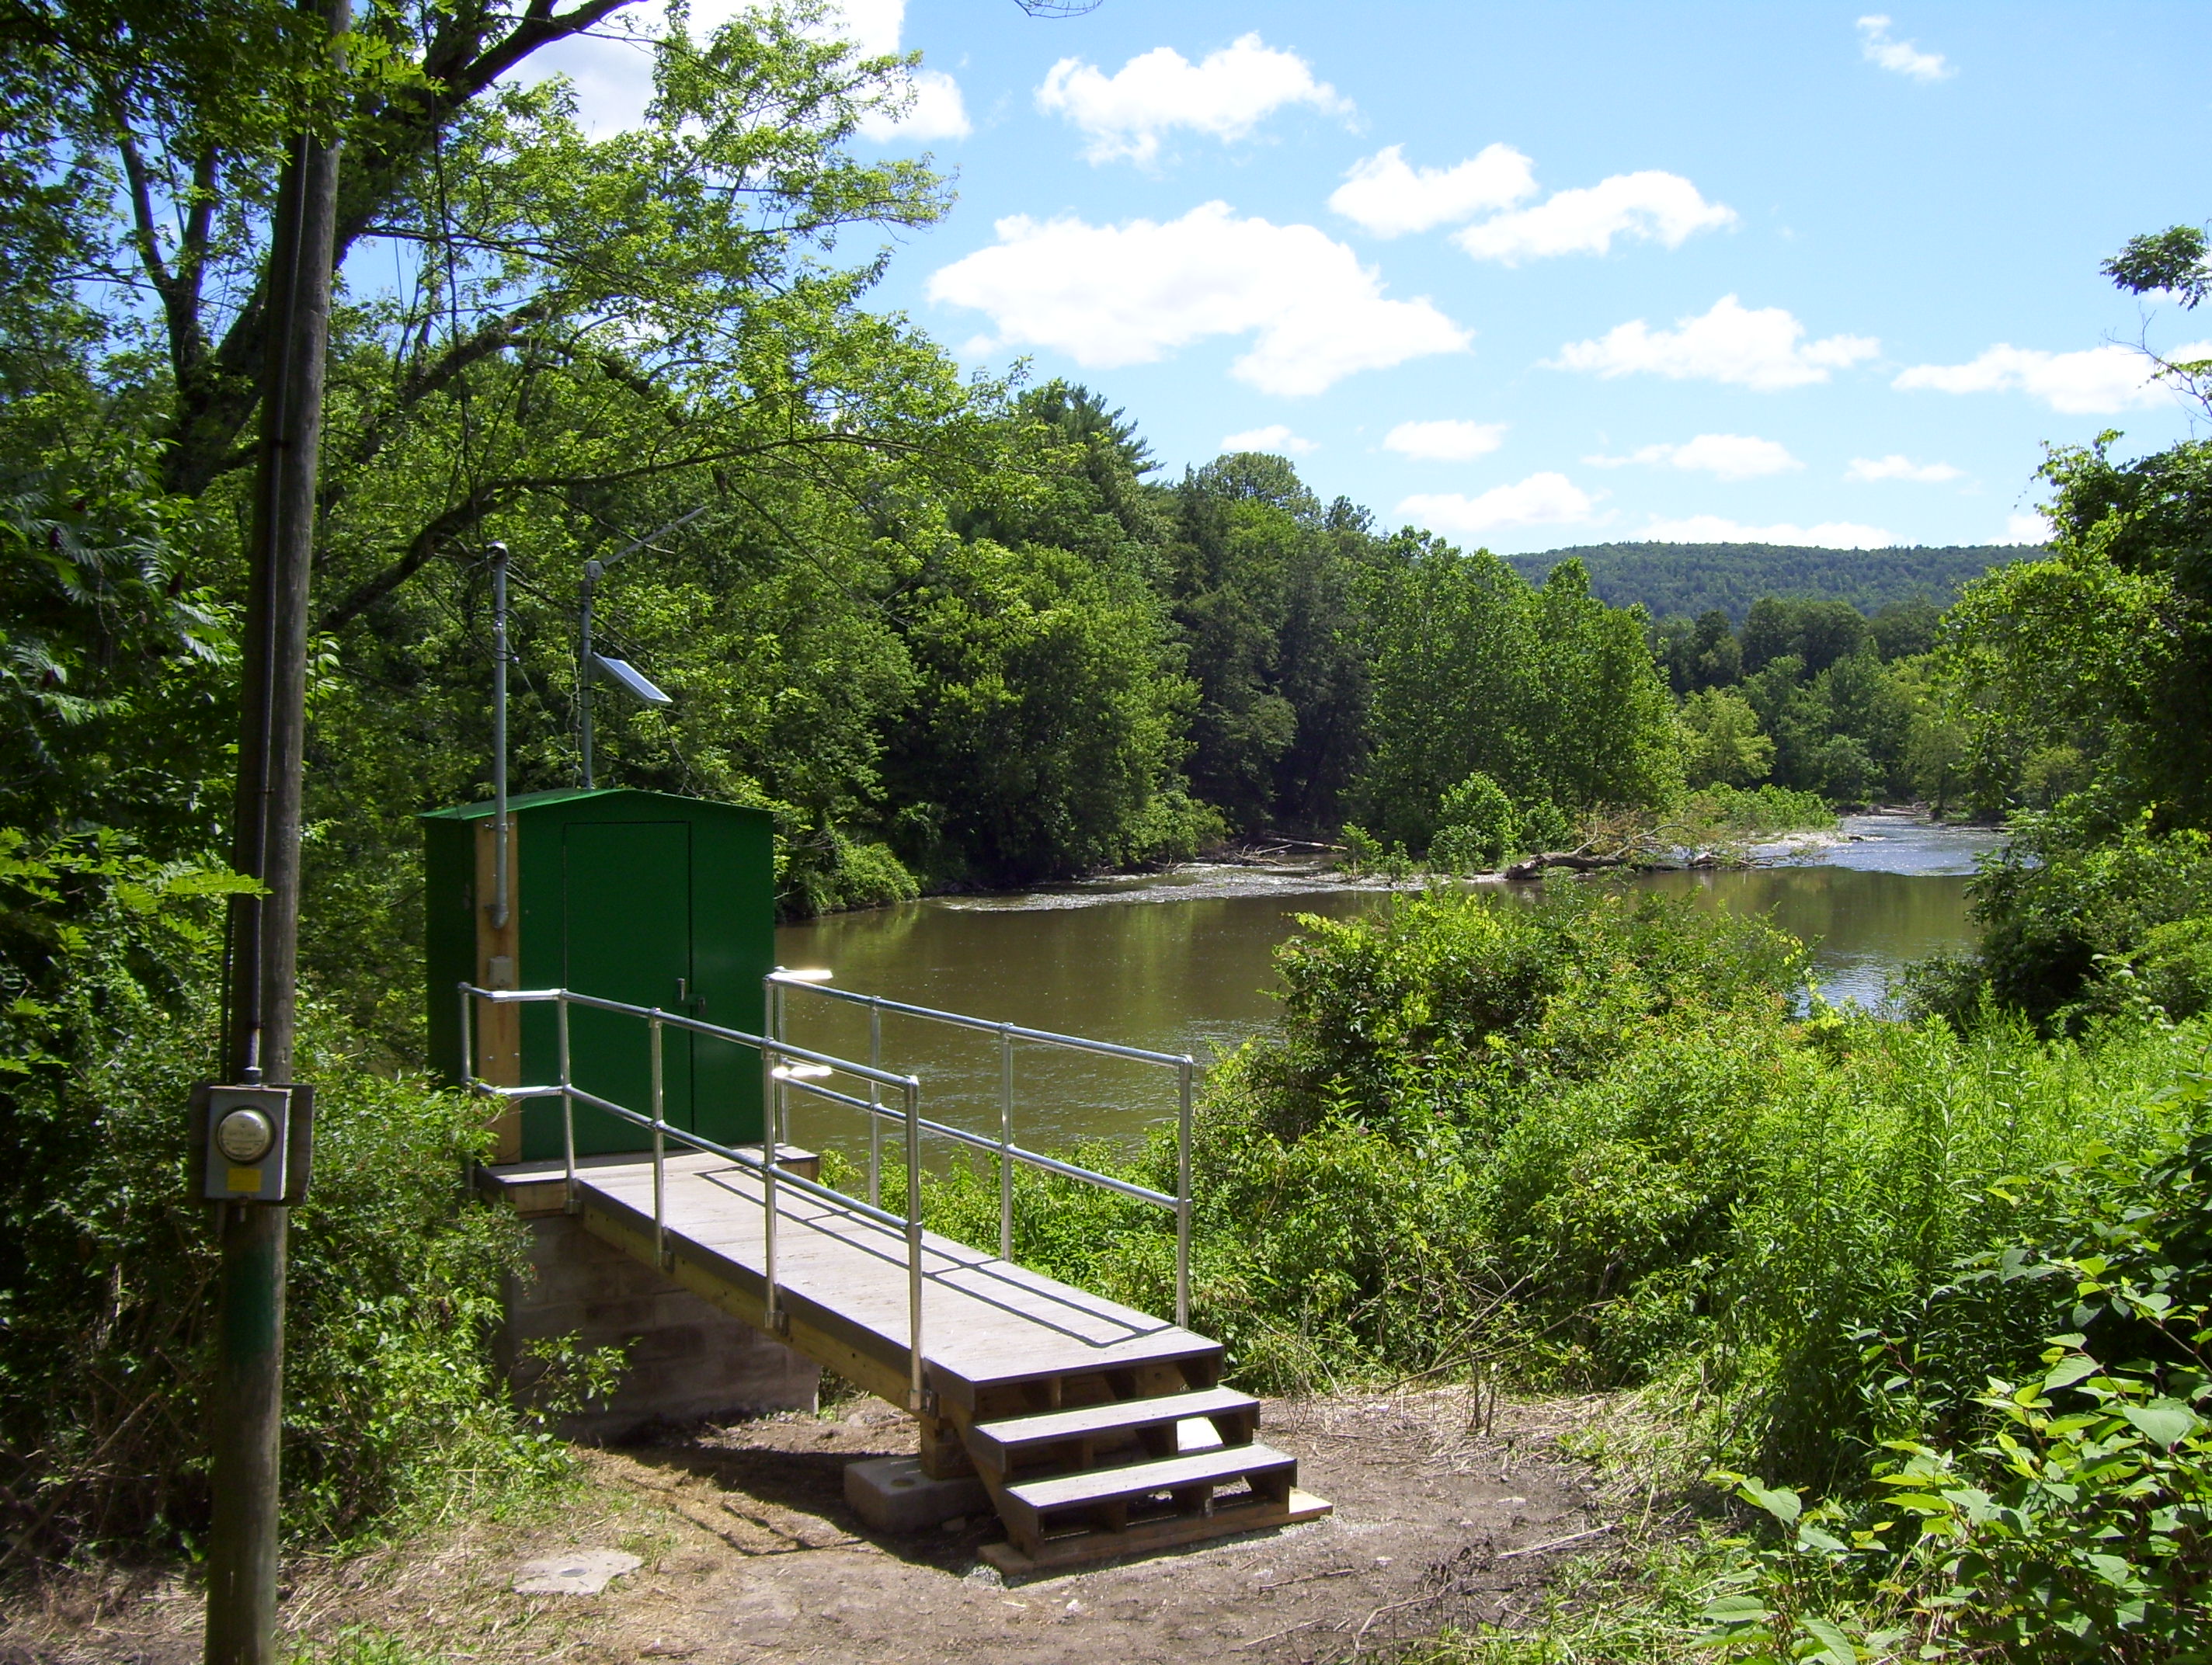 Station image
Summary of all available data for this site
Instantaneous-data availability statement

