PROVISIONAL DATA SUBJECT TO REVISION
Click to hidestation-specific text
Funding for this site is provided by:
 Site Information
-
LOCATION.--Lat 42°00'10.9", long 75°23'00.7" referenced to North American Datum of 1983, Delaware County, NY, Hydrologic Unit 02040101, on left bank at downstream side of bridge on County Highway 56 in Hale Eddy, and 9 mi upstream from confluence of East and West Branches near Hancock.
DRAINAGE AREA.--595 mi².
PERIOD OF RECORD.--November 1912 to current year.
REVISIONS HISTORY.--WSP 871: 1916. WDR NY-82-1: Drainage area.
GAGE.--Water-stage recorder. Datum of gage is 946.46 ft above NGVD of 1929 and 945.98 ft above NAVD of 1988. Prior to Sept. 8, 1928, nonrecording gage at same site and datum.
REMARKS.--Subsequent to October 1963, entire flow from 454 mi² drainage area controlled by Cannonsville Reservoir (station 01424997). Part of flow diverted for New York City municipal supply. Remainder of flow (except for conservation releases and spill) impounded for release during periods of low flow in the lower Delaware River basin, as directed by the Delaware River Master.
Water Years 2014-23: Records good except those for estimated daily discharges, which are poor.
EXTREMES FOR PERIOD OF RECORD.--Maximum discharge, since construction of Cannonsville Reservoir in 1963, 43,400 ft³/s, June 28, 2006, gage height, 19.10 ft; minimum discharge, 17 ft³/s, Oct. 20, 1963; minimum gage height, 1.03 ft, Aug. 4, 1936.
EXTREMES OUTSIDE PERIOD OF RECORD.--Flood of Oct. 10, 1903, reached a stage of 20.3 ft, from floodmarks, discharge, about 46,000 ft³/s.
EXTREMES FOR PERIOD PRIOR TO REGULATION.--Maximum discharge, prior to construction of Cannonsville Reservoir in 1963, 28,900 ft³/s, Mar. 22, 1948, gage height, 15.69 ft; maximum gage height, 15.8 ft, Sept. 30, 1924, from graph based on gage readings.
PERIOD OF DAILY RECORD1.--WATER TEMPERATURE: October 1967 to current year (no winter record for water years 1969-77).
INSTRUMENTATION1.--Water-temperature satellite and telephone telemeter provides 15-minute-interval readings. From October 1976 to April 1993, water-temperature recorder provided one-hour-interval readings. Prior to October 1976, water-temperature recorder provided continuous readings.
REMARKS1.--Temperature readings prior to Oct. 1, 2007, rounded to the nearest 0.5 °C. Water temperature is affected by release of water from upstream reservoir.
EXTREMES FOR PERIOD OF DAILY RECORD1.--WATER TEMPERATURE: Prior to Oct. 1, 2007--Maximum (water years 1968-77, 1979-83, 1985, 1988-96, 1998-2007), 30.5 °C, July 22, 23, 1972, June 16, 1981; minimum (water years 1968, 1978-2007), 0.0 °C on many days during winter periods. WATER TEMPERATURE: After Oct. 1, 2007--Maximum, 20.3 °C, May 11, 2015; minimum, -0.1 °C, Dec. 28, 29, 2017.
1 Water-Quality Records
 WaterAlert – get an email or text (SMS) alert based on your chosen threshold.
 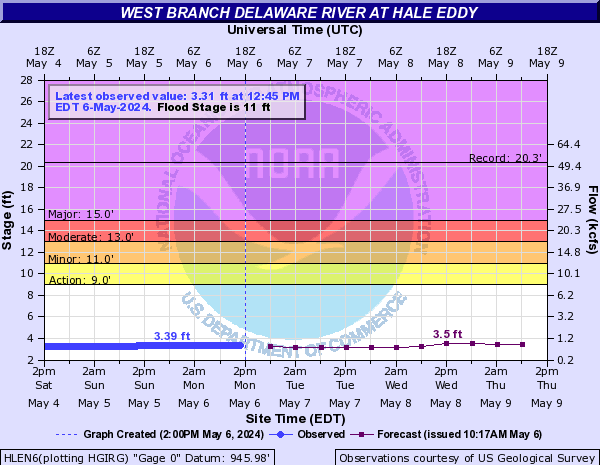 Additional Site Information
Peak Flow and Stage Information
Click on time-lapse image to see the latest full size video. Click on the Static Image to view the latest image For mobile devices, click this link.
 |
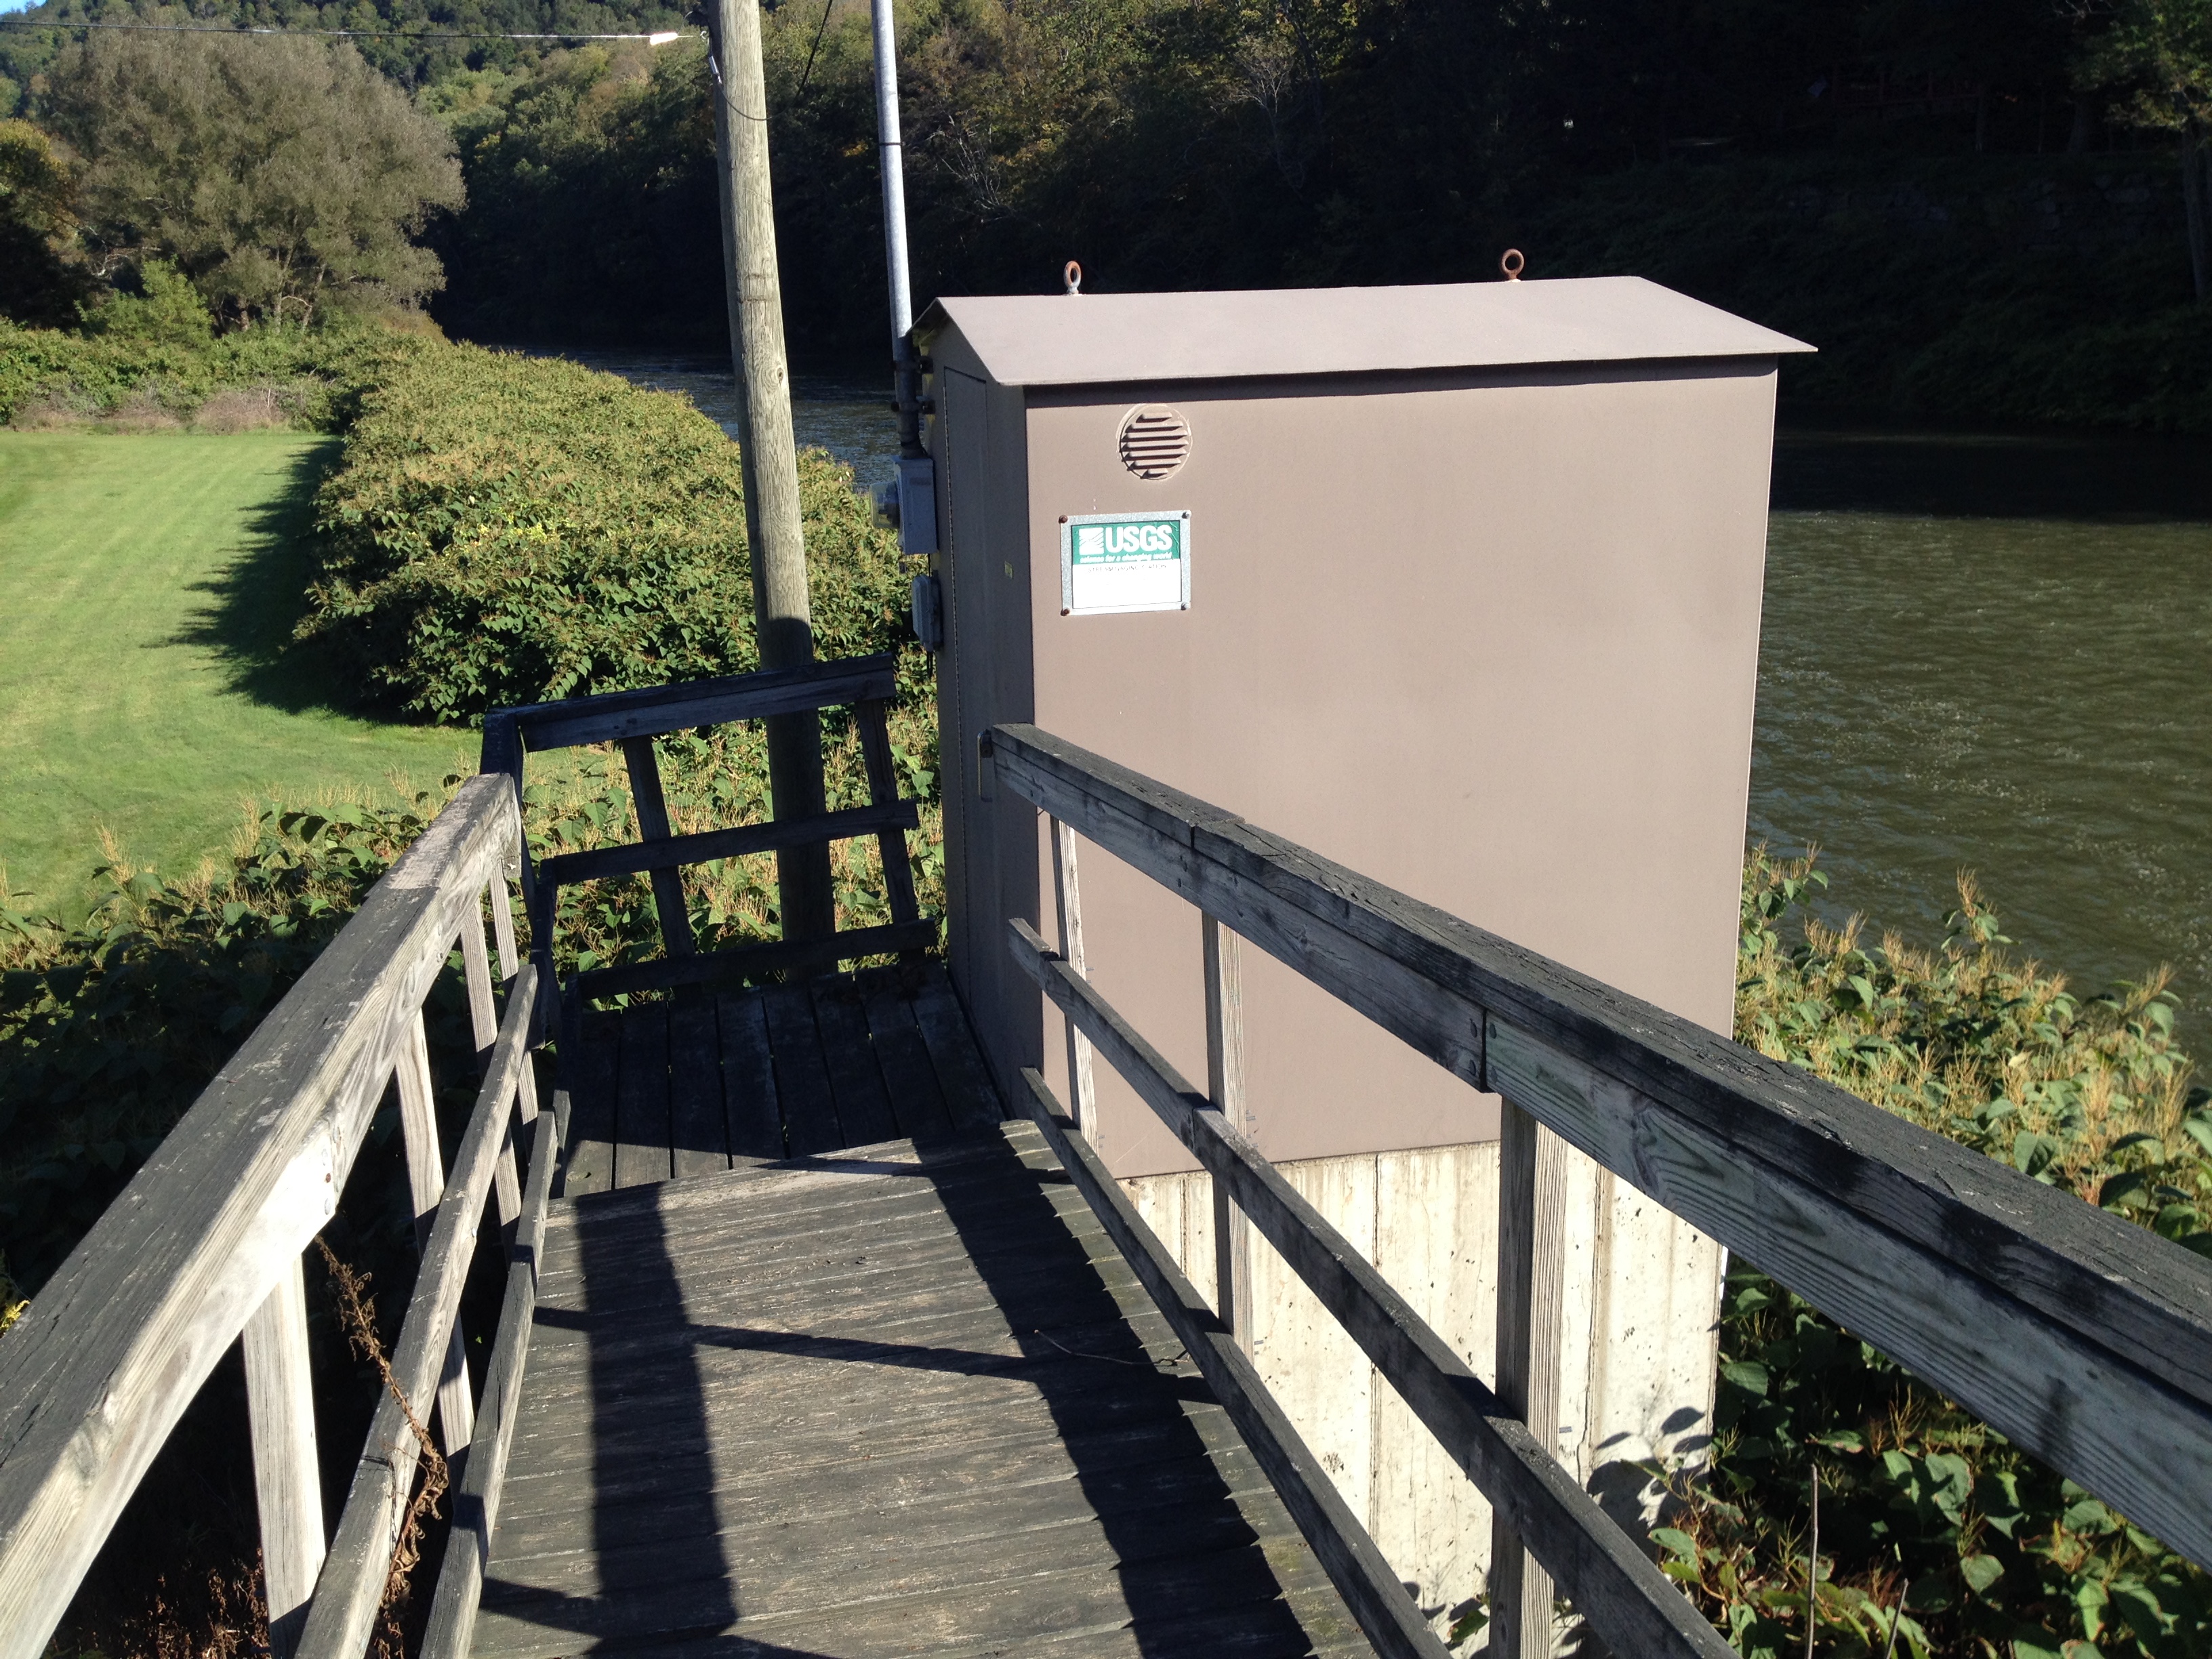 Station image
Summary of all available data for this site
Instantaneous-data availability statement


