 Stream Water Quality in the Conterminous United States --
Status and Trends of Selected Indicators During the 1980's
Stream Water Quality in the Conterminous United States --
Status and Trends of Selected Indicators During the 1980's
Go to Table of Contents
or Go to previous section
Lakes, reservoirs, and estuaries and other coastal waters are particularly affected by stream-transported constituents. The important common feature of these waterbodies is that they can accumulate harmful amounts of nutrients, toxic substances, suspended sediment, and other contaminants. For example, nutrients can stimulate excessive plant growth and cause eutrophication, and benthic organisms can ingest or absorb toxic organic and inorganic constituents that can enter the food chain. In addition to the effects of toxic contaminants on animal and plant communities, the economic effects of resulting bans on eating finfish and shellfish are of considerable national importance. Also, some nutrients and toxic substances can be adsorbed by suspended sediment, and the sediment serves as an agent for the transport, deposition, and retention of these contaminants in waterbodies. Finally, the deposition of sediment in waterbodies also has a direct and costly effect on the physical characteristics of the waterbodies, such as reduction of reservoir storage or clogging of navigable channels.
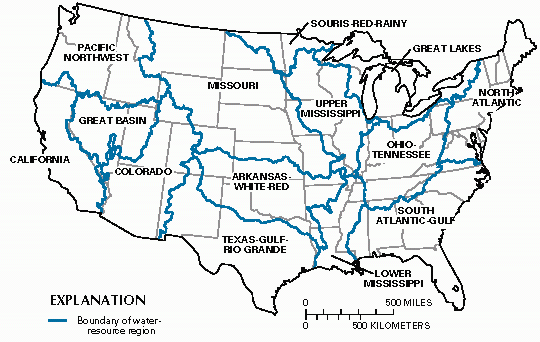
The following discussion of the transport of nitrate, total phosphorus, and suspended sediment is organized into four sections. The first two sections describe the transport of these constituents from 14 water-resources regions and from cataloging units that have been classified into the four land uses defined in figure 37. The last two describe their transport to large reservoirs and coastal areas. Because of the large influence of year-to-year variations in streamflow on the transport of nutrients and suspended sediment, all estimates of load in the following sections were flow adjusted.
 A.
A.
 B.
B.
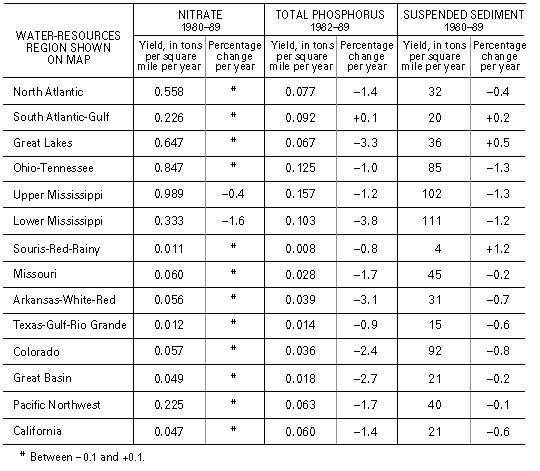
Yields of nitrate and total phosphorus were highest in the Upper Mississippi and Ohio-Tennessee regions and lowest in the Souris-Red-Rainy and Texas-Gulf-Rio Grande regions. The geographic pattern of nutrient yields reflects regional differences in land use and runoff, and it differs from the geographic pattern of nutrient concentrations shown in figures 41A and 42A. For example, total-phosphorus concentrations were high in the streams draining the Texas-Gulf-Rio Grande region, whereas total-phosphorus yields were low because of low average runoff.
Suspended-sediment yields followed a geographic pattern similar to that of nitrate and total phosphorus; high yields occurred in the Ohio-Tennessee and Upper and Lower Mississippi regions. Additionally, high suspended-sediment yields occurred throughout the Colorado region. Also note that suspended-sediment yields are much greater than nutrient yields.
Figure 44 also summarizes trends in nitrate and suspended-sediment yields for water years 1980-89 and in total-phosphorus yields for water years 1982-89. Trends in yield, expressed as annual percentage change, were determined for each station using the seasonal Kendall test (Hirsch and others, 1982), and the median trend for each region is shown. The use of the annual percentage change in yield allows the difference in number of years used to be disregarded and allows the yields of the three constituents to be directly compared.
Nitrate yields changed little during the 1980-89 period, a result that stands in stark contrast to the 1974-81 period during which widespread increases in nitrate were reported by Smith and others (1987). The largest change in nitrate yield decreased 1.6 percent per year, resulting in a 16-percent decrease over the course of the decade.
With the exception of the South Atlantic-Gulf region, where the annual change in total-phosphorus yield was an increase of 0.1, annual changes in total-phosphorus yields decreased at least slightly in all regions between 1982 and 1989 and decreased substantially in the Great Lakes, Arkansas-White-Red, and Lower Mississippi regions. The pattern of widespread decreases in total-phosphorus yield is consistent with the pattern of concentration trends (fig. 42C) and possibly is the result of the combined effects of improved municipal- and industrial-wastewater treatment, reduced phosphate content of detergents, reduced fertilizer use, and reduced quantities of livestock wastes (see previous discussion of total phosphorus in the section "Concentrations of Six Common Water-Quality Constituents.")
Suspended-sediment yields decreased slightly in all regions except the Souris-Red-Rainy, Great Lakes, and South Atlantic-Gulf regions, where yields increased slightly. As noted in the earlier discussion of concentration trends, the national trend toward moderate decreases in suspended-sediment yields during the 1980's is the result, in part, of increased soil-conservation efforts.
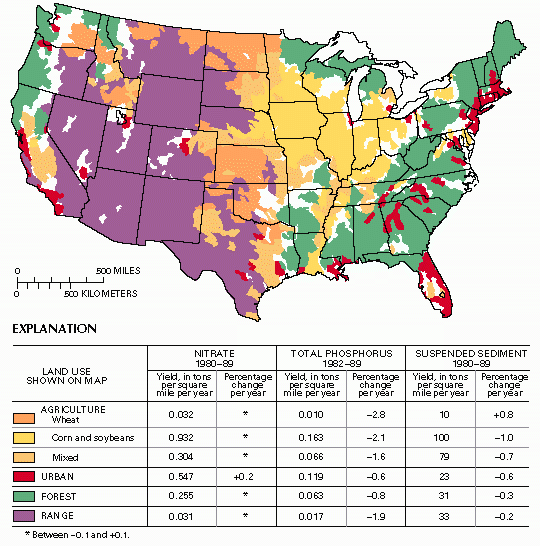
One noteworthy feature of figure 45 is that in agricultural areas, yields of nitrate, total phosphorus, and suspended sediment were all highest in cataloging units under corn and soybean cultivation, lowest in cataloging units under wheat cultivation, and moderate to high in cataloging units dominated by mixed agriculture (wheat and corn and soybeans). The differences in yield among the agriculture categories result from crop-related factors, such as fertilizer composition and application rates, tillage practices, climate, and soil characteristics that have an influence on either nutrient and suspended-sediment availability or on runoff.
Not surprisingly, yields of nitrate and total phosphorus were high in urban cataloging units, due to large point-source contributions of the nutrients to streams. In contrast, nitrate and total phosphorus were low in cataloging units having forest and range land use, where cultural sources of nutrients are small. The factors that limit yields in forest and range-land categories, where nonagricultural forms of vegetation are dominant, are that soil erosion is controlled by forest cover and that precipitation rates are low in western range land.
Possible causes of changes in yield during the 1980's can be determined by examining yield changes in relation to land use. As noted in the previous section "Transport from Water-Resources Regions," few trends in nitrate yield occurred during the 1980-89 period, a noteworthy change from the previous decade when nitrate increases were widespread. One likely reason for the absence of major changes in nitrate yields in agricultural basins during the 1980's is a leveling off in the quantities of nitrogen fertilizer used nationally since 1981 (Alexander and Smith, 1990).
Total-phosphorus yields decreased at least slightly in all land-use classes, a result that is consistent with the regional pattern of yield changes described previously. Decreases in total-phosphorus yield were greatest in the agricultural and range land-use areas. Phosphorus-fertilizer use decreased nationally by 16 percent during 1980-85 (Alexander and Smith, 1990). A possible additional factor in the decline in total-phosphorus yields in agricultural areas is the general trend toward declining erosion rates and suspended-sediment yields in rural areas (U.S. Soil Conservation Service, 1989). Soil-erosion rates have a potentially important influence on nonpoint- source yields of total phosphorus due to a strong tendency for phosphorus to adsorb to soil particles.
Probably the greatest contribution to the decrease in total-phosphorus yield in urban areas resulted from reductions in point-source loads brought about by more complete treatment of municipal and industrial wastewater, decreased industrial water use, and by the widespread removal of phosphate from detergents. The 33- percent decrease in yield in the Great Lakes region during water years 1982-89 (fig. 44), where point-source phosphorus control has been especially stringent (International Joint Commission, 1989), is noteworthy in this regard.
Suspended-sediment yields in most land-use areas reached peak values early in the 1980's and decreased substantially by the end of the decade. Only the yields in areas dominated by wheat cultivation showed an increase. It is possible that decreases in suspended-sediment yield in streams are a reflection of decreases in soil- erosion rates as reported by the U.S. Soil Conservation Service (1989) for several of their categories of rural land use for 1982-87. The increased use of conservation tillage practices also supports the conclusion that erosion rates on agricultural land declined during the 1980's. A comparison of survey data for 1982 and 1988 (Conservation Technology Information Center, 1982, 1988) shows that the percentage of cropland under conservation tillage increased from 18 to 42 percent for the Northeast, 34 to 42 percent in the Great Lakes and Midwest, and 10 to 23 percent in the southern Great Plains. These areas correspond to parts of the Missouri, Upper Mississippi, Ohio-Tennessee, and North Atlantic water-resources regions (fig. 44), where decreases in suspended-sediment yields occurred.
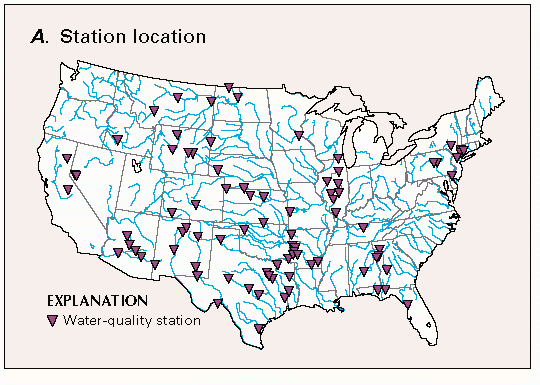
The accumulation of phosphorus and sediment in reservoirs is a significant national water-quality problem. As discussed earlier, phosphorus usually is the plant nutrient in shortest supply in freshwater, and its abundance commonly regulates algal growth in reservoirs and lakes. High concentrations of algae reduce water clarity and cause taste and odor problems; upon settling, decaying algal cells deplete dissolved oxygen and recycle phosphorus to the bottom water, which becomes available for renewed phytoplankton growth when vertical mixing of the water occurs in the spring. In addition to reducing water clarity, sediment suspended in streams that enter reservoirs tends to settle out and accumulate, gradually diminishing the reservoir storage capacity. Total-phosphorus and suspended-sediment loads were calculated for water years 1982-89 and 1980-89, respectively, for water-quality monitoring stations located within 25 miles upstream of reservoirs having a normal storage capacity of greater than 5,000 acre-feet. The 85 stations that met the above criteria (fig. 46A) have a geographic distribution similar to that of large reservoirs throughout the conterminous United States (Ruddy and Hitt, 1990).
 A.
A.
 B.
B.
 C.
C.
More than 20 years of intensive research has established the strong correlation between the loads of total phosphorus transported to reservoirs and lakes to several important indicators of eutrophication, such as phytoplankton density, water clarity, and dissolved-oxygen-depletion rate. This research has lead to the development of reliable indices for predicting eutrophic conditions in lakes and reservoirs on the basis of total- phosphorus load. The most widely used is the Vollenweider index (Vollenweider, 1975), which is calculated from the load of total phosphorus to a lake or reservoir, the volume of the waterbody, and the residence time or amount of time needed for streams to provide inflow equal to the volume of the waterbody. In theory, the value of the index for a given reservoir is equal to the average steady-state total-phosphorus concentration of the reservoir. Index values between 0.05 mg/L and 0.3 mg/L indicate moderately eutrophic conditions; in this range, a submerged black and white disk that is used to measure water clarity is visible to a depth of about 3 to 6 feet. Index values greater than 0.3 mg/L indicate highly eutrophic conditions; disk visibility is less than 3 feet.
Trends in Vollenweider index values for the 85 reservoirs over water years 1982-89 are summarized in figure 46B. The percentage of reservoirs having index values exceeding the lower threshold (0.05 mg/L) of the moderately eutrophic range decreased from 67 to 57 percent, but the percentage having index values greater than the threshold for highly eutrophic conditions (greater than 0.3 mg/L) increased slightly from about 11 to about 15 percent. The increase in the percentage of reservoirs with high index values is in contrast to the general pattern of moderate decreases in total-phosphorus concentrations and loads nationally.
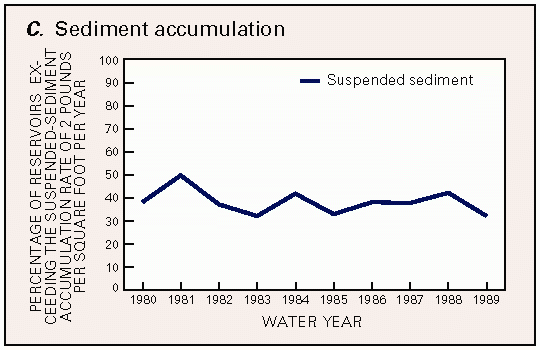
The accumulation of sediments in reservoirs causes the loss of water-storage capacity that eventually must be remedied through dredging or construction of new reservoirs. Nationally, the total annual cost of replacing lost reservoir storage capacity is estimated to range from $80 to $700 million in 1985 dollars (Clark and others, 1985). An index of the sediment-accumulation rate in a reservoir is obtained by dividing the incoming suspended- sediment load by the reservoir area. Annual sediment-accumulation rates for the 85 reservoirs ranged from less than one-tenth to more than 10 pounds per square foot; the median was 1.2 pounds per square foot. The percentage of the reservoirs having accumulation rates greater than 2 pounds per square foot per year decreased slightly during 1980-89 (fig. 46C). For sediment having a typical density of about 1 ounce per cubic inch, an accumulation rate of 2 pounds per square foot per year would lead to an average loss of reservoir depth of about 0.2 inch per year.
 A.
A.
 B.
B.
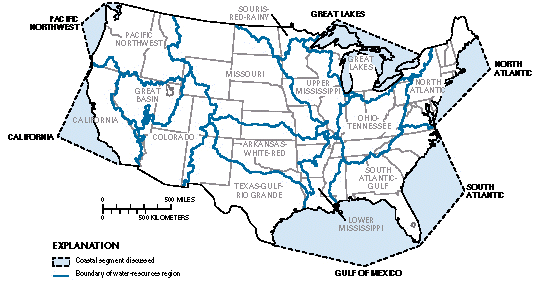
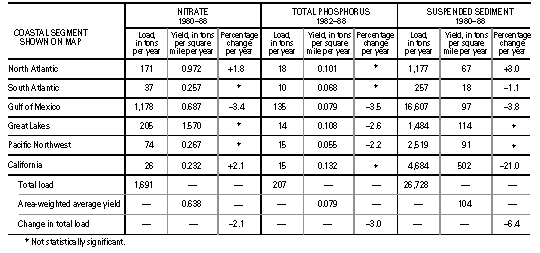
The Gulf of Mexico receives drainage from about 60 percent of the land area of the conterminous States and receives the highest percentage of nitrate, total-phosphorus, and suspended-sediment loads of the six coastal segments--70 percent of nitrate, 65 percent of total phosphorus, and 62 percent of suspended sediment. However, when the coastal-segment yields--determined by dividing load by drainage area--are compared, differences between the segments become apparent. The Great Lakes and North Atlantic have the highest yields of nitrate, for example, due to the combined effects of municipal and industrial point sources, atmospheric deposition, and significant application of nitrogen-based fertilizers. Coastal yields of total phosphorus and suspended sediment, by contrast, are highest in the California segment where torrential spring runoff carries high sediment loads from the steep slopes of coastal mountains in the northern part of the State. Also, in California, suspended-sediment loads are especially high in areas where timber-harvesting practices have exposed soil to erosion. Finally, yields of nitrate, total phosphorus, and suspended sediment are comparatively low in the South Atlantic coastal segment because extensive areas of forested wetland and many large reservoirs in the drainage to the South Atlantic and Gulf of Mexico segments trap the particulate material.
Consistent with the general pattern of yield trends in interior basins, the predominant direction of change in coastal loads of nitrate, total phosphorus, and suspended sediment was downward during the periods studied. For the conterminous States, the decrease in total coastal loads of the three constituents was 2.1, 3.0, and 6.4 percent per year, respectively. This downward trend in total coastal loads was influenced greatly by the decreases in the delivery of the three constituents to a single coastal segment--the Gulf of Mexico. Significant decreases in loads of two of the constituents--total phosphorus and suspended sediment--also occurred in the Great Lakes and Pacific Northwest segments and the South Atlantic and California segments, respectively. In contrast, nitrate loads to all coastal segments except the Gulf of Mexico either increased or showed no statistically significant trend.
Figure 48A shows cataloging units having high surface-water withdrawals for domestic, industrial, and irrigation use. High surface-water withdrawals in cataloging units are defined as those having 1985 surface-water withdrawals (Solley and others, 1988) for a given water-use category within the upper 25 percent of all cataloging units--for domestic use, the surface-water withdrawal was greater than 2.3 Mgal/d (million gallons per day); for industrial use, it was greater than 2 Mgal/d; and for irrigation use, it was greater than 13 Mgal/d. Note that many cataloging units are identified as having high surface-water withdrawals for more than one water use. Additionally, data from water-quality monitoring stations in the cataloging units that are aggregated by water-use category are summarized in figures 48B-D to show trends in water quality in terms of chemical criteria relevant to water use. These criteria are discussed below, along with the results of the analysis.
 A.
A.
 B.
B.
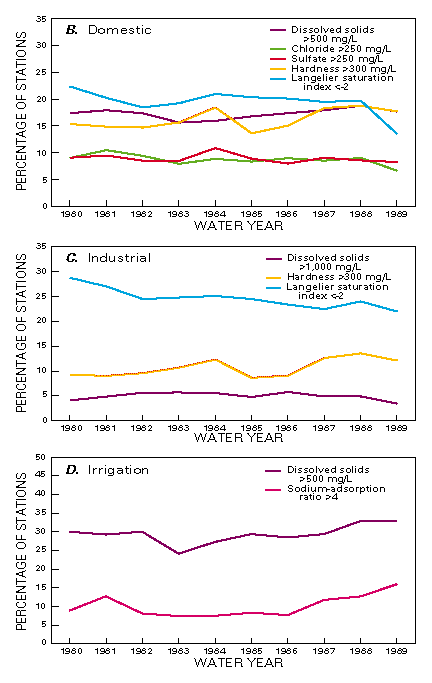
In cataloging units having high domestic surface-water withdrawals, the percentage of water-quality stations having annual average dissolved-solids concentrations greater than 500 mg/L fluctuated around 17 percent between 1980 and 1989. However, the percentage of stations having annual average chloride and sulfate concentrations greater than 250 mg/L decreased slightly or remained the same (fig. 48B).
Throughout much of the United States, water for domestic use is treated to reduce the amount of calcium and magnesium, the principal components of the soap-consuming property of water that commonly is termed "hardness." A decrease in soap cleansing becomes noticeable when hardness, usually expressed as an equivalent concentration of calcium carbonate, is greater than about 100 mg/L. An additional reason for treating hard water is that calcium and magnesium--which are relatively insoluble--form scale or mineral deposits that clog plumbing and appliances. At more moderate levels of hardness, however, calcium and magnesium form a thin layer over chemically sensitive metallic surfaces that serves to protect plumbing and appliances against corrosion. Water having a hardness concentration greater than 180 mg/L is considered very hard and 300 mg/L is considered extremely hard (U.S. Environmental Protection Agency, 1976). In cataloging units having high domestic surface-water withdrawals, the percentage of water-quality monitoring stations having annual average hardness greater than 300 mg/L increased from about 15 percent in water year 1980 to 18 percent in water year 1989.
Corrosion of pipes and solder joints can contribute lead or other toxic materials to water that is used for domestic as well as industrial use, in addition to reducing the useful life of plumbing and appliances. Several indices of the corrosive capacity of water have been devised (Singley, 1981), and most assume that an optimal balance between the corrosive and scale-forming properties of water lies at about the saturation point for calcium carbonate. The most widely used index, that of Langelier (1936), is a function of pH, temperature, alkalinity, calcium concentration, and ionic strength. Positive values of the index indicate scale-forming conditions and negative values indicate corrosive conditions. Values less than about -2 generally are considered highly corrosive. In cataloging units having high domestic surface-water withdrawals, the percentage of water-quality monitoring stations having an annual average Langelier saturation index value less than -2 decreased from 22 to 14 percent (fig. 48B) from water year 1980 to 1989.
Maximum acceptable dissolved-solids concentrations in untreated water for industrial use are variable, ranging from 150 mg/L for textile manufacturing, through a few thousand milligrams per liter in the chemical and petroleum industries, to 35,000 mg/L for boiler makeup (U.S. Environmental Protection Agency, 1986). In cataloging units having significant industrial surface-water withdrawals, the percentage of water-quality monitoring stations having an annual average dissolved-solids concentration greater than 1,000 mg/L remained nearly constant during the 1980's at about 4 percent (fig. 48C).
Limits on hardness in raw water supplies for industry also are variable. The hardness requirement for process water in industries is essentially zero, a level that can be achieved through treatment. In cataloging units having significant industrial surface-water withdrawals, the percentage of water-quality stations having an annual average hardness of greater than 300 mg/L increased from 9 to about 12 percent during water years 1980-89 (fig. 48C).
As with water for domestic water use, the corrosivity of some industrial water supplies requires adjustment to avoid costly damage to pipes and other equipment. In cataloging units having large industrial surface-water withdrawals, the percentage of stations having an annual average Langelier saturation index less than -2 decreased from 29 to 22 percent during water years 1980-89 (fig. 48C).
In addition to contributing to osmotic pressure, sodium in sufficient concentrations is toxic to certain fruits and other plants, and, when present in high concentrations relative to the concentrations of cations having a positive charge of 2, can adversely affect soil structure and infiltration and permeability rates (U.S. Environmental Protection Agency, 1976). The sodium-adsorption ratio (SAR) of irrigation water is a frequently used index of sodium concentration in relation to calcium and magnesium. When SAR values exceed about 4, sensitive fruits can be damaged; when it exceeds about 13, many crops can be damaged (Federal Water Pollution Control Administration, 1968). The percentage of water-quality monitoring stations in cataloging units having significant irrigation surface-water withdrawals with annual average SAR values greater than 4 increased from 9 to 16 percent during 1980-89 (fig. 48D).
 A.
A.
 B..C.
B..C.
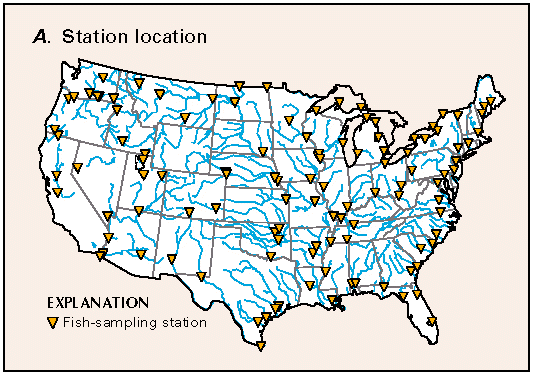
In theory, contaminant concentrations in finfish tissue are integrative measures of water quality and can reflect long-term average contaminant concentrations in one or more aspects of the stream environment. Depending on the chemical nature of the contaminant in question and the age and species of fish sampled, contaminant concentrations in fish tissue could be indicative of contaminant levels in either the living or nonliving components of either the stream water or sediments. Moreover, data on contaminant levels in fish tissue provide information on the health risks of the human consumption of fish from the locality where the fish samples were collected. However, there are several difficulties in interpreting the toxicological significance of contaminant-concentration measurements made in the NCBP. First, contaminant concentrations in the NCBP are measured in whole fish as opposed to the more edible portions of fish, whereas U.S. Food and Drug Administration criteria for evaluating the safety of fish for human consumption are based on contaminant concentrations in fish fillets. Second, organic chemical analyses in the NCBP are not specific for the toxic components of certain classes of contaminants such as PCB's but, instead, refer to the total concentration of all compounds in the class. Nevertheless, NCBP data provide a useful summary of national- and regional-level trends in the occurrence of historically important toxic contaminants in fish tissues.
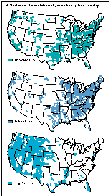
Results of the reconnaissance suggest that detectable concentrations of atrazine, one of the most commonly used herbicides for weed control in corn and sorghum production, occurred year-round in a majority of the streams sampled. During the first runoff after application in 1989, a majority (52 percent) of the streams sampled had atrazine concentrations exceeding 3 m/L (micrograms per liter), the EPA MCL recommended for drinking water (fig. 50). During the spring and early summer period following herbicide application, atrazine concentrations increased by as much as two orders of magnitude and then decreased to preapplication levels by fall during low- streamflow conditions. Because of the random design of the sampling, these results are believed to be typical of streams throughout the study region.
For three other herbicides (alachlor, cyanazine, and simazine) the number of sampling locations having concentrations exceeding the EPA drinking-water criteria during the immediate postapplication period ranged from 2 to 49 percent. Concentrations of alachlor exceeded the EPA MCL for drinking water of 2 m/L at 32 percent of the streams sampled (Goolsby, Thurman, and Kolpin, 1991). When compared with the most recent EPA drinking-water criteria, concentrations of cyanazine exceeded the lifetime health-advisory level of 1 m/L at 49 percent of the streams sampled, whereas concentrations of simazine exceeded the EPA MCL of 4 m/L at only 2 percent of the streams sampled.
As a follow-up to the 1989 and 1990 survey described above, sampling for five herbicides in the Mississippi River and several of its major tributaries was initiated by the USGS in the spring of 1991 (Goolsby, Coupe, and Markovchick, 1991). The estimates of atrazine loads determined by this survey are summarized in figure 51.
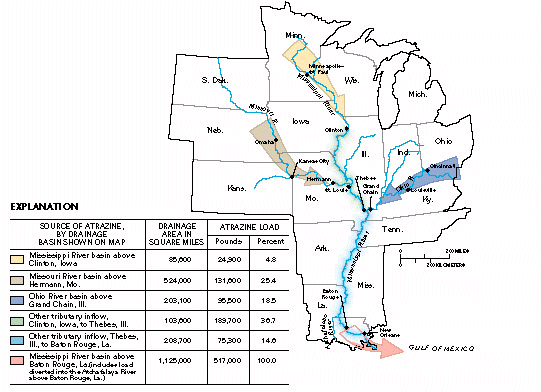
One or more herbicides were detected in every sample collected during the April to June period. Atrazine was detected most frequently, followed by cyanazine, alachlor, and simazine. Concentrations of two herbicides, atrazine and alachlor, occasionally exceeded MCL's for drinking water. Atrazine exceeded the MCL in 27 percent of the samples, including one sample from the Mississippi River at Baton Rouge, La., hundreds of miles from the major source of atrazine in the Midwest. Alachlor exceeded the MCL in 4 percent of the samples, but only in the smaller tributaries.
Load calculations were made for atrazine to determine the predominant source areas for this widely used herbicide. The calculations indicate that the largest percentage (about 37 percent) of the atrazine discharged from the Mississippi River into the Gulf of Mexico entered the river from streams draining Iowa and Illinois. The second largest source area was the Missouri River basin, which contributed about 25 percent of the atrazine entering the Gulf. The atrazine discharged to the Gulf of Mexico during April, May, and June 1991 was estimated to be 517,000 pounds. This quantity represents slightly less than 1 percent of the amount of atrazine applied annually to cropland in the Mississippi basin.
