|
Wetland maps are a prerequisite for wetland inventory and for wetland
development planning, management, protection, and restoration. Maps
provide information on wetland type, location, and size. Detailed wetland
maps are necessary for analysis of the effect of projects at specific sites
and for providing baseline spatial data for the assessment of the effects
of national policies and activities. Wetland maps are used by local,
State, and Federal agencies, as well as by private industry and
organizations. They are used for many purposes, including the development
of comprehensive resource management plans, environmental impact
assessments, natural resource inventories, habitat surveys, and the
analysis of trends in wetland status. Several Federal agencies map wetlands in support of their Congressional mandate. These include the U.S. Department of the Interior, U.S. Fish and Wildlife Service (FWS); the U.S. Department of Agriculture, Natural Resources Conservation Service (NRCS); and the U.S. Department of Commerce, National Oceanic and Atmospheric Administration (NOAA). The FWS has the primary responsibility for mapping and inventory of all the wetlands of the United States. The wetland maps produced by other agencies serve different purposes and generally involve cooperation with the FWS.
|
THE U.S. FISH AND WILDLIFE SERVICE'S MAPPING AND
The FWS National Wetlands Inventory is responsible for the mapping and
inventory of wetlands throughout the United States. The Emergency
Wetlands Resources Act of 1986 and amendments to it in 1988 and 1992
define the responsibilities of the National Wetlands Inventory. (See
the article "Wetland Protection
Legislation" in this volume for more information on this and other
wetland legislation.) |
Wetland maps are a prerequisite for wetland inventory, planning, management, protection, and restoration. | ||||||||||||||||||||||||||||||||||
History and Status of the National Wetlands Inventory | ||||||||||||||||||||||||||||||||||||
|
In 1906, and again in 1922, the U.S. Department of Agriculture inventoried
the wetlands of the United States to identify those that could be drained
and converted to other uses (Wilen and Tiner, 1993). In 1954, the first
nationwide wetland survey by the FWS covered about 40 percent of the
conterminous United States and focused on important waterfowl wetlands.
This survey was not comprehensive by today's standards, but it stimulated
public interest in the conservation of waterfowl wetlands (Shaw and
Fredine, 1956). (See the article "Wetlands as Bird Habitat" in this
volume.) After the earlier inventories, and in response to passage of the Emergency Wetlands Resources Act and its amendments, the FWS established the National Wetlands Inventory. The program is designed to (1) produce detailed maps on the characteristics and extent of the Nation's wetlands, (2) construct a national wetlands data base, (3) disseminate wetland maps and digital data, (4) report results of State wetland inventories, (5) report to Congress every 10 years on the status and trends of the Nation's wetlands, and (6) assemble and distribute related maps, digital data, and reports.
|
The National Wetlands Inventory has produced more than 50,800 maps covering
88 percent of the conterminous United States, 30 percent of Alaska, and all
of Hawaii and the U.S. Territories (fig. 44)
Priorities for mapping have been based on the needs of the FWS, other
Federal agencies, and State agencies. To date, mapping has been
concentrated on the coastal zone (including the Great Lakes), prairie
wetlands, playa lakes, flood plains of major rivers, and areas that reflect
goals of the North American Waterfowl Management Plan (U.S. Fish and
Wildlife Service, 1976). As a practical matter, priorities have been based
on the availability of funding and the availability of high-quality aerial
photographs. The National Wetlands Inventory produced maps at a rate of
about 5 percent of the conterminous United States and about 2 percent of
Alaska annually through 1995-about 3,200 1:24,000-scale maps in the
conterminous United States and about 60 1:63,360-scale maps in Alaska.
| The Clean Water Act regulates dredge and fill activities that would adversely affect wetlands. | ||||||||||||||||||||||||||||||||||
| ||||||||||||||||||||||||||||||||||||
|
The National Wetlands Inventory has published a series of documents on the
trends in wetland losses and gains. The first of these reports was "Status
and Trends of Wetlands and Deepwater Habitats in the Conterminous United
States, 1950's to 1970's" (Frayer and others, 1983). In the Emergency
Wetlands Resources Act of 1986 and subsequent amendments, Congress directed
the National Wetlands Inventory to (1) update and improve the information
contained in this report by 1990 and at 10-year intervals thereafter and
(2) estimate the number of acres of wetland habitat in each State in the
1780's and the 1980's and calculate the percentage of loss in each State.
In response to this directive, the National Wetlands Inventory published a
1990 report to Congress titled "Wetlands-Losses in the United States,
1780's to 1980's" (Dahl, 1990). The National Wetlands Inventory also is preparing a geographically referenced digital data base for wetlands so that wetland information can be placed in geographic information systems (GIS) for use with computers. These digital maps and information are easily transmitted over the Internet. To date, almost 18,800 maps, representing 29 percent of the United States, have been digitized (fig. 45). Statewide data bases have been digitized for Delaware, Hawaii, Indiana, Maryland, Illinois, New Jersey, Washington, Iowa, Minnesota, and West Virginia. Digitization is in progress for Florida, North Carolina, South Carolina, South Dakota, and Virginia. Wetland digital data are available for parts of 35 other States.
|
In addition to wetland maps and status and trend reports, the National
Wetlands Inventory produces special items related to the identification,
mapping, and inventory of wetlands. The "National List of Plant Species
that Occur in Wetlands" (Reed, 1988) is an important tool for identifying
wetlands on the basis of their vegetation. A computerized data base for
wetland plants, developed by the National Wetlands Inventory, also lists
plants found in wetlands and ranks their affinity to the wetland
environment. This information is important for determining whether an area
is really a wetland. Additionally, the National Wetlands Inventory has
contributed to a list of hydric soils (soils found in wetlands) (U.S. Soil
Conservation Service, 1991). Many published State wetland reports,
including "Wetlands of Maryland" (Tiner and Burke, 1995), "Wetlands of
Connecticut" (Metzler and Tiner, 1992), and "Status of Alaska Wetlands"
(Hall, Frayer, and Wilen, 1994), contain wetland inventory results and
other important information. Finally, in cooperation with the U.S.
Geological Survey (USGS), the National Wetlands Inventory has published a
map (scale of 1 inch equals 50 miles) showing the locations of major
wetland complexes in the conterminous United States, Hawaii, and Puerto
Rico (Dahl, 1991) and a map (scale of 1 inch equals 40 miles) of Alaska's
wetland resources (Hall, 1991).
| To date, almost 18,800 maps, representing 29 percent of the United States, have been digitized. | ||||||||||||||||||||||||||||||||||
| ||||||||||||||||||||||||||||||||||||
OTHER FEDERAL AGENCIES' MAPPING AND INVENTORY ACTIVITIES | ||||||||||||||||||||||||||||||||||||
|
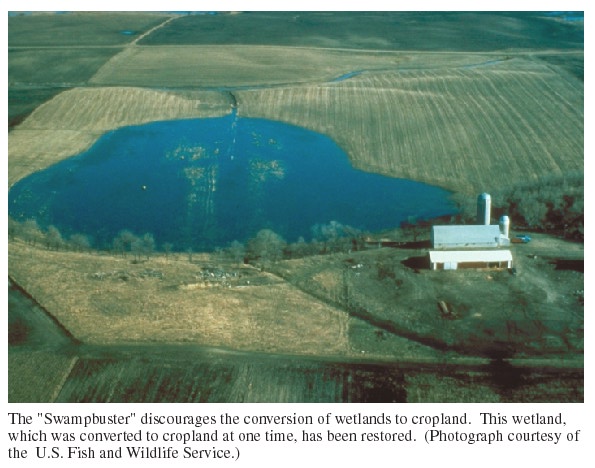
Natural Resources Conservation Service.--The NRCS (formerly the
Soil Conservation Service) conducts its wetland inventory under the
auspices of the wetland conservation provision (nicknamed "Swampbuster") of
the Food Security Act of 1985. This Act provides for the reduction of a
farmer's program benefits if wetlands are converted to agricultural
production. In order to implement this act, the mapping of the NRCS is
focused on freshwater wetlands that have a high potential for agricultural
conversion, such as those adjacent to or lying within the boundaries of
existing agricultural fields. The NRCS does not produce a standard map product. Many delineations are made on l:660-scale black-and-white aerial photographs; others are made on soil-survey base maps at scales that range from 1:10,000 to 1:64,000 (Teels, 1990). Information sources for this program include recent and historical aerial photographs, such as those regularly acquired by the U.S. Department of Agriculture, National Wetlands Inventory maps from the FWS, U.S. Department of Agriculture crop history records, and field verifications.
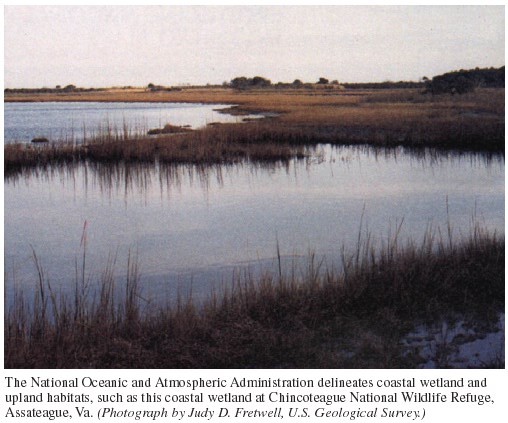
National Oceanic and Atmospheric Administration.--The NOAA has developed the Coastal Wetland Habitat Change Program in order to delineate coastal wetland habitats and adjacent uplands and plains to monitor changes in these habitats on a cycle of 1 to 5 years. The basis for monitoring will be a data base describing the areal extent and distribution of coastal wetlands in the conterminous United States. The program will help to determine the linkages between estuarine and marine wetlands, as well as the distribution, abundance, and health of living marine resources. |
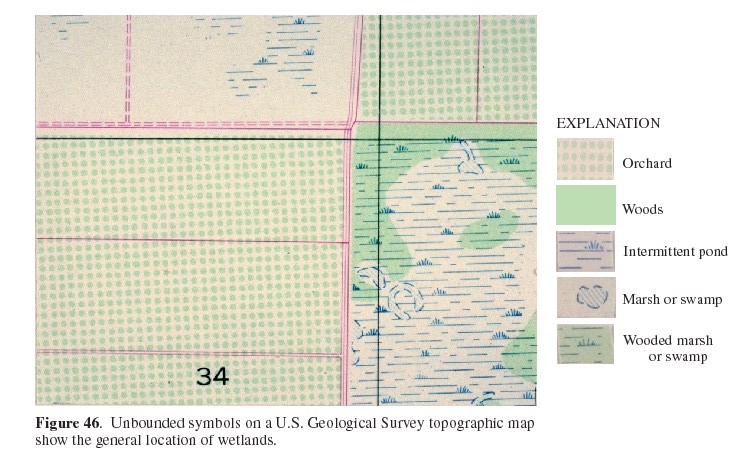
U.S. Geological Survey.--The USGS compiles, produces, and disseminates topographic, hydrologic, and geolog-c maps and digital data related to wetlands. The standard USGS 1:24,000-scale topographic map commonly is used as a base for wetland mapping by other Federal, State, and local agencies. However, because USGS maps depict wetlands as unbounded symbols (fig. 46), the maps cannot be used to establish exact boundaries for wetlands. Intermediate-scale (1:100,000) and large-scale maps (scales of 1:24,000 or greater) are used for project planning. Large-scale maps known as orthophoto quadrangles, which are made by manipulation of aerial photographs to achieve a positionally accurate photographic base map, are used as a base for State wetland mapping.
|
|||||||||||||||||||||||||||||||||||
COORDINATION OF FEDERAL WETLAND MAPPING EFFORTS |
||||||||||||||||||||||||||||||||||||
| Differing needs of various Federal agencies can require different types of maps or different map scales. However, many needs can be satisfied by common products, and efforts are being made to standardize maps and map products whenever possible or practical. Federal digital wetland mapping is coordinated by the Wetlands Subcommittee of the Federal Geographic Data Coordination group in an effort to meet requirements established by the Office of Management and Budget. The Office of Management and Budget requires agencies to develop a national digital spatial information resource in collaboration with State and local governments and the private sector. This requirement is for the purposes of (1) promoting the development, maintenance, and management of a national digital wetland data base; (2) encouraging the development and implementation of standards, exchange formats, specifications, procedures, and guidelines; (3) promoting interaction among other Federal, State, and local government agencies that have interests in the generation, collection, use, and transfer of wetland spatial data; (4) maintaining and disseminating information on the type and availability of wetland spatial data; and (5) promoting the concept of effective wetland management. | "Swampbuster" removes Federal incentives for the agricultural conversion of wetlands. | |||||||||||||||||||||||||||||||||||
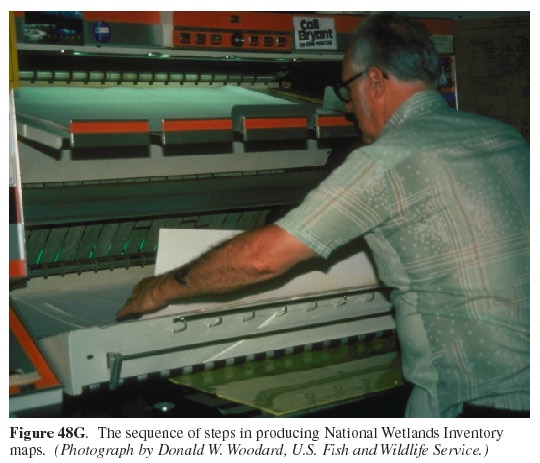
PRODUCING NATIONAL WETLANDS INVENTORY MAPS | ||||||||||||||||||||||||||||||||||||
| Most natural-resource inventories make
use of aerial photographs or satellite images combined with field
verification. The National Wetlands Inventory uses the best and most
appropriate aerial photographs available for mapping wetlands. The
principal data source in the early 1980's was the 1:80,000-scale,
high-altitude, black-and-white aerial photography acquired by the USGS
for topographic mapping and production of orthophoto quadrangles.
After the USGS began its National High-Altitude Photography Program,
1:58,000-scale color-infrared photographs for the entire country
became available; the National Wetlands Inventory uses these
photographs extensively. In 1987, the USGS replaced the National
High-Altitude Photography Program with the National Aerial Photography
Program, which produces 1:40,000-scale color-infrared photographs; the
National Wetlands Inventory uses these photographs as well. In some
cases, the National Wetlands Inventory uses supplementary photography,
such as some 1:60,000-scale color-infrared photographs of the prairie
pothole region of the northern Great Plains, which were acquired from
the National Aeronautics and Space Administration.
|
Stereoscopic color-infrared photographs are best for identifying and delineating wetlands. Color, texture, and pattern are important features of wetland vegetation and background soils. A combination of vegetation factors produce a specific response or signature on the photograph (Wilen and Pywell, 1992). These vegetation factors include leaf size, shape, structure, and arrangement; branching pattern; height; growth habit; and color. Determining the boundary of a wetland is the most difficult part of mapping. Normally, transitions are found at the boundary from upland vegetation to wetland vegetation, from nonhydric to hydric (wetland) soils, and from land that is not flooded to areas that are subject to flooding or saturation. On color-infrared photographs, water generally shows as a distinctive black and blue-black color because of its lack of reflectance. Wetlands that have canopy openings and contain standing water exhibit this signature along with assorted wetland-vegetation signatures. Saturated soils show darker tones because of the nonreflectance of the soil-water component. Even when wetland basins are dry, the silt, clay, and other fine-grained materials hold more water than the upland soils hold, which results in a distinctive dark color because of the lack of infrared reflectance. | The National Wetlands Inventory uses the best and most appropriate aerial photographs available for mapping wetlands. | ||||||||||||||||||||||||||||||||||
|
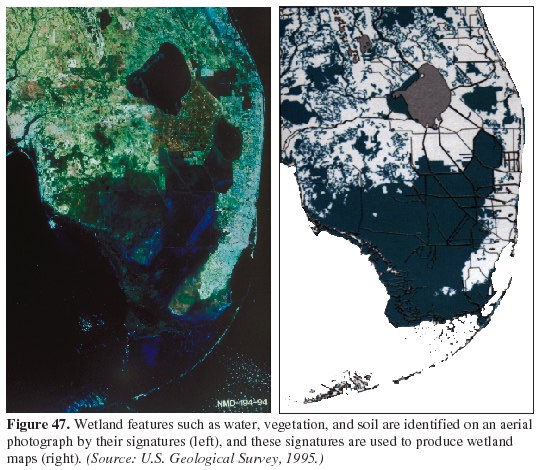
Vegetation characteristics help to identify wetlands. Wetland
vegetation generally is more dense, more crowded, and more
concentrated than upland vegetation. Wetland vegetation normally
exhibits a higher degree of lushness, vigor, and intensity than does
upland vegetation. Even wheat grown in a dry wetland basin has a
distinctive signature; it is more vigorous because of extra moisture
in the basin. Dead and dying vegetation in flooded wetland basins
also has distinctive signatures. When physiographic positions are
associated with the vegetative characteristics described above,
wetland locations become more obvious on an aerial photograph (fig. 47).
|
Patterns, or the repetition of the spatial arrangement, of vegetative types
also provide important clues in the identification of wetlands. Basins
that have a semipermanently flooded center may have a seasonally flooded
band around the center and a temporarily flooded outer band. Patterns are
not restricted to vegetation -- they can include drainage patterns and
land-use patterns. Unplanted basins in farm fields might indicate
wetlands; land-cover patterns such as ridges and swales help separate
uplands and wetlands. When wetlands are being mapped, the photointerpreter
closely checks areas indicated by swamp symbols as wetlands on USGS
topographic maps and NRCS soil survey maps to ensure their possible
inclusion as wetlands; such areas are considered wetlands unless strong
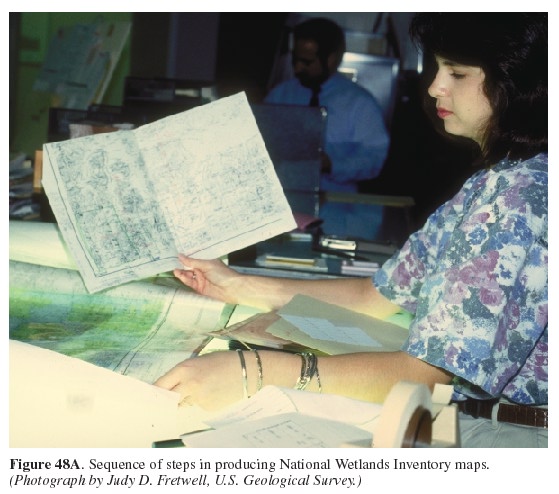
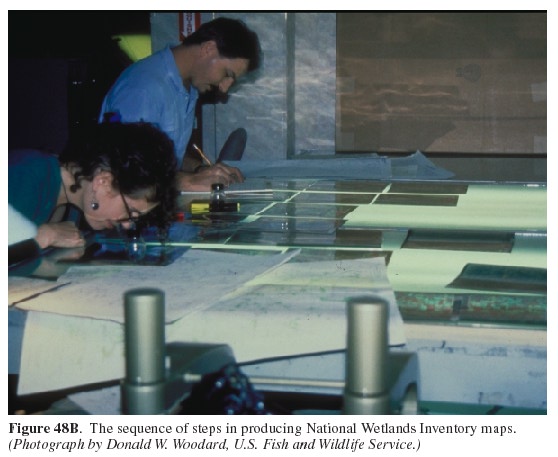
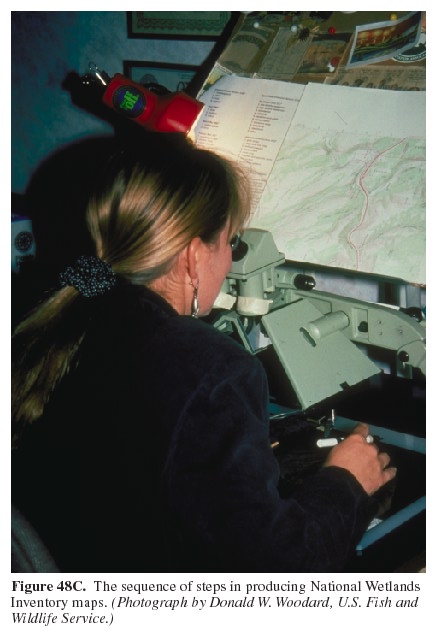
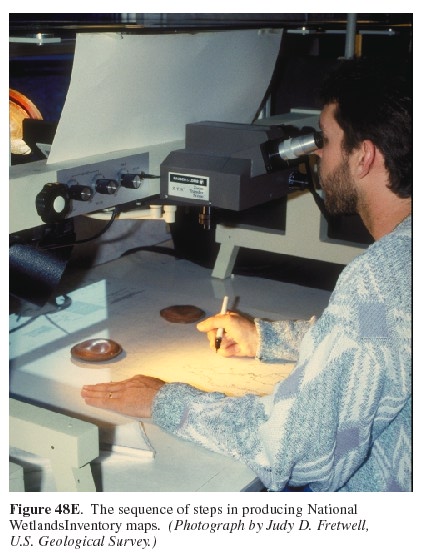
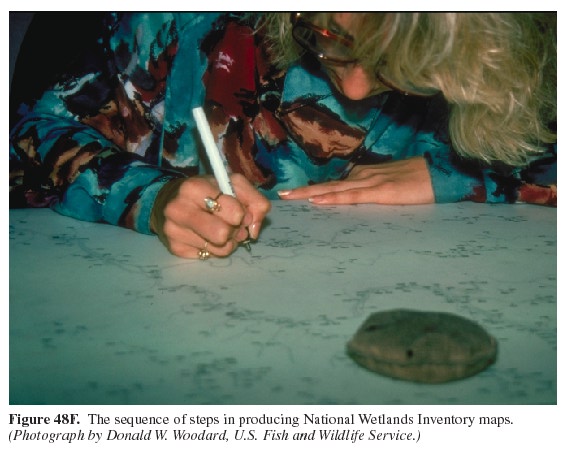
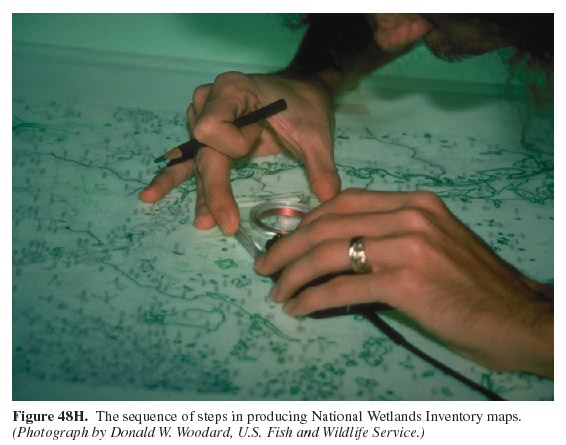
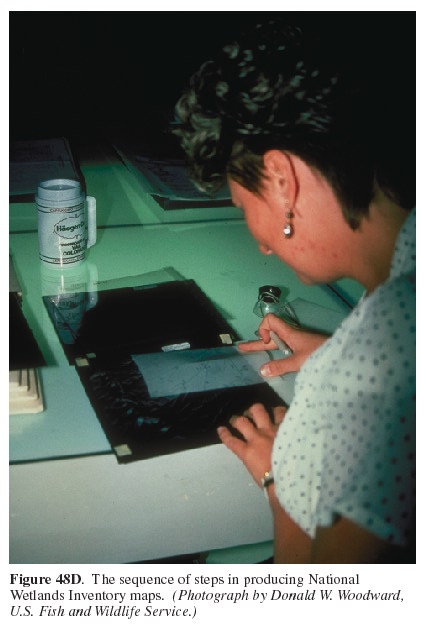
evidence indicates otherwise. A typical National Wetlands Inventory map consists of wetland boundaries added to a black-and-white version of a 1:24,000-scale USGS topographic base map. Wetlands are classified according to guidelines developed by Cowardin and others (1979). (See article "Wetland Definitions and Classifications in the United States" in this volume.) These wetland classifications are shown on the map as alpha-numeric codes that are identified in a map explanation at the bottom of the map. Many steps are involved in the production of a wetland map from selecting the sites for field verification to delineation, quality control, and production of the final map product (fig. 48). All National Wetlands Inventory photointerpreters are trained extensively in wetland identification, the FWS wetland classification system, and the field identification of wetland plants and soils in order to ensure the best quality, most accurate maps.
|
|||||||||||||||||||||||||||||||||||
|
||||||||||||||||||||||||||||||||||||
HOW AND WHERE TO GET NATIONAL WETLANDS INVENTORY MAPS | ||||||||||||||||||||||||||||||||||||
| Maps of the National Wetlands Inventory can be
acquired from 33 State-run distribution centers, 6 USGS Earth Science
Information Center regional offices, or by calling the USGS national
toll-free number: 1-888-ASK-USGS. Maps can also be viewed at the
Library of Congress and the Federal Depository Library System and
downloaded cost-free through the National Wetlands Inventory Home Page
on the Internet at http://www.nwi.fws.gov. The six
regional USGS Earth Science Information Centers provide online
computer links to the National Wetlands Inventory map data base, which
contains current information about the availability and production
history of National Wetlands Inventory maps and digital data. Digital
data are available in Digital Line Graph 3 (DLG3) optional or
Geographic Resources Analysis Support System (GRASS) formats; latitude
and longitude, State Plane Coordinates, or Universal Transverse
Mercator (UTM) coordinate systems; and 9-track, 8-mm, or 1/4-inch
cassettes in UNIX-TAR or ASCII tape formats. Other products available
at cost include acreage statistics by quadrangle, county, or study
area and color-coded wetland maps.
|
||||||||||||||||||||||||||||||||||||
References Cited | ||||||||||||||||||||||||||||||||||||
|
|
|||||||||||||||||||||||||||||||||||
FOR ADDITIONAL INFORMATION: | ||||||||||||||||||||||||||||||||||||
|
Todd H. Votteler, 4312 Larchmont Avenue, Dallas, TX 75205 |
Thomas A. Muir, U.S. Geological Survey, 413 National Center, Reston, VA 22092 |
|||||||||||||||||||||||||||||||||||
Maintainer: Water Webserver Team Last modified: Tue Jan 29 08:34:45 EST 2002