
Isotope Tracers home > Online Reports > SF Estuary Online Report Intro Page > Full Report
Tracing nutrient and organic matter sources and biogeochemical processes in the Sacramento River and Northern Delta: proof of concept using stable isotope data
Carol Kendall*, Megan B. Young, Steven R. Silva (USGS-Menlo Park); Tamara Kraus (USGS-Sacramento); Sara Peek (USGS-Menlo Park); Marianne Guerin (RMA-Fairfield)
Citation: Kendall, C., Young, M.B., Silva, S.R., Kraus, T.E.C., Peek, S., and Guerin, M., 2015. Tracing nutrient and organic matter sources and biogeochemical processes in the Sacramento River and Northern Delta: proof of concept using stable isotope data. U.S. Geological Survey, Data Release, http://dx.doi.org/10.5066/F7QJ7FCM
For further information contact Carol Kendall (ckendall@usgs.gov).
Version 1.01 -- Last modified September 15th, 2015
Abstract
Isotope and chemical data for samples collected during several overlapping studies in the Sacramento River and Delta conducted 2009-2011 is presented to evaluate the potential usefulness of stable isotope techniques for testing hypotheses about sources of nutrients and algae, and biogeochemical processes in section of the San Francisco Estuary. These data are used to provide an independent test of the hypothesis that ammonium derived primarily from waste-water treatment plants was inhibiting phytoplankton uptake of nitrate. These data represent approximately monthly samples from 15-20 sites along transects of the river and delta and were analyzed for the stable isotopic compositions of ammonium, nitrate, particulate organic matter, dissolved organic carbon, and water then used to demonstrate the viability of assessing the temporal and spatial variations in the sources, transport, and sinks of nutrients and organic matter in the Sacramento River and Delta Another main focus was to assess whether there were significant differences between the chemistry and isotopic compositions of mainstem Sacramento River samples and (1) samples from tributaries within the Cache/Yolo Slough Complex, and (2) samples from the main two distributaries of the Sacramento River downstream of the waste-water treatment plant: Miner Slough and Steamboat Slough.
Using these data we present (1) "proof of concept" of the usefulness of isotope techniques combined with water chemistry and hydrological modeling in this ecosystem, (2) key findings from some of the ongoing parts of the studies, and (3) downloadable Excel files of the relevant isotope and chemistry data with associated metadata to facilitate these data being used for other investigations. The rationale was that if isotope techniques showed promise in identifying sources and processes in this ecosystem, a comprehensive multi-isotope approach would later be used for quantifying nutrient and organic matter sources and biogeochemical processes relevant to questions about causes of environmental problems. These more quantitative assessments are in progress.
Introduction
A stepwise reduction in abundance of four pelagic species of fishes (delta smelt, long fin smelt, juvenile striped bass, and threadfin shad) in the San Francisco Bay (SFB) and Sacramento San-Joaquin Delta (Delta) has been documented since 2001 and is now known as the Pelagic Organism Decline (POD) (Sommer et al., 2007). A number of hypotheses have been proposed to determine the major drivers of the POD, including the effects of changing nutrient speciation and concentrations (particularly ammonium) on the food web, predation by invasive clams on phytoplankton stocks, water exports from the Delta, changes in runoff and turbidity due to land-use practices, and toxins from urban, industrial, or agricultural sources. The POD is now thought to be the result of multiple causes but is significantly correlated with a decline in phytoplankton stocks and possibly to changes in phytoplankton species abundance. Predation by invasive clams (Cloern and Jassby, 2012), and changes in nutrient dynamics (Parker et al., 2012; Glibert et al., 2014; Senn and Novick, 2014) are both suspected to be among the most important contributors to phytoplankton declines. Nutrient dynamics are directly related to both phytoplankton growth and changes in species distribution; therefore, there is an urgent need to understand the relations between dissolved inorganic N (DIN) type and concentration, phytoplankton growth and community structure, and other processes in the Sacramento River (SR), Delta, and, to a much lesser extent, the lower San Joaquin River (SJR) (Figure 1). These rivers are the main sources of nutrients to food webs in the Delta and Suisun Bay. Waste Water Treatment Plants (WWTPs) in the region, especially ones in Sacramento and Stockton, are major sources of nutrients to the rivers (Senn and Novick, 2014). Dugdale and colleagues (2007) have suggested that high concentrations of ammonium (NH4) from the WWTPs may inhibit nitrate (NO3) uptake by phytoplankton and perhaps alter community structure; hence, excess NH4 derived mainly from WWTPs may be a significant contributor to POD in the Delta and Bay (Dugdale et al., 2007; Parker et al., 2012).
The evidence for NH4 inhibition of NO3 uptake by phytoplankton, which results in smaller algal blooms, was provided by several studies of spatial and temporal changes in nutrient and chlorophyll-a concentrations combined with N and C uptake studies in the Sacramento River downstream of the Sacramento Regional Water Treatment Plant (SRWTP) (Dugdale et al., 2007; Parker et al., 2012). In these studies, phytoplankton C productivity and NO3 and NH4 uptake rates were estimated by dual-labeled 13C and 15N isotope tracer incubations (Parker et al., 2012). In such studies, isotope-labeled materials are added to water samples removed from the water column and incubated in chambers under conditions similar to the natural environments. After a specified amount of time, subsamples are analyzed to determine how much of the isotopically labeled material ended up in different components in the water sample. Results from these studies represent "potential uptake rates" and are susceptible to artifacts associated with laboratory studies that might not be representative of natural conditions.
A powerful and more realistic means of assessment of this phenomenon in the field is provided by measuring the actual stable isotopic compositions (i.e., the natural abundance stable isotope ratios) of the co-existing NH4, NO3, and algae in water samples which allows for evaluation of their sources and biogeochemical reactions. Applications of natural abundance stable isotope techniques to tracing sources and processes in watersheds began in the 1970s and have increased dramatically over the last decades (Kendall and McDonnell, 1998). Good recent review chapters for using isotopes to trace sources and sinks of organic matter and nutrients include Finlay and Kendall (2007) and Kendall et al. (2007). In the last 20 years, there have been numerous isotopic studies of the sources and processes affecting NH4 and/or NO3 in estuaries (e.g., Cifuentes et al. 1989; Sebilo et al. 2006; and York et al. 2007), including a USGS study in the San Francisco Bay (Wankel et al. 2006).
This report describes findings from several overlapping studies in the Sacramento River and Delta conducted 2009-2011 to evaluate the potential usefulness of stable isotope techniques for testing hypotheses about sources of nutrients to algae, and the biogeochemical processes affecting their concentration and isotopic signature in these ecosystems. One main focus of the studies was to provide an independent test of the hypothesis that NH4 derived from WWTPs was inhibiting phytoplankton uptake of NO3. This goal was accomplished by collecting ~monthly samples from 15-20 sites along transects of the Sacramento River and Delta to assess the temporal and spatial variations in the sources, transport, and sinks of nutrients and organic matter in the Sacramento River and lower Delta – and then determining the stable isotope composition of ammonium, nitrate, particulate organic matter, dissolved organic matter, and water.
The objectives of this report are to (1) demonstrate "proof of concept" of the usefulness of isotope techniques combined with water chemistry and hydrological modeling for understanding nutrient sources and cycling in this ecosystem, (2) present key findings from some of the ongoing parts of the study, and (3) provide downloadable Excel files of the relevant isotope data to facilitate use of these data for other investigations. We anticipate that several interpretive journal articles will be published in the future using a subset of these data.
Objectives of the Study
A series of pilot studies was conducted 2009-2011 to obtain more data on the critical region in the San Francisco Estuary from the Sacramento Regional Water Treatment Plant (SRWTP) on the Sacramento River downstream to Rio Vista, near the lower Yolo Bypass, and elsewhere in the Delta, to investigate whether stable isotope techniques can:
Identify sources of ammonium (NH4), nitrate (NO3), and organic compounds (especially particulate organic matter (POM) as a proxy for algae) at key locations.
Determine relative biogeochemical reaction rates of NH4 and NO3 at key locations, especially the relative utilization of NH4 and NO3 by algae.
Identify the geographic sources of dissolved and particulate organic matter (especially of algal origin) found at key locations (e.g., major fish nursery areas).
These USGS studies were partially funded first by the California State Water Contractors (now State and Federal Contractors Water Agency, SFCWA) and later by the California Interagency Ecological Program (IEP).
The rationale was that if isotope techniques showed promise in identifying sources and processes in this ecosystem, a comprehensive multi-isotope approach would later be used for quantifying nutrient and organic matter sources and biogeochemical processes relevant to questions about causes of the POD. Quantitative assessment of sources of the nutrients and organic matter and biogeochemical reaction rates was more complicated than expected, largely because of the high degree of spatial and temporal variability in this complex ecosystem driven by variations in effluent concentrations and travel times combined with tidal cycles; hence, preparation of journal papers has been delayed. Therefore, we present here a mostly qualitative assessment of the results so that our current findings are available for other investigations while our papers are in progress.
Study Area
The Sacramento River is the larger of the two main rivers that drain into the San Francisco Estuary. Both the Sacramento and the San Joaquin Rivers derive most of their water from snowmelt and rain in the Sierra Nevada Mountains to the east, and then flow westward across the Central Valley and converge in the San Francisco Delta near the city of Pittsburg. The Sacramento River drains the northern part of the Central Valley and the San Joaquin drains the southern part (Figure 1). River flows are largely controlled by reservoir storage, dam releases, diversions, as well as local storm events.
Figure 2 shows a large-scale map showing the locations of the sites sampled during this study, with different symbols for different site types: mainstem Sacramento River, distributary (diversions of the Sacramento River into different channels), and slough (tributary) sites. The site names and river mile (RM) values of discrete sampling sites are shown in Table 1.
River miles were obtained using the program Topo, which uses USGS topographic maps. The latitude and longitude of the sites were used to plot the sites on the maps and the program's measuring tool was used to measure the distance between the sites and integer river mile markers provided with the maps. The confluence of the San Joaquin River (SJR) and the larger Sacramento River (SR) is denoted as RM0 (i.e., River Mile = RM = 0). Sites upstream of RM0 have positive values (e.g., RM5, RM15), and sites downstream of RM0 have negative values (e.g., RM-5, RM-15).
RM values in the text are usually rounded off to the nearest integer for ease in reading; see Table 1 for more precise RM values for each site. Figure 3 shows some of the names of sites on the mainstem Sacramento River, plotted versus their respective RM values. This figure is provided to make it easier to compare differences between sites, when the sites are identified by sites names and/or RM values, than by searching for the information in Table 1.
A major contributor of nutrients to the Sacramento River is the Sacramento Wastewater Treatment Plant (SRWTP) located approximately 20 miles downstream of the city of Sacramento (Figure 2). Treated wastewater effluent from the wastewater treatment plant (WWTP) enters the Sacramento River at approximately RM46. The WWTP does not currently employ tertiary treatment processes (i.e., nitrification and denitrification), thus during the study period effluent contained high concentrations of NH4 (~2000 µM) and non-detectable to low (< 7 µM) concentrations of NO3. Due to variable river and effluent flows, effluent can make up anywhere from 0-6% of the total river volume; more typically effluent comprises about 1-3% of the river flow resulting in wastewater derived ammonium concentrations in the river just downstream of the outflow pipe of ~20-50 µM (O'Donnell, 2014).
RM values in the text are usually rounded off to the nearest integer for ease in reading; see Table 1 for more precise RM values for each site. Figure 3 and Figure 4 show some of the names of sites on the mainstem Sacramento River, plotted versus their respective RM values. Figure 5 shows the names for the sites downstream of Rio Vista, in the Sacramento River and in the Bay. These figures are provided to make it easier to compare differences between sites, when the sites are identified by sites names and/or RM values, than by searching for the information in Table 1.
Study Design
We proposed in March 2009 that the fastest and most economical approach for accomplishing the research objectives listed above was to piggyback the collection and analysis of several types of isotope samples onto existing monitoring programs in the Sacramento River and Delta being conducted approximately monthly by two different teams: the Dugdale SFSU (San Francisco State University) team and the Foe CVRWQCB (Central Valley Regional Water Quality Control Board) team. Advantages of this approach include: (1) both groups have years of experience sampling along transects in the SFE; (2) their studies were starting in March 2009; (3) the costs for collecting water samples from relevant sites and analyzing them for chemical composition (but not the collection or analysis of isotopes) were already being covered by other programs; (4) the field teams were either willing for us to join their sampling campaigns and collect our isotope samples ourselves (e.g., the Dugdale team), or agreed to collect and then express mail the samples to us (e.g., the Foe team); and (5) our USGS group had been successively piggybacking isotope-oriented investigations onto Federal and State water quality, ecological, and atmospheric monitoring programs for over 25 years (Kendall et al., 2010).
The goals of the Dugdale transects were to "(1) understand the distribution and biological processing of different forms of DIN in the Sacramento River and (2) describe how discharge of wastewater NH4 effluent influences phytoplankton biomass and primary productivity in the Sacramento River and downstream to the Northern SFE" (Parker et al., 2012). The Foe transects were part of a CVRWQCB-organized NH4 monitoring project on the Sacramento River, with the primary purpose to "characterize the effect of SRWTP effluent on these concentrations (i.e., nutrients and chlorophyll a) over an annual hydrologic cycle and compare the values with reported toxicity endpoints for sensitive local aquatic organisms" (Foe et al., 2010).
Isotope samples were collected from 3 different transect studies (see Table 1). The first two sets of transects (e.g. Dugdale and Foe) were intended to yield a comprehensive suite of isotope data for splits of the samples collected approximately monthly and analyzed for water chemistry. Piggybacking isotope sampling on these existing sampling programs provided a quick and cost-effective strategy for obtaining samples with ancillary data. The collection of chemistry and isotope samples during the third transect (the "slough transect") was intended to assess whether there were significant differences in the chemistry and isotopic compositions of the 3 main channels of the Sacramento River: the mainstem, Miner Slough, and Steamboat Slough (the latter two channels are "distributaries" that transport Sacramento River water into the Cache/Yolo Slough Complex; see Figure 4).
Dugdale transects: These are two transects conducted March and April 2009 in the Sacramento River and Delta by Richard Dugdale's SFSU team. We boarded their research vessel and collected our isotope samples at each site when they collected their chemistry samples.
Foe transects: These are 11 river transects conducted ~monthly May 2009 through February 2010 in the Sacramento River and Delta by Chris Foe and his team (California Central Valley Regional Water Quality Control Board, CVRWQCB). Foe collected isotope samples for us at each site and date when he collected his water chemistry samples. Only the samples from the Sacramento River and Northern Delta, not the San Joaquin and Southern Delta samples, will be discussed in this report.
Slough transects: These are 9 transects (10 if we include one transect deliberately conducted on flood tide to contrast with a transect conducted on ebb tide the day before) conducted ~monthly April 2011 to December 2012 in the Sacramento River and Delta by the USGS. Since most of the 2012 samples have not been analyzed for isotopes yet, we only report the 2011 data. The chemistry data were graciously provided by Randy Dahlgren (UC Davis). For each transect, samples were collected from the mainstem Sacramento River, two samples on each of the two distributaries (near the mouth and mid-way to where the distributary diverges from the mainstem Sacramento River), and samples from several important sites in the Cache/Yolo Complex sloughs (including the ones previously sampled by Foe).
The downloadable Excel file (http://water.usgs.gov/nrp/isotope-tracers/Kendall_etal_2015_DRAFT_data.xlsx) contains a complete list of the site names, locations, dates, and times when samples were collected; plus the isotope data and other useful meta-data.
Background about the Use of Isotopes
Isotopes are a popular tool for environmental studies because sources and sinks of various materials can often be identified using stable isotopes. Isotopes provide "fingerprints" of different types and sources of nutrients (e.g., NO3 and NH4, from waste water or agriculture) and organic matter (algae vs terrestrial organic matter), and of biological processes including the conversion of nitrate to ammonium (nitrification) uptake of nutrients into biomass (assimilation), and later degradation of biomass (remineralization). This information provides a better understanding of the system than standard chemical measurements alone can provide (Kendall et al., 2007; Finlay and Kendall, 2007). Furthermore, isotopes are a very cost-effective "add-on" to routine monitoring programs, requiring little additional effort by the field crews (Kendall et al., 2010). Compared with the costs associated with the field collections and basic chemical measurements, little additional resources are required to analyze selected constituents for isotopic composition. In other words, isotopes provide a "big bang for the bucks".
Table 2 provides a brief explanation of the interpretive value of the different isotope tracers used in this report.
Conceptual Models
Figure 6 shows a simplified N cycling model for the San Francisco Estuary. There are several significant N sources to the San Francisco Bay estuary, including waste water treatment plants (WWTPs), agricultural drains, minor tributaries, and wetlands. Each of the N pools (e.g. NH4, NO3, phytoplankton) illustrated in Figure 6 can have a distinct range of δ15N values, making δ15N (combined with other isotopes of the constituent, e.g. δ18O of NO3, or δ13C and δ34S of algae) useful tools for determining the source of the N in these "pools". Furthermore, biogeochemical processes such as nitrification (the oxidation of NH4 to NO3) or assimilation (the uptake of NO3 and/or NH4 by phytoplankton) that convert one constituent to another often cause distinctive changes in δ15N values. Hence, the magnitude and sign of a change in isotopic composition between pools (e.g., NO3-δ15N and algae-δ15N), or between successive downstream samples of the same constituent, may be suggestive of one process or another, or may eliminate a process as implausible.
Processes which consume NO3 (e.g., uptake and denitrification) cause a distinctive "coupled" shift in δ15N and δ18O values, with both the δ15N and δ18O of the residual NO3 becoming increasingly higher because biological processes preferentially utilize the NO3 with both lower δ15N and δ18O values (because the bonds of the lower-mass isotopes require less energy to break), resulting in progressively higher δ15N and δ18O values in the residual material. Hence, this preferential utilization of the lower mass ("lighter") isotopes can result in significant isotopic differences between the newly formed material (product) and the residual "reactant" or "substrate" material. This partitioning of the isotopes between compounds is called isotope fractionation (ε).
Figure 6 shows that algae (used in this report as a synonym for phytoplankton) can utilize N from NO3, N from NH4, and/or N from atmospheric N-fixation,. Since N fixation is believed to be a negligible source of N to algae in the Delta, the main N sources for algae growth in this system are NO3 and NH4. For our goal of evaluating whether stable isotopic techniques can provide an independent test of the hypothesis that excess NH4 inhibits the production of large algal blooms, the δ15N values of NO3 and NH4 available to the algae growing in key locations must be isotopically distinctive.
Figure 7 is a cartoon showing how two common processes in the Sacramento River -- nitrification followed by N uptake -- can result in significant differences between the δ15N of the NO3, NH4, and algae pools. Assuming fractionation by nitrification involves a single-step unidirectional reaction in a closed system, the relationship between changes in δ15N and in NH4 concentration can be described by classical "Rayleigh" fractionation (Mariotti et al., 1981), with the reaction favoring the preferential incorporation of 14N over 15N into NO3, leaving behind a residual pool of reactant (i.e., NH4) enriched in 15N. This leads to exponentially higher δ15N-NH4 values as the reaction proceeds. The overall effect of this fractionation is that the pool of available (residual) NH4 has a higher δ15N than the pool of available NO3. Because N uptake by algae favors the preferential incorporation of 14N-containing compounds, regardless of N source (NO3 or NH4), the δ15N of the newly formed algae will be lower than the δ15N of the N source. This is illustrated in Figure 7 by the lower positions of the green algae pools (boxes). A caveat: if the algae assimilate the entire amount of the N source, there is no isotope fractionation and the final δ15N of the bulk algae will be the same as the δ15N of the original total amount of the N source.
Figure 8 is another cartoon showing typical δ15N values for NH4, NO3, and algae in the Delta. It shows how the δ15N of NH4 and NO3 progressively change with travel down the Sacramento River in response to nitrification, how the δ15N of algae would have a lower δ15N than the dominant N source, how the δ15N of the algae "tracks" the δ15N of the dominant N source being assimilated, and how the algae δ15N values would be expected to change at river mile 20-25 if the algae switched from mainly assimilating NO3 to mainly assimilating NH4.
In theory, if the δ15N values of NH4 and NO3 are sufficiently distinctive, the measured values of the δ15N of algae can be used to quantify how much of the N in algae is derived from NH4 versus NO3. However, except for POM samples collected during algal blooms, a significant fraction of the bulk POM sample collected consists of terrestrial organic matter and bacteria, in addition to algae. Hence, before the relative uptake rates of NO3 versus NH4 to algae can be estimated, the isotopic composition of the algal fraction of the POM must be calculated from the δ15N, δ13C, C:N, and perhaps the δ34S of the bulk POM. A thorough discussion of the several lines of ongoing research towards this goal is beyond the scope of this report, but a brief description is given below in a later section of the report (Calculating relative contributions of NH4 and NO3 to algal uptake).
There are many complexities associated with attempting to perform nutrient and isotopic mass balance calculations to quantify sources and sinks. Among them are temporal variations in the relative contributions of several different water sources to each location (Figure 9), and daily variations in river stage (Figure 10) in response to tidal cycles. Tidal mixing -- the mixing of adjacent waters due to tidal forcing -- has a significant effect on the chemistry of samples collected on downstream transects since the tide turns every 8-14 hours, making it difficult to collect all the samples on the ebb (seaward-moving) tide. Hence, although the ideal sampling transect would be to collect samples from the exact same parcel of water as it flowed downriver (a true Lagrangian approach), the reality is that sampling progressively downstream on the same outgoing tide is the best approach that can be managed with a single boat, given all the low-speed zones and low bridges in the Sacramento River. Unavoidable collection of samples that are not from the exact same parcel of water can introduce considerable variability into downstream concentrations and isotopic compositions if there is much spatio-temporal variability in effluent concentration and composition (O'Donnell, 2014).. This is because the amount of isotope fractionation for processes like nitrification and assimilation is dependent on the starting [NH4] and [NO3] concentrations, their initial isotopic compositions, and then the travel time since the water parcel received effluent from the SRWTP.
Ongoing studies are attempting to incorporate the hydrological and water quality information from the DSM2 1-dimensional model and the RMA 2-dimensional model of the Delta (e.g., contour plots of salinity and turbidity, residence time calculations) to inform and constrain the sources and transformations of nutrients and to identify hydrodynamic and salinity conditions at the times and locations of data collection (e.g., stage and flow, water temperature, and volumetric fingerprints). Details on the DSM2 model and applications can be found at: http://baydeltaoffice.water.ca.gov/modeling/deltamodeling/models/dsm2/dsm2.cfm
An overview of the RMA model (RMA, 2005) computational engine is given at: http://ikingrma.iinet.net.au/OVERVIEW.html
Methods
Sample collection
Dugdale transects
Both of the Dugdale transects (March and April 2009) on the Sacramento River were sampled over two days. On the first day, 11 Sacramento River sites, from the I-80 bridge (RM63) to Rio Vista (RM12), plus 2 sites in the Cache/Yolo Slough Complex, were sampled; on the second day, 11-13 samples were collected from Rio Vista downstream into San Pablo Bay (Table 1, Figure 2). Hence, for each transect there is a pair of samples from Rio Vista. Each day, sampling started just after high tide at the most upstream site and sites were sampled downstream on the outgoing tide (Figure 10). However, slack tide was encountered mid-day, resulting in the samples in the afternoon of each day being collected on rising (incoming) tides.
Figure 11 and Figure 12 show the river stage, net flows, NO3 and NH4 concentrations, and δ15N values for the March and April 2009 transects, respectively. Differences in the chemistry and isotopic compositions of the paired samples from Rio Vista (RM12) collected during each transect reflect the effects of sampling on different tidal cycles. The downstream trends in stage and flow in March and April are very similar, showing the consistency in the sampling design. While the temporal variations in the concentrations of NH4 for the two dates are similar, suggesting roughly similar concentrations of effluent-derived ammonia, the NO3 concentrations in the Sacramento River water are about 4 times higher in March than April.
At each site, the boat stopped near the center of the channel and the Dugdale team collected water samples at ~1m depth using sets of Niskin bottles. These samples were analyzed in Dugdale's SFSU lab for concentrations of nutrients, organics, and chlorophyll; phytoplankton N and C uptake rates; and other parameters. See Parker et al. (2010, 2012) for more specifics about sampling protocols.
Grab samples were collected by hand for isotopic analysis by USGS team members from the upper ~0.5m of the water column. Although we collected two 1L bottles of water for isotopic analysis at all locations where the Dugdale team collected their own chemistry samples, this report only presents the data for Sacramento River and Delta sites. The bottles were kept on ice in coolers and returned to the lab the evening of the second sampling day.
Foe transects
Between May 2009 and February 2010, 11 two-day Sacramento River and Delta transects were conducted by the Foe CVRWQCB team. Samples for each transect were collected from upstream to downstream, starting at high tide at Tower Bridge (RM59) on the first day and following the ebb (outgoing) tide down river to Rio Vista (RM12), collecting samples from 6 Sacramento River sites; samples were then collected from 4 Cache/Yolo Slough Complex sites (Table 1, Figure 2). On the second day, samples were collected from any sites missed on the first day and then from 2 Sacramento River sites downstream of Rio Vista (at RM9 and RM-4); the boat then continued sampling on the San Joaquin River.
At each site, grab samples were collected near the center of the channel at ~1m depth. Similar to the Dugdale transects, the Foe team collected samples to determine constituent concentrations (see Foe et al. 2010 for specifics about sampling protocols and analytical methods); in addition, the Foe team collected three 1L bottles of water for isotopic analysis. At the end of each day, samples for isotope analysis were packed with ice into coolers and express mailed to the USGS Menlo Park Stable Isotope Lab (MPSIL). Although we have isotope data for samples at all locations where the Foe team collected samples during this time period, this report only includes the data for the Sacramento River and Northern Delta sites (and not any of the San Joaquin River and Southern Delta sites). The chemistry data reported here (nutrients, organics, chlorophyll, etc.) were provided by Randy Dahlgren (UC Davis) and are reported in Foe et al. (2010).
Slough transects
Between April 2010 and December 2012, 1-day Sacramento River and Delta transects were conducted ~monthly by the USGS team (Table 1, Figure 2). For each transect, samples were collected from: 5 sites on the Sacramento River, from Courtland (RM34) to Isleton (RM17), 4 sites on Sacramento River distributaries (Miner and Steamboat Sloughs: each sampled near the mouth and at ~5 miles upstream), and the same 4 sites in the Cache/Yolo Slough Complex sampled by the Foe team; for many transects, an additional slough site was also sampled. Except for a second October 2011 transect collected deliberately on flood tide to compare with samples collected at the same sites the previous day on ebb tide, all the other transects were collected on ebb tide.
At each site, samples were collected by boat at the center of the channel at ~1m depth by USGS team members; five 1L bottles were filled at each site and the bottles were kept on ice in coolers. At the end of the day, two 1L bottles were delivered to Randy Dahlgren's lab at UC-Davis for the same suite of chemical analyses (nutrients, organics, chlorophyll) performed on Foe transect samples, and three 1L bottles were returned to the USGS Menlo Park stable isotope lab (MPSIL) for isotopic analysis. Since most of the 2012 samples have not been analyzed for isotopes yet, we only report the April to December 2011 data. The chemical data were graciously provided by Randy Dahlgren (UC Davis); sample processing and analysis followed the same procedures as those used for the Foe transects.
Isotope analysis methods
All water samples were packed with ice in coolers and express mailed or transported to the Menlo Park Stable Isotope Lab (MPSIL) either on the day of collection or within 24 hours of collection. Upon arrival at the MPSIL, the samples were kept chilled or frozen (depending on their status in the coolers they arrived in), and were immediately inventoried, filtered, and preserved as needed by freezing, chilling, or acidification.
All isotope samples were analyzed in the MPSIL, which is part of the USGS Isotope Tracers Project labs in Menlo Park, California. We had intended for all the samples to be analyzed for δ15N of NH4; δ15N and δ18O of NO3; δ15N, δ13C, δ34S, C:N, and C:S of POM; δ13C of dissolved organic carbon (DOC); and δ18O and δ2H of water However, some samples had [NH4] too low for analysis with current methods, some samples had insufficient POM remaining after δ15N and δ13C analysis for subsequent δ34S analysis, and for some analyses (mainly DOC-δ13C and water δ18O and δ2H) the datasets are currently incomplete because of instrument problems. The isotopic compositions are included in the downloadable Excel files: (http://water.usgs.gov/nrp/isotope-tracers/Kendall_etal_2015_DRAFT_data.xlsx). When more data are available, the Excel file will be updated. The isotope data are reported in permil (‰) relative to the usual international standards: Air for δ15N, VSMOW for δ18O and δ2H, VPDB for δ13C, and CDT for δ34S.
All NH4, NO3, and H2O samples were prepared for isotopic analysis in duplicate (concentrations permitting). 10-15% of DOC and POM samples were prepared in duplicate. More replicates were later analyzed if the duplicates did not agree within acceptable limits, if the yields were abnormal, or if the isotope data were significantly different than spatially adjacent samples or otherwise suspicious. All isotopic analyses were conducted with blanks and multiple isotopic standards according to established methods. More specifics about these methods are given below:
POM-δ13C, δ15N, and C:N: The samples are collected, filtered through 0.7μm pre-combusted glass fiber filters, prepared, and analyzed following the method described in Kendall et al. (2001), using an Optima mass spectrometer. Samples are weighed in silver boats and then vapor acidified to remove any carbonate prior to analysis. C:N values are reported as atomic (at) ratios.
POM-δ34S and C:S: The analysis of POM for δ34S generally requires a separate analysis, and not all samples had sufficient POM for δ34S analysis. Samples are prepared in the same way as for δ13C and δ15N except that samples for δ34S analysis do not need to be acidified and are weighed into tin boats instead. POM samples are analyzed for δ34S on the Optima mass spectrometer, per the method described in Fry et al. (2002), with the addition of a cryofocus. C:S values are reported as atomic (at) ratios.
NO3-δ15N and δ18O: Samples are analyzed using a minor modification of the Sigman et al. (2001) and Casciotti et al. (2002) microbial denitrifier method, using a custom-designed "AutoScott" autosampler connected to an IsoPrime mass spectrometer. Samples where [NO2] is more than ~5% of the [NO2+NO3] are analyzed after removal of the NO2, using the method of Granger and Sigman (2009). Unless otherwise noted, "NO3" is used in the text below to mean "NO3+NO2".
NH4-δ15N: Samples are analyzed using a minor modification of the Holmes et al. (1998) NH4 micro-diffusion method. Samples are analyzed using an elemental analyzer connected to an Optima mass spectrometer.
H2O-δ18O and δ2H: Both δ18O and δ2H of water are measured by laser spectroscopy on a Los Gatos Research DLT-100 Liquid-Water Isotope Analyzer, using a modification of the method described in Lis et al. (2008).
DOC-δ13C: Samples are prepared and analyzed using an automated OI TOC analyzer connected to an IsoPrime mass spectrometer using a modification of the method described in St. Jean (2003). This method first acidifies water samples to remove Dissolved Inorganic Carbon (DIC), and then analyzes the concentration and δ13C value of CO2 obtained from persulfate oxidation of DOC.
Statistical analysis methods
Three types of statistical analyses were used in this report. Correlation coefficients, unpaired t-tests, and paired t-tests. In all cases, p values < 0.05 are regarded as statistically significant.
Figures and Tables
The figures and tables are located at the end of the document. Almost all of the figures in this report were modified from the figures used in PowerPoint presentations from scientific conferences or public workshops.
Data Sources
The figures and tables in this report contain both published data and new data. The new data consists of (1) chemistry data generated as part of the slough transect study described above, and (2) isotope data generated as part of all three transect studies described above. All the new data are in downloadable Excel files.
All the chemistry data described or presented in this report come from 4 sources:
(1) Analysis of samples collected as part of Richard Dugdale's cruises in 2009-2010. These samples were analyzed in Dugdale's SFSU lab (methods and data in Parker et al. 2010; 2012).
(2) Analysis of samples collected as part of transects conducted by Chris Foe and colleagues from 3/2009 through 2/2010 as part of the CVRWQCB-organized NH4 monitoring project. These samples were analyzed in Randy Dahlgren's UCD lab, and the data reported in Foe et al. (2010).
(3) Analysis of samples collected as part of a USGS pilot study comparing the compositions of water in the main channel of the Sacramento River and the two main distributary channels (Steamboat and Miner Sloughs). These samples were analyzed in Randy Dahlgren's UCD lab. The chemistry data are reported in the downloadable Excel file: (http://water.usgs.gov/nrp/isotope-tracers/Kendall_etal_2015_DRAFT_data.xlsx)
(4) Data generated from sampling conducted on the ~monthly cruises of the USGS RV Polaris cruises in the San Francisco Bay at fixed sites from Rio Vista through the Bay; these data can be accessed at: http://sfbay.wr.usgs.gov/access/wqdata/
The nomenclature [NH4], [NO3], and [NO2] are generally used in this report when referring to concentration data for NH4+, NO3-, and NO2-. Unless otherwise specified, all nutrient concentration data are reported in µmoles/L (µM). In this report, [NO3] denotes [NO3+NO2] unless otherwise indicated, since the concentrations of NO2 are generally low and average only 4.4 ± 2.6 % of the total [NO3+NO2].
Chemistry data file
The chemistry data for the slough study samples collected April 2011 through December 2011 can be downloaded here (http://water.usgs.gov/nrp/isotope-tracers/Kendall_etal_2015_DRAFT_data.xlsx). The file has been sorted by sample collection date and then collection time.
The column headings are color-coded into 3 groups. The columns with yellow headings provide descriptive information about the site and samples: the site codes, the transect study name (i.e., the slough study), descriptive name of the sampling location (SR is an abbreviation for "Sacramento River"), site type (e.g., mainstem Sacramento River, slough, or distributary), collection date, collection time, decimal latitude, and decimal longitude. The columns with orange headings provide information about the downstream river mile (RM) distances of the sites from reference points. The columns with green headings provide chemical data, each with the units in parentheses. More information about the headings for some of the Excel columns is listed below.
Site Code: The site code contains the prefix "SL" for slough study, and then numbers and/or letters. All but 4 of these sites (SL-30, SL-31, SL-721, and SL-CTL) were also sampled as part of the Foe and/or Dugdale studies. The numbers or letters after the "SL-" are the same as used by Foe and/or Dugdale to label samples collected from the same site. Table 1, which provides information for each site included in this report, lists the multiple codes used by the different field crews for the three transect studies for essentially the same sites.
Site Type: Sites in the main channel of the Sacramento River are categorized as "mainstem" sites. About half of the Sacramento River water flowing downstream of the Sacramento waste-water treatment plant is diverted from the mainstem channel into two other river channels, Miner and Steamboat Sloughs; sites along these channels are labeled here as "distributary" sites. Sites along the tributaries in the Cache/Yolo Slough Complex are labeled "slough" sites.
River Mile (RM): Three different columns (with orange headers) with river mile (RM) information are provided. The "River Mile (RM)" column gives the river miles on the Sacramento River relative to where the San Joaquin River converges with the larger Sacramento River (RM=0). For distributary and slough sites, the value given is 14.1, which is the RM where the Cache/Yolo Slough converges with the mainstem Sacramento River. For distributary and slough sites, the "RM upstream from SR confluence" column gives the distance in miles upstream of RM14.1 to the site. The "RM downstream of SRWTP (at RM46)" gives the distance of the sites downstream of the Sacramento Regional Water Treatment Plant (SRWTP), with the RM location of SRWTP rounded-off to RM46. For distributary sites (on Miner Slough and Steamboat Slough), these values were calculated for water flowing directly from SRWTP downstream to the sites. For slough sites, this calculation assumed that the water flowed from SRWTP downstream to RM14.1 and then upstream along Cache/Yolo Slough to each of the slough sites.
Chemistry Data: All chemical compositions are given using standard abbreviations, and the standard units are listed in parentheses. Other abbreviations include: T= total, D= dissolved, OM=organic matter, C=Carbon, N=Nitrogen, P=Phosphorous.
Isotope data file
The isotope data for the samples collected as part of three transect studies March 2009 through December 2011 can be downloaded here (http://water.usgs.gov/nrp/isotope-tracers/Kendall_etal_2015_DRAFT_data.xlsx). The file has been sorted by sample collection date and then collection time.
The column headings are color-coded into 3 groups. The columns with yellow headings provide descriptive information about the site and samples: the site codes, the transect study name (e.g., Dugdale, Foe, or Slough), descriptive name of the sampling location (SR is an abbreviation for "Sacramento River"), the site type (e.g., mainstem Sacramento River, slough, or distributary), collection date, collection time, decimal latitude, and decimal longitude. The columns with orange headings provide information about the downstream river mile (RM) distances of the sites from reference points. The columns with green headings provide isotopic data, each with the units in parentheses. More information about the headings for some of the Excel columns is listed below.
Site Code: The site code contains the prefix "SL" for slough study, and then numbers and/or letters. All but 4 of these sites (SL-30, SL-31, SL-721, and SL-CTL) were also sampled as part of the Foe and/or Dugdale studies. The numbers or letters after the "SL-" are the same as used by Foe and/or Dugdale to label samples collected from the same site. Table 1, which provides information for each site included in this report, lists the multiple codes used by the different field crews for the three transect studies for essentially the same sites.
Site Type: Sites in the main channel of the Sacramento River are categorized as "mainstem" sites. About half of the Sacramento River water flowing downstream of the Sacramento waste-water treatment plant is diverted from the mainstem channel into two other river channels, Miner and Steamboat Sloughs; sites along these channels are labeled here as "distributary" sites. Sites along the tributaries in the Cache/Yolo Slough Complex are labeled "slough" sites.
River Mile (RM): Three different columns (with orange headers) with river mile (RM) information are provided. The "River Mile (RM)" column gives the river miles on the Sacramento River relative to where the San Joaquin River converges with the larger Sacramento River (RM=0). For distributary and slough sites, the value given is 14.1, which is the RM where the Cache/Yolo Slough converges with the mainstem Sacramento River. For distributary and slough sites, the "RM upstream from SR confluence" column gives the distance in miles upstream of RM14.1 to the site. The "RM downstream of SRWTP (at RM46)" gives the distance of the sites downstream of the Sacramento Regional Water Treatment Plant (SRWTP), with the RM location of SRWTP rounded-off to RM46. For distributary sites (on Miner Slough and Steamboat Slough), these values were calculated for water flowing directly from SRWTP downstream to the sites. For slough sites, this calculation assumed that the water flowed from SRWTP downstream to RM14.1 and then upstream along Cache/Yolo Slough to each of the slough sites.
Isotope Data: All isotopic compositions are reported in permil (‰) relative to the normal international standards (VPDB for δ13C, VSMOW for δ18O and δ2H, Air for δ15N, and CDT for δ34S). The elemental ratios of Carbon to Nitrogen (C:N) and Carbon to Sulfur (C:S) are reported in atomic units (at.). Other abbreviations: POM=Particulate Organic Matter, and DOC=Dissolved Organic Carbon. For more information about isotope terminology and fundamentals, see Kendall and Caldwell (1998), or excerpts from this chapter at: http://wwwrcamnl.wr.usgs.gov/isoig/res/funda.html
Results and Discussion
This section is intended to provide brief discussions of some of the key findings (highlights) of our ongoing studies. Stable isotopic analysis of NO3, NH4, POM, and H2O was used in conjunction with conventional water chemistry data (e.g. constituent concentrations) to gain insight about the fate of NH4 derived from the SRWTP and its possible effects on phytoplankton. However, the discussion here focuses primarily on the interpretation of the NO3, NH4, and POM isotope data. In general, the data are assessed in terms of dominant downstream trends rather than individual measurements due to the variability introduced by changes in upstream water quality, incomplete mixing, variable river to effluent ratios, tidal effects, tributary inputs, and other possible sampling artifacts that are yet poorly understood. The discussion is divided into three main sections: (1) nutrients, (2) N sources to algae, and (3) mass balance models.
Nutrients
When we first proposed this study in March 2009, there was very little information on nutrient concentrations in the Sacramento River, except for data from the USGS NAWQA site at Freeport (http://nwis.waterdata.usgs.gov/ca/nwis/qwdata/?site_no=11447650&agency_cd=USGS), which is located at about RM46, just upstream of SRWTP. There was, however, nutrient concentration data in the San Francisco Bay generated during monthly monitoring from Rio Vista westward by the USGS since 1968 (http://sfbay.wr.usgs.gov/access/wqdata/index.html), some of which was discussed in Hager and Schemel (1992). To remedy this lack of data in the Sacramento River, Chris Foe and colleagues at the CVRWQCB started a 1-year project in March 2009, to monitor temporal and spatial changes in nutrients and organic matter monthly at key locations in the Sacramento River and Delta (Foe et al., 2010).
We are unaware of any nutrient isotope data in the San Francisco Bay before our pilot studies in 2002-2004, which led to the Wankel et al. (2006) study of NO3 δ15N and δ18O in the North and South Bay. We are also unaware of any nutrient isotope data in the Sacramento River upstream of Rio Vista until our pilot study in fall 2008. In March 2009, there were certainly no data about the δ15N of NH4 in the Sacramento River, Delta, or San Francisco Bay. Hence, we had based our hypothesis that nitrification of NH4 was the dominant N cycling process in this region -- and that as a consequence of the intensive nitrification, the δ15N of NH4 and NO3 in the Sacramento River were likely to be isotopically distinctive -- solely on interpretation of NO3 δ15N and δ18O data from earlier pilot studies 2002-2004 combined with data from an earlier study 2006-2007 from sites in the northern San Francisco Bay and Delta. Figure 13 shows a color contour diagram (isoscape) of δ15N and δ18O data from 2006-2007 from the San Joaquin River, southern Delta, and northern San Francisco Bay that was the basis for this interpretation (Kendall et al., 2010). Figure 14 shows the locations of the sites.
While there are no Sacramento River data upstream of RM12 (Rio Vista) in Figure 13, the plot shows isotope data from San Joaquin River upstream of RM24.4 that are influenced by Sacramento River water derived from upstream of RM12. Specifically, the δ15N and δ18O data from downstream of RM31.4 (the "Light 19" site, named because of proximity to numbered lighted buoys) on the Deep Water Shipping Channel (DWSC) of the San Joaquin River were used to extrapolate the isotopic compositions of NO3 derived from the Sacramento River upstream of RM12.
Sacramento River water is frequently pumped south across the Delta and into the San Joaquin River in the fall season to meet agricultural and other water needs, resulting in significant changes in the chemical and isotopic compositions of water downstream of RM31.4 in this deltaic part of the San Joaquin River. On the San Joaquin River, the extent of mixing of Sacramento and San Joaquin River waters depends mainly on the operation1 of the DCC gates and on the balance between river inflows and export volumes. The DCC gates are closed when Sacramento River flows exceed 25,000 cfs and for fisheries protections. When the DCC gates are open, the proportion of Sacramento River water reaching the central and south Delta regions increases. As a consequence, there are significant changes in the chemical and isotopic compositions of water downstream of RM31.4, located in the deltaic part of the San Joaquin River.
In this section of the river, and downstream of it to where the San Joaquin River converges with the Sacramento River at RM0, nitrate often has anomalously low δ15N and δ18O values, lower than in the upstream San Joaquin River (Kratzer et al., 2004) and lower than downstream of RM0 in the Sacramento River Delta. From our experience, nitrification of NH4 usually causes the bulk δ15N (and sometimes the bulk δ18O) values of NO3 to decrease because of the additions of new NO3 with lower δ15N (and sometimes δ18O) derived from oxidation of NH4. Hence, we interpreted the low δ15N and δ18O values here as likely indicators of nitrification of WWTP-derived NH4 or wetlands NH4.
Role of nitrification in controlling temporal and spatial variations in nutrients in the SR
March and April 2009 Dugdale transects
Nutrient concentrations and δ15N values of NH4 and NO3 for samples collected in March and April 2009 show clear evidence of nitrification (Figure 15 and Figure 16); these plots show NO3 and NH4 concentrations in solid-color at the bottoms of the plots and δ15N values of NO3 and NH4 on the upper parts. Upstream of SRWTP, NO3 concentrations were 13 µM in March and 2 µM in April; NH4 concentrations upstream of SRWTP were <1 µM during both transects, too low for NH4-δ15N analysis. The NH4 concentrations started to increase downstream starting at ~RM50, a few miles upstream of where the SRWTP effluent is released at the bottom of the channel, presumably because of tidal mixing; river slow reversals occur along this portion of the river during lower flow conditions.
The gradual nature of the increase in NH4 concentration near river mile 46 depicted in Figure 15 and Figure 16 is largely an artifact of applying a linear interpolation between the sampling sites since samples were only collected at RM49 and RM44, upstream and downstream of the SRWTP effluent outflow pipe (~RM46). However, during low river flows this section of the river experiences tidal reversals and thus higher NH4 concentrations due to effluent inputs can occur upstream of the effluent outflow pipe. Effluent discharges are reduced by the WWTP to remain below their mandated 14:1 river to effluent ratio limit (6.67% effluent), and when river flows fall below ~1200 cfs effluent discharges are halted (O'Donnell, 2014). However, we cannot exclude tidal mixing of waters derived from downstream of the WWTP as a possible explanation for some of the high NH4 concentrations measured at sites upstream of SRWTP.
The NH4 reached maximum concentrations in March and April of 45 and 50µM, respectively (Figure 15 and Figure 16). The Foe et al. (2010) report notes that "the effluent is fully mixed into the river within several miles if River flow is greater than 1,300 cfs"; hence, samples collected at Hood (RM38), ~8 miles downstream of SRWTP, should be fully mixed. However, because river and effluent flows vary independently, percent effluent in the river commonly ranges from 1-3% over short time periods (O'Donnell, 2014), resulting in variable concentrations of wastewater derived NH4 in the river. For example, assuming an effluent NH4 concentration of 1800 uM, at 1% effluent in the river NH4 concentrations would be 18 uM compared to 54 uM if it was at 3%. In addition, NH4 concentrations in the effluent itself can vary (O'Donnell, 2014). Another concentration anomaly is the dip in [NH4] at ~RM27 near the Delta Cross Channel (DCC) gates and the city of Walnut Grove. Since we believe that the chemical and isotopic data from near the DCC are an artifact of highly localized conditions, they are omitted from these plots. These "concentration anomalies" are discussed in a subsequent section (Other processes affecting nutrient concentrations).
The NO3 concentrations of the river begins to increase between RM31 and RM21, and NH4 concentrations begin to decrease downstream of RM31 (Figure 15 and Figure 16). These changes in nutrient concentrations are associated with slow increases in the δ15N of residual NH4 and decreases in the δ15N of the bulk NO3 (which consists of NO3 derived from upstream of the WWTP plus NO3 newly produced by nitrification and possibly other small NO3 inputs). The δ15N values of NH4 averaged about +7.6 ‰ between RM44 and RM16 during both transects. Downstream of RM16, the δ15N-NH4 rapidly increases to between +14 and +16 ‰ by RM-14 and increased only slightly more by RM-30.
The δ15N data for NH4 and NO3 provide strong support for nitrification as the dominant processes controlling changes in NH4 and NO3 concentrations along this stretch of the Sacramento River. During progressive nitrification (see schematic at top of Figure 15 and Figure 7), the NH4-δ15N increases as [NH4] decreases downstream, and the NO3-δ15N should initially decrease downstream, assuming that the δ15N of NO3 entering the zone of nitrification is higher than the newly-formed NO3 -- which is the case here.
The actual difference in the δ15N of co-existing NH4 and NO3 at any location depends largely on the original [NO3] in the river, since the newly formed NO3 (with the low δ15N values resulting from the faster reaction rates of the lower-mass isotope 14N than the higher-mass 15N) may be a small fraction of the total NO3. For example, the lower upstream [NO3] in April vs March results in a large difference between the δ15N values of NH4 and NO3 upstream of RM12. Also, the greater downstream oscillations in NO3-δ15N in April vs March probably reflect the much lower concentrations of upstream NO3 in April vs March to "buffer" the oscillations in the nitrification process (as exhibited by the small oscillations in NH4-δ15N in April).
At some point downstream, while the newly formed NO3 is lower in δ15N than the NH4, the NO3-δ15N may start become progressively higher downstream because (1) the remaining pool of NH4 being nitrified has progressively higher δ15N values, and (2) the newly formed NO3 is no longer being substantially diluted by the original upstream NO3. This happens at about RM0 in both transects, and may also be partly caused by the higher [NO3] in the San Joaquin River water mixing with the Sacramento River water.
Usefulness of δ18O data
In the Sacramento River, the δ18O-NO3 provides a more dramatic indicator of nitrification than the δ15N-NO3 (Figure 17 and Figure 18). During nitrification, the three oxygen atoms that must be added to ammonium N to produce nitrate are generally derived two-thirds from local water and one third from dissolved oxygen (Anderson et al., 1982; Hollocher, 1984). The δ18O-H2O for both transects between RM62 and RM0 averages near -10.5 ‰. Ignoring the low δ18O of dissolved oxygen produced through photosynthesis and considering a value of dissolved oxygen only from O2 derived from the atmosphere (δ18O = +24.2 ‰), a rough estimate of the δ18O-NO3 derived from nitrification above about RM-20 is +1 ‰. The δ18O-NO3 above the SRWTP for both transects averages about +3.5 ‰. From below the SRWTP to around RM-20, the δ18O-H2O from the March 2009 transect averages about +0.1 ‰ while the April 2009 transect averages about -2.7 ‰. The somewhat lower than predicted δ18O-NO3 values are undoubtedly caused by a significant fraction of dissolved oxygen produced through photosynthesis, which causes decreases in the δ18O of dissolved O2. The δ18O of the newly formed NO3 reflects the relative proportions and δ18O values of the H2O and O2 in the river. The lower April values as compared to March are consistent with the higher March nitrate concentration upriver yielding a smaller change in δ18O-NO3 from nitrification.
In general, the changes in the δ18O and δ15N of nitrate in surface water during nitrification are viewed as "decoupled" (Wankel et al., 2006), meaning that there is no a priori reason why the changes in δ15N and δ18O due to additions of new NO3 produced by nitrification should show positive or negative correlations. However, in situations where most (or virtually all) of the NO3 is derived from progressive downstream nitrification of a single source of NH4, like in the Sacramento River downstream of the WWTP, the changes in δ values during progressive nitrification are likely to be strongly coupled, positively or negatively, depending on specific environmental conditions such as the δ15N of NH4 and the δ18O of ambient H2O and O2.
As shown in Figure 18, both the δ15N-NO3 (blue line) and δ18O-NO3 (red line) during the April transect show decreasing values superimposed with in-phase oscillations from RM62 downstream to about RM20, presumably because the dominant process is mixing (i.e., addition of new NO3). The in-phase oscillations are likely an artifact of non-Lagrangian sampling (and especially non-ebb tide sampling), where the successive water parcels sampled have non-linear travel times; note the change in flow starting at ~RM40 as the tide begins to turn (Figure 12). Departures from Lagrangian sampling are important because the extent of nitrification in any parcel of water is strongly correlated with travel time (O'Donnell, 2014).
Starting at about RM20 and continuing downstream to about US2 (Chain Island, at the confluence with the SJR), the changes in δ18O and δ15N are positively related. After the confluence, presumably because of the addition of NO3 from the San Joaquin River (SJR) but also because of the δ18O of the water used for nitrification is beginning to change due to the addition of significant amounts of marine-derived water with a higher δ18O, the relationship between δ18O and δ15N becomes more variable. Another important factor is tidal mixing, such that very different parcels of water are probably being sampled at successive downstream sites, depending on tides.
Proof of concept
In summary, nitrification of NH4 derived from the SRWTP is clearly indicated by several measurements. First, transects show that [NO3] increases progressively downstream and that [NH4] decreases downstream after reaching a maximum concentration at about RM30 (Figure 15 and Figure 16). Second, the inverse relation of [NH4] and [NO3] is very apparent (R2=0.9) when both concentrations are plotted relative to δ15N of NH4 (Figure 19). And third, nitrification is also indicated (R2=0.5) by the corresponding (parallel) changes in the δ15N of NH4 and NO3, and the δ15N and δ18O of NO3 downstream of SRWTP (Figure 20).
Hence, the NH4-δ15N and NO3-δ15N data from both the March and April 2009 transects (Figure 15 and Figure 16), combined with the NH4 and NO3 concentration data generated by our collaborators (Parker et al., 2010; 2012), conclusively demonstrated that (1) nitrification was the dominant N cycling mechanism in the mainstem Sacramento River and Northern Delta, and (2) that the δ15N values of NH4 and NO3 became increasingly isotopically distinctive downstream. These plots provided "proof of concept" that the δ15N values of NH4 and NO3 in the Sacramento River become isotopically distinctive within 10-20 miles downstream of the WWTP and thus stable isotopic techniques can be an effective tool/approach to estimate the relative contributions of NH4 and NO3 assimilated by algae at most sites and dates where we have the appropriate δ15N data.
Other transects
Subsequent transects conducted May 2009-December 2011 as part the Foe and Slough studies showed similar downstream trends in [NO3], [NH4], and their δ15N values. However, they do not show the effects of nitrification as dramatically as Figure 15 and Figure 16 because these other transects have much smaller numbers of downstream samples (e.g., 17-18 mainstem Sacramento River and Delta sites downstream of SRWTP for the Dugdale transects compared to the 7 and 5 downstream sites for the Foe and Slough transects, respectively). Hence, individual plots of transects are not shown.
Figure 21 compares the downstream changes in δ15N of NO3 and NH4 for the entire dataset. The slough and distributary samples are plotted at RM14.1 because these sloughs (tributaries) and distributaries (Miner and Steamboat Sloughs) all drain into the Cache/Yolo Slough Complex and this is where the Cache/Yolo Complex drains into the mainstem Sacramento River. This plot shows that NH4-δ15N steadily increases downstream whereas the NO3-δ15N starts out decreasing downstream but downstream of ~RM15, the δ15N values show a gentle increase. This upwards trend in NO3-δ15N starting at ~RM15 is less prominent than the similar trends seen in Figure 15 and Figure 16, where the inversion point of the NO3-δ15N trend was closer to RM0. Note that there is no overall correlation (R2=0.05) of NO3-δ15N versus NH4-δ15N (Figure 22).
Upstream of SRWTP (~RM46), the few samples that had high enough [NH4] for isotopic analysis show δ15N values that are generally lower than the co-existing NO3 (Figure 21). These upstream NO3-δ15N values fall within the normal range for NO3 largely derived from soil, or for mixtures of NO3 from soil, fertilizer, and animal waste on dual NO3 isotope plots (Figure 23, Figure 24). Interesting, downstream NO3-δ15N values show more variability in δ15N and generally lower δ18O, but there is no consistent trend (Figure 25). This is probably because nitrate concentrations are generally increasing downstream of SRWTP due to nitrification of NH4, not decreasing due to NO3-consuming reactions, and it is generally N-consuming reactions that produce the largest shifts in isotopic composition (Kendall et al., 2007).
Factors affecting nitrification rate
Stream nutrient dynamics are likely to be controlled by both physical and biogeochemical factors. Chemical and hydrological data for the Dugdale and Foe transects were used to evaluate the main factors affecting nitrification rates. Preliminary analyses using multiple linear regression to predict downstream NH4 concentrations suggest that the main controlling factors which predict NH4 concentrations at Rio Vista are (1) river flow (RM44), (2) the volumetric fraction of flow from SRWTP (estimated using DSM2), (3) water temperature (data from Hood), and (4) upstream nitrate concentration. All these factors are negatively correlated with [NH4] at Rio Vista except for the percent SRWTP water, which reasonably enough has a positive correlation. These relationships are discussed in more quantitative detail below. Data from high frequency in situ nitrate sensors located upstream and downstream of SRWTP have also been used to examine changes in nitrate concentration and estimate nitrification rates (O'Donnell 2014).
River flow (at RM44) is a major factor controlling the effluent dilution ratio and thus determines the resulting NH4 concentration in the river below the WWTP. In addition, river flow controls travel time; preliminary modeled travel times from the SRWTP to Isleton and Rio Vista (not included in this report) were highly correlated to river flow at Isleton (R2=0.90 and 0.76, respectively). Modeled travel times from the SRWTP to these downstream locations varied over 3-fold depending on river discharge. In specific, modeled first-peak travel times estimated using DSM2-QUAL tracking a tracer pulse from SRWTP to Rio Vista ranged from about 1 to 4 days for ~monthly transects sampled in 2008-2009. Longer travel times provide greater opportunity for processes like nitrification to occur between two fixed points, and thus are expected to result in larger changes in the concentrations and isotopic compositions of NO3 and NH4.
In most small river studies where NH4 is derived largely from soils, one expects that lower flows and the resulting increase in travel time allows for more time for NH4 loss to occur through nitrification, resulting in lower downstream NH4 concentrations. However, based on preliminary analysis of the data, the opposite trend was found in the Sacramento River: NH4 concentrations at Rio Vista are negatively correlated with river flow (R2=0.51), indicating that downstream concentrations are lower when travel times are faster. This is because the primary source of NH4 to Rio Vista is from wastewater effluent, and the concentration of NH4 in the river is notably lower during higher flows (faster travel times) due to dilution of SRWTP effluent. In other words, at higher flows the discharge from SRWTP will be mixed with a greater volume of river water and thus effluent-derived [NH4] will be lower, even given the same effluent load; this overrides the effect of flow on travel time (e.g. time for nitrification to occur). The study by O'Donnell (2014) takes both change in effluent dilution and water travel time into account when calculating changes in nitrate concentration and the associated nitrification rates in the Sacramento River below the WWTP.
Other processes affecting nutrient concentrations
The Foe et al. (2010) report states that "Ammonia and nitrite/nitrate concentrations were the mirror image of each other, suggesting that there were no other large nitrogen sources or sinks" when describing the downstream changes in the average [NH4] and [NO3] at the Sacramento River and Delta sites. A slightly modified version of their figure 2 is shown in Figure 26. Note that the sites are not arranged in the same "downstream to the left" order as in this report (note the blue flow arrow).
The trends of [NH4] and [NO3] on Figure 26 do appear to be "the mirror images of each other," with [NO3] again defined to mean the sum [NO3+NO2]. However, this simplification hides the fact that there are significant discrepancies between the changes in [NH4] and [NO3] between (1) adjacent sites on different collection dates (e.g., between Isleton and Rio Vista, because of highly variable sinks and inputs from the Cache/Yolo Slough Complex); and (2) between the average values for sites (e.g., Hood and Chipps: see the differences in NH4 and NO3 boxes on Figure 26). Figure 19 shows that the main trends in [NH4] and [NO3] for the April 2009 transect are mirror images. However, the trends are less similar at both upstream and downstream sites, probably due to tide reversals. So while at first glance it appears that the decreases in [NH4] are mirrored by corresponding increases in [NO3], in detail the changes do NOT agree. These details reflect the challenges of collecting data in a hydrodynamically complex system.
Nutrient ratio discrepancies
If nitrification explained most or all of the downstream variations in [NH4] along a transect, then downstream decreases in [NH4] would be mirrored by equivalent downstream increases in [NO3].] Of course, we know that there are other sources and sinks including uptake by algae, bacteria, and other organisms; denitrification; and new N inputs from sloughs, groundwater, and benthic release. But if we make the reasonable assumption that these other sources and sinks are usually negligible and hence nitrification is usually the dominant process, we can then "factor out" the effect of nitrification and examine spatial and temporal changes in these other sources and sinks in more detail. To assess the magnitude, sign, and causes of spatial and temporal discrepancies between the NH4 lost and NO3 (actually NO3+NO2) gained between successive downstream sites, in a system where we know that nitrification is the dominant downstream N cycling process, we calculated nutrient ratio as the downstream decrease in [NH4] divided by the downstream increase in [NO3] (Δ [NH4]/Δ [NO3]) for each downstream site. These values are plotted on Figure 27. Calculations made using N differences of <0.2 μmoles were examined carefully and any anomalous values for that site or date were eliminated from the plot.
The Figure 27 color contour plot combines nutrient data from: the Dugdale transects (Parker et al., 2010; 2012), from the Foe transects (Foe et al., 2010), and from USGS RV Polaris cruises (http://sfbay.wr.usgs.gov/access/wqdata/) that collect samples approximately monthly from Rio Vista westward. The ratio values calculated from the differences in the nutrient concentrations data for each pair of adjacent sites were plotted at the downstream site; locations of data points are denoted by black dots. This and other contour plots in this report were made using Surfer (http://www.rockware.com/product/overview.php?id=129), using kriging to interpolate between data values. The program defaults were used to create these preliminary plots, except that the grid density was increased by a factor of 5-10 to reduce artifacts of the irregular data density. Nevertheless, some of the small oscillations in composition and small closed circles on these plots are probably artifacts. Also, interpolations in areas of the plot where data points are lacking (e.g., upstream of RM41 in early October 2009), should be viewed with caution.
If decreases in [NH4] were mirrored by equivalent increases in [NO3] – as is expected if nitrification explained most or all of the downstream variations – then the Δ/Δ values plotted would be close to 1. Instead, we see ratio values that range from -30 to 30. Nutrient discrepancy ratios >1 indicate a greater loss of NH4 than can be accounted for by NO3 gains through nitrification (i.e., a net loss of N downstream). Nutrient discrepancy ratios <1 indicate a greater gain in NO3 than can be accounted for by NH4 loss through nitrification (i.e., a net gain of N downstream).
The anomalously low change in [NH4] versus [NO3] ratio values (as low as -30) that center around RM27 on several transects (especially in late May 2009 and late February 2010) reflect the odd dip (decrease) in [NH4] but not in [NO3] that sometimes occurs near the DCC and Walnut Grove (Figure 11 and Figure 12). A spatially transient drop in [NH4] occurs during many transects -- especially ones sampled March to September 2009 and January to March 2010, when the flow at Freeport is higher than in October to January (Figure 28). Possible explanations for the anomalous [NH4] at RM27, which seems to be a dilution of the [NH4], will be discussed in the (Hydrological effects on discrepancies in nutrient ratios) section below.
The very high change in [NH4] versus [NO3] ratio values (as high as 30) that center near the Hood site at RM38 reflect the addition of wastewater-derived NH4 between these two sites. Concentrations of NO3 in effluent released from SRWTP are low to non-detectable (O'Donnell, 2014). Nutrient ratios decrease downstream from Hood; however, high values are sometimes present (Figure 27) as far downstream as Isleton (RM17). Generally, the ratios flatten out downstream of ~RM20, and most ratios downstream of RM12 (Rio Vista) are between -2 and 2. The small oscillations in ratios downstream of Rio Vista and in Suisun Bay probably reflect small inputs of nutrients from other sources and algal uptake of nutrients, but tidal mixing is also a factor.
The gradationally flattening changes in ratio downstream of ~RM20 provides support for the hypothesis that nitrification of effluent-derived NH4 is the main source of nutrients downstream of SRWTP, that progressive nitrification of this plume of NH4 can be traced downriver into the Bay, and that tributary sources of nutrients are insignificant compared to the effluent-derived nutrients. In addition, the relatively stable ratios downstream of ~RM20 reflect complete mixing from this point on, a less noticeable tidal effect on nutrient concentrations, and that tributary sources of nutrients are insignificant compared to the effluent nutrients.
The much greater downstream losses in NH4 compared to gains in NO3 between adjacent sites from ~RM50 to ~ RM17 (Isleton) suggests significant additional sinks of NH4 – or additional sources of NO3 – along this section of the river. There are several biogeochemical processes that can cause greater downstream losses in [NH4] than can be explained by the downstream increases in [NO3] due to nitrification (e.g. ratios>1) including: NH4 uptake, NH4 volatilization, NH4 absorption on sediments, and temporal variability in effluent loads and dilution by flow. Possible hydrological mechanisms that could explain greater downstream increases in [NO3] than can be explained by downstream decreases in [NH4] due to nitrification (e.g. ratios <1) include: release of NO3 from transient storage in the sediments, groundwater inputs, localized small surface-water inputs, and oxidation of organic N. These biogeochemical and hydrological processes will be briefly discussed below.
Hydrological effects on discrepancies in nutrient ratios
The main causes of downstream variations in flow in the Sacramento River are losses via distributaries (which include Miner and Steamboat Sloughs to the north, and the DCC and Georgiana Sloughs to the south), and gains due to convergence with other tributaries and rivers. Assuming the water column at the divergence locations is well-mixed, water losses via distributaries should have minimal effect on nutrient ratios. In contrast, if the new inputs of water have significantly different nutrient concentrations and nutrient ratios than the Sacramento River at the convergence points, combined with significant flows compared to the Sacramento River, changes in the nutrient ratios downstream of the confluences can be expected.
The main water inputs downstream of SRWTP are located (1) between Isleton and Rio Vista where the Cache/Yolo Slough Complex tributaries and two major Sacramento River distributaries (Miner and Steamboat Slough) converge with the mainstem Sacramento River at ~RM14, increasing the flow by about 100%; and (2) near Pt. Sacramento (RM0) where the San Joaquin River adds a small amount of water. Figure 9 shows that the contribution of water at RM0 from the San Joaquin River is usually <10%. Downstream of RM20, the gradational decreases in [NH4] strongly support the hypothesis that the Cache/Yolo Complex sloughs are a negligible source of NH4 to the mainstem Sacramento River and downstream (Figure 28). Furthermore, the relatively constant nutrient discrepancy ratios (Figure 27) downstream of RM12 suggest that the river is well-mixed and that inputs from the San Joaquin River have little effect on nutrients in the Sacramento River downstream of the confluence.
Insertion of Animations #1 and #2. Animation Overview
Figure 27 provides some qualitative evidence that seasonal differences in flow result in differences in the nutrient discrepancy ratios. Most notably, the very high flows in early 2010 result in anomalously low ratios; however, small correlations of higher than normal flow and low ratios can be seen at other times of the year. In summary, changes in effluent dilution, effluent composition, inputs from tributaries and rivers, and tidal mixing are probably the major causes of the variability in nutrient discrepancy ratios in the Sacramento River (Figure 27). However, some of the potentially important nutrient sources and sinks mentioned above (e.g., denitrification, groundwater inputs, benthic release, etc.) that we presently have little information about in the Sacramento River, have proved to be major controls on nutrient concentrations in other riverine systems -- and probably merit further investigation to quantify their possible effects on the temporal and spatial distribution of nutrients in the Sacramento River.
Figure 28, Figure 29, and Figure 31 show the spatial changes in [NH4], [NO3+NO2], and total chlorophyll (respectively) for all available data for samples collected March 2009 to March 2010 by the Dugdale, Foe, and USGS Polaris teams. This way of presenting the nutrient and chlorophyll data is much more effective at showing trends than assembling a series of longitudinal plots for each transect (like Figure 15 and Figure 16).
Figure 28 shows that there are large variations in [NH4] between the SRWTP and ~RM10 (site 655, on the Sacramento River upstream of Three Mile Slough). The [NH4] maxima always are asymmetrical, either being double-humped (e.g., as found during the March and April 2009 Dugdale cruises) or have a definite lower shoulder at the downstream end of the [NH4] peak. The dips in [NH4] are located at the DCC (Delta Cross Channel) and nearby Walnut Grove sites at ~RM27.
There are several periods where the NH4 concentrations downstream of the SRWTP remain low for extended periods (e.g., in July-September 2009, January-February 2010). To some extent, the length of these periods might be an artifact of limited data (Figure 28). The first period is associated with moderately high but gradually decreasing flow, and the second with high winter flows. The low [NH4] in July 2009 is associated with much lower than normal [NO3], whereas the low [NH4] in January 2010 is associated with high [NO3] upstream of RM12 derived from sources upstream of SRWTP (Figure 29). There are also several smaller periods of time when the NH4 concentrations downstream of the SRWTP are low (e.g., early 3/09 and early 5/09, both associated with spikes in flow), and other periods of low [NH4] where the flows are only slightly higher than at adjacent sampling times where [NH4] are higher. Hence, there is a relative good correlation of times with low [NH4] and higher flows, probably as a consequence of simple dilution of the effluent.
Most of the dates with lower than normal [NH4], which are usually dates with high flow (Figure 28), also have 2-3 times higher than normal DON concentrations (see DON and other data in Foe et al., 2010). For one of these dates (March 16, 2009) with high [DON], all sites downstream of SRWTP (Figure 30) -- but none of the sites upstream -- had very high [DON] and low C:N (~5) of the dissolved organic matter (DOM). Hence, for this date, the DON was apparently derived from the effluent, suggesting that a change in effluent composition may be related to or possibly responsible for the anomalously low NH4 concentration (~1 μM) and high DON concentration (~50 μM) observed at sites downstream of SRWTP on that date. Given water travel times and tidal mixing, for the high [DON] values of sites just downstream of the SRWTP and apparently derived from the effluent to have some causative relationship with the low [NH4] values observed at the downstream end of the transect would require that the hypothetical anomalous high [DON] values of effluent to have originated several days prior to March 16th and persisted for at least several days. Interestingly, the samples collected March 16th also have higher than normal [NO3], both upstream and downstream of SRWTP (Figure 29). An alternative explanation is that there was some analytical problem during the analyses of all the downstream DON and NH4 samples collected on this date, but the UC-Davis lab (when Kendall checked with them in 2011 about these anomalous concentrations) reported no known problems.
For the other dates with low [NH4], the associated high DON concentrations (10-15 μM) extend upstream of SRWTP and hence the DON was derived from upstream sources. The C:N of the upstream DOM was typically in the range of 15-35, suggesting a higher fraction of more refractory terrestrial DOM in these samples than in the effluent-derived DOM. DOM concentrations in rivers typically increase with flow due to greater flushing of soils during runoff.
Figure 29 shows the corresponding variability in [NO3] (actually [NO3+NO2]), which does not look like mirror image of the variability in [NH4] shown in Figure 28. Concentrations of NO3 are low upstream of ~RM30, except during high flow periods when water sources upstream of RM60 contribute NO3; significant upstream sources of NO3 were also observed by O'Donnell (2014). While the data density is poor upstream of RM12, the [NO3] for the months of August and September 2009 appear to be anomalously low; this corresponds with the anomalously low [NH4] in this period (Figure 29).
Another hydrological process that could cause the nutrient ratio discrepancies is poor water column mixing. This could cause samples to not be representative of the actual locations where the samples were collected. Poor vertical mixing may occur when waters of different temperatures/salinities mix, where sometimes a lower-density water body overrides another. There can also be poor horizontal mixing of the water column where tributaries merge with a larger channel, resulting in water from the smaller tributary hugging one bank of the channel for some miles (as is seem in the Cache/Yolo Complex where the main sloughs flow into the wide channel). These problems highlight the importance of using a conductivity meter or other instrument to determine if the proposed sample site shows minimal lateral and vertical variation
Other biogeochemical processes affecting nutrient concentrations
The main process affecting DIN speciation and concentrations is nitrification. A comparison of recent estimates of NO3 and NH4 uptake rates by phytoplankton (Parker et al., 2014) with nitrification rates (O'Donnell, 2014) indicates that nitrification rates are about 100 times the uptake rate of NO3 and 10 times the uptake rate of NH4. Hence, NO3 uptake should have a negligible effect on [NO3] at locations of active nitrification, and we are unlikely to see any significant drop in [NO3] -- and maybe not in [NH4] -- during an algal bloom, even a large one, because the pools of available NO3 and NH4 are so large. Figure 7 is a useful cartoon for illustrating the relative δ15N values of NH4, NO3, and algae produced by the combined effects of nitrification followed by uptake – and the relative sizes of the different pools of N.
Comparison of the location of the [NO3] maxima (Figure 29) with chlorophyll concentrations (Figure 31) provides qualitative evidence that the broad [NO3] maxima overlaps in time and space with chlorophyll maxima that extends from RM10 to Angel Island. The chlorophyll maxima seem to develop about the same time as [NO3] begin to drop, perhaps suggesting a causal relation. This relationship is compatible with an explanation that NO3 is the dominant N source to algae in this region. However, it is unclear at this point whether nutrient drawdown during even a huge algal bloom is sufficient to produce a significant drop in NO3 or NH4 concentrations in the mainstem Sacramento River, although a strong correlation between NO3 drawdown and chlorophyll-a increases in observed in real-time data from Liberty Island (Brian Bergamaschi, personal communication, 2014).
For ecosystems where chlorophyll-a and pheophytin are the dominant types of chlorophyll present, the ratio of chlorophyll-a to total chlorophyll is commonly used as indicator of algal "freshness". Comparison of the spatial nutrient patterns with a plot of the ratio of chlorophyll-a to total chlorophyll (Figure 32) shows that algae quality is generally lower (low ratios) upstream of RM12 where NH4 concentrations are generally higher. Algae freshness increases downstream of RM10 as [NH4] decreases. The broad NO3 maxima and upstream elongated total chlorophyll maxima in May to June 2009 qualitatively correspond with an even broader zone of high chlorophyll ratios, indicating a major persistent source and/or growth of algae in this period. An alternate explanation of some of these patterns is that uptake of nutrients by cyanobacteria (which produces chlorophyll-b) may be a significant sink for nutrients and source of total chlorophyll at some dates and sites (Glibert et al., 2014). Macrophytes could also be significant sinks of NO3 or NH4.
The calculated C:N values of DOM for Sacramento River samples ranges from about 5-40, with an average of ~25 (data in Foe et al., 2010). This finding, plus the observation that the δ13C and δ15N values of DOM are often very similar to those of algal-dominated POM, suggest that a large portion of the DOM may not be terrestrial in origin and contains a significant fraction of DOM probably derived from organisms like bacteria or algae -- and hence is readily bioavailable; some of the DOM (e.g., the DOM with C:N ~ 5 from March 16, 2009) in waste-water may also be bioavailable. The analysis of dissolved inorganic and organic matter samples for isotopic composition can sometimes help constrain interpretations of the nutrient sources and biogeochemical processes. For example, an alternative explanation of the rise in [NH4] between RM38 (Hood) and RM31 (Kenady) is ammonification of organic matter released from the SRWTP. Also, the dramatic increase in DOC-δ13C while [DOC] decreased downstream of SRWTP in March 2009 (Figure 33) suggests consumption of DOC -- perhaps by bacteria related to the oxidation of NH4 during nitrification.
Evidence for temporal variation in effluent flow affecting chemical and isotopic compositions
The first indication we had that tidal cycles (and their effects on effluent concentrations in the river) might be a significant cause of the small oscillations we saw in the chemical and isotopic compositions in the Sacramento River – and other anomalies – was the oddly consistent "dip" in [NH4] and other constituents that occurred near RM27 on many transects, as discussed below. According to O'Donnell (2014), during typical Sacramento River flows, effluent commonly makes up 1-3% of total river flows, resulting in NH4 concentrations downstream of SRWTP ranging from 20-55 uM. According to the SRWTP monthly reports to the state, effluent loads in March and April 2009 varied by about a factor of 2.
[NH4] measured at the DCC site at ~RM27 during the March and April 2009 transects show a sharp drop compared with sites immediately upstream and downstream (Figure 11 and Figure 12). Chlorophyll levels at the DCC site are lower too. In contrast, [NO3] values at the DCC site agree with adjacent sites. We originally wondered if these odd drops in concentration for sections of the river with no known water inputs might be an artifact of some kind and not really representative of the Sacramento River, perhaps because adjacent samples were not all collected on the same outgoing tide. Later we suspected that samples collected at this site during the March and April 2009 transects were somehow contaminated from leakage from the DCC or from the nearby Georgiana Slough, even though the DCC gates were closed during the sampling, and the flow through the DCC and Georgiana Slough is generally out of the river. Since both samples were collected at low tide (see Figure 11 and Figure 12) when flows were highest and when tidal pressure was pulling water downstream, we hypothesized that perhaps there was leakage from the DCC or slough during the times when the samples were collected. However, we noted that the samples from the slightly downstream Walnut Grove site collected by Chris Foe during his transects sometimes also showed dips in [NH4]. However, Foe always collected his samples on ebb (seaward flowing) tides, so leakage from the DCC and Georgiana Slough would seem to be a less likely interpretation of the odd chemistry of the DCC samples.
The SRWTP regulates their instantaneous discharge of effluent to meet their river to effluent ratio of 14:1 (<6.7% effluent in the river); effluent outflows are thus decreased during low river flows, and discharge is completely halted when flows are below ~1200 cfs (O'Donnell, 2014). However, some effluent does flow upstream during tidal reversals. During periods of low river flow (<5,000 cfs at Freeport), tidal reversals occur multiple times at the WWTP outflow site. This can lead to sections of the river that have received little to no effluent. Hence, shutoffs of SRWTP effluent may explain the low [NH4] of the March and April 2009 DCC samples. Samples at the DCC site on both transects were collected at about 12:30 pm at slack low tide, and there is about a 1 hour difference between slack tide at SRWTP and the DCC (Figure 9).
Travel times for the DCC site for these dates estimated using DSM2-Qual were about 1 day for travel from the SRWTP. Hence, a plausible explanation for the anomalously low [NH4] in most samples collected at ~RM27 is that these samples represented water from a "slug" of water that passed by the SRWTP during slack tide when effluent discharge was low or shut off. Since the sampling of most transects discussed in this report started at the most upstream site soon after dawn on high ebb tide, it is easy to see how the sampling at ~RM27 might have occurred at about the same position in the tidal cycle on many transects.
Many constituents show some kind of maximum (or minimum) at either the L37 (RM 21) or Kenady (RM31) sites. Samples from both the March and April 2009 transects were collected at Kenady at slightly lower river stages than samples collected at L37 (Figure 11 and Figure 12). Comparison of the downstream variation in the compositions of both relatively conservative tracers of water source (and dilution) like water-δ18O, EC, and silicate – and non-conservative tracers like NH4 – shows that many parameters exhibit small oscillations at the same RM, suggesting that the cause is temporal variations in water sources (Figure 34). However, many parameters do NOT oscillate in composition (Figure 35), but instead show gradational downstream changes in composition indicative of processes relatively unaffected by changes in effluent loads.
Hence, the data from river transects in 2009-2010 show ample evidence that temporal variations in effluent dilution could be the cause of some of the downstream variation in the chemical and isotopic compositions of samples collected during transects of the Sacramento River, especially during low flow conditions. This observation was one of the main motivations behind a recent study (2013-2014) which involved using a Lagrangian approach to track changes in nutrient and algal dynamics along the Sacramento River (RM65 to RM10), conducted by a team of USGS and other scientists led by Tamara Kraus (USGS). During that study, separate parcels of Sacramento River water, with and without effluent, were each sampled multiple times during several days of travel downstream of SRWTP, and the samples were analyzed for a comprehensive suite of chemical, isotopic, and biological parameters (Kraus et al., 2014).
N sources to algae
The δ13C, δ15N, and δ34S values of POM samples provide very useful information about (1) the relative amounts of different types of organic materials (mainly algae, bacteria, and terrestrial plants) that are combined together to make the POM, and (2) the ambient biogeochemical processes that affected the δ13C, δ15N, and δ34S of the dissolved species where the aquatic organic matter grew (Finlay and Kendall, 2007). Figure 36 (from Finlay and Kendall, 2007) shows the observed and typical ranges of the δ13C, δ15N, δ34S, and C:N values of different types of organic matter that contribute to aquatic POM. The C:N value of POM is a simple but extremely useful measure of how much of the POM is derived from algae and bacteria versus terrestrial organic matter; in this report, all C:N values are reported as atomic (at.) ratios, not mass ratios. The Redfield atomic C:N of algae is 6.6, bacteria can have C:N values as low as 4, fresh terrestrial organic matter and aquatic plants generally have C:N values >13, and degraded organic matter and wood can have much higher C:N values (Finlay and Kendall, 2007). Since bacteria growing in the water column probably have δ13C and δ15N values similar to algae growing in the same locations, and we have no easy way to physically separate them prior to isotopic analysis, when we refer to "algae" in this report we actually mean algae plus some unknown amount of bacteria.
Figure 37, Figure 38, and Figure 39 show the spatial distributions of δ13C, δ15N, and C:N values (respectively) of samples from mainstem, distributary, and slough sites. The main observation is that there is a high degree of temporal variability at most sites, suggesting minimal consistency of site-specific and/or travel-time specific organic matter sources and/or biogeochemical processes. The slough sites in the Cache/Yolo Slough Complex show more temporal variation than mainstem/distributary (e.g., river) sites, with generally lower δ13C, higher δ15N, and lower C:N than river sites. These slough site compositions are consistent with an interpretation of (1) higher percentages of algae in slough POM than in river POM, and (2) that the dissolved inorganic carbon (DIC) and dissolved inorganic nitrogen (DIN) in the locations where most of the slough algae samples grew was isotopically fractionated in a direction that suggests drawdown of both the DIC and DIN pool by photosynthesis and uptake, which is reasonable for a slough complex dominated by shallow waterways, low flow, and minimal flushing with river water.
POM isotopic information can also be used to evaluate the relative contributions of algae and terrestrial organic matter to bulk POM and how these contributions vary with season and flow (Kendall et al., 2001). One graphical means for evaluating temporal and spatial changes in POM sources and processes is to plot the data on cross plots, in this case δ13C vs. C:N (Figure 40), δ13C vs. δ15N (Figure 41), and δ13C vs. δ34S (Figure 42), with different symbols for different geographic areas of the samples. The approximate compositional ranges of major types of POM (e.g., freshwater plankton, aquatic plants, etc) in the SFE are denoted by colored lines outlining boxes. The ranges of values for each box are subjective and based on our experience with SFE samples, and are only provided for general comparative purposes.
There is a range of opinions about the likely accuracy of estimates of the relative contributions of different types of plants to POM made using bulk POM isotope data. Kendall et al. (2001) argued that in large rivers like the Mississippi River: (1) terrestrial organic matter and macrophytes growing near the river margins are unlikely to be significant contributors compared with aquatic algae and bacteria except under high-flow conditions; (2) endmember source compositions determined by collecting and analyzing large sets of "single source" samples from large watersheds are unlikely to be valid when used for estimating POM sources in algal-dominated ecosystems with large spatial variations in algae compositions; and (3) ancillary chemical and hydrologic data are extremely useful for refining and extending the interpretations of POM sources beyond the source characterizations that could be done solely with isotopic and elemental ratios. The ancillary data were especially useful for differentiating between seasonal changes in POM source materials and the effects of local nutrient sources and in-stream biogeochemical processes.
In contrast, in his detailed study of the δ13C, δ15N, and C:N of 868 plants samples from the SF Bay and Delta, Cloern et al. (2002) showed as much as 5-10 ‰ variation in δ13C and δ15N among plant group types -- related to different habitats, seasonal growth cycles, and living versus dead biomass -- and concluded that the wide variability of δ13C and δ15N within each pool of organic material made it impossible to apply simple mixing models to determine the contribution of different plant types. This finding is one of the reasons that a more elaborate multi-isotope and multi-tracer approach was used for this and our other SFE studies. In specific, we wanted the POM isotopic and elemental composition to be interpreted in conjunction with other isotope, chemical, and hydrologic data, so that the combined dataset would be useful for providing insight into the biogeochemical processes occurring within the ecosystem and spatial and temporal changes in the δ15N and δ13C in the water column that control the isotopic compositions of algae.
We find that the combination of δ15N and δ13C – with the important addition of C:N ratios -- was very useful in the Bay and Delta ecosystem for making the basic distinction between POM of algal origin (low C:N) and POM from terrestrial plants and soils (higher C:N). Without considering C:N, there is so much overlap between the δ13C and δ15N values of algae and other sources that one might overlook the usefulness of isotopes for distinguishing POM sources. Although we cannot use our data to estimate the contributions of POM from a specific plant species to the bulk POM collected at a specific date and site, spatial and temporal trends in the POM isotopic compositions (and the algae isotopic compositions estimated from the POM samples) usually reveal changes in source categories and/or processes.
The average C:N of slough POM samples was slightly lower (7.9 ± 1.2) than the average C:N of POM from RM44 to Isleton ( 8.6 ± 0.9), indicating that there was probably a slightly higher proportion of algae in slough POM samples than in POM samples from Sacramento River. Furthermore, the lower C:N values of many POM samples from the Cache/Yolo Slough Complex area (Figure 40) indicates that some POM samples collected contained a higher proportion of algae than observed in POM samples from Sacramento River and Delta sites. Combined together, these differences in C:N suggest higher algal productivity in the sloughs than in the mainstem. This hypothesis is supported by the higher chlorophyll-a concentrations (Figure 31) and higher ratios of chlorophyll-a to total chlorophyll (Figure 32) observed at Rio Vista (RM12) than at Isleton (RM17), since Cache Slough converges with the mainstem Sacramento River at ~RM14. The ~2 ‰ lower POM-δ13C values of slough samples than Sacramento River samples (-29.5 vs. -27.3‰) is also consistent with more photosynthetic activity occurring in the sloughs.
The average differences in the δ15N values of POM, NO3, and NH4 of slough versus Sacramento River samples (from RM44 to Isleton) suggest significant differences in the relative uptakes of NO3 vs. NH4 in these two areas. The average POM-δ15N for Cache/Yolo Complex tributaries ("Slough sites") is ~2 ‰ higher than for Sacramento River or Delta sites (Figure 41), which suggests that the dominant N source (NH4 and/or NO3) to uptake in the Cache/Yolo Slough Complex would also have a δ15N that was ~2 ‰ or higher than in the Sacramento River, since the δ15N of the N source must be higher than the δ15N of the algae (Figure 7). However, average NO3-δ15N values for slough samples are generally not significantly higher (+6.4 ± 1.4‰ vs. +5.8 ± 1.6‰) than for river samples (Figure 25; Table 3), and NH4-δ15N values for slough samples are generally not significantly higher (+10.9 ± 2.8 ‰ vs. +9.3 ± 1.2 ‰) than for river samples (Figure 22; Table 3). Since there are no major average differences in the δ15N of nutrients between the sloughs and the Sacramento River, the higher δ15N of POM in the sloughs versus the river is most easily explained by a higher proportion of NH4 uptake than NO3 uptake in the sloughs compared to the river. An alternative explanation is that the higher POM-δ15N values in the sloughs can be explained by less algal production in the Toe Drain where the NH4-δ15N is +8.1 ‰ compared to rest of the sloughs sites where the average NH4-δ15N value is +11.7‰ (Table 3).
POM show a very wide range of δ34S values, ranging from -8 ‰, a typical value for organic matter from reducing environments such as wetlands, to over +25 ‰, more positive than typical marine SO4 (Figure 42). The high δ34S values for a few samples upstream of Isleton and upstream of SRWTP are very surprising and will be further investigated; the average δ34S values for these sites is a reasonable +4 ‰ (Table 3). The average δ34S value for the Cache/Yolo Complex sloughs is about +1 ‰, generally lower than observed elsewhere in the river and delta sites, except for Lindsey Slough which has an average δ34S of +4.6 ‰. Lindsey Slough also has a distinctively higher POM-δ15N than the other sloughs, suggesting that there are different N and S sources and/or significant differences in biogeochemical reactions in Lindsey than nearby sloughs.
Evidence for temporal and spatial variation in NO3 vs NH4 uptake by algae
The Nutrient section above established that nitrification of NH4 derived from the SRWTP resulted in δ15N values of NH4 and NO3 that became progressively distinctive downstream of effluent inputs from SRWTP. Hence, comparison of the relative δ15N values of NH4 and NO3 with the δ15N values of POM samples that had low C:N values indicative of samples containing predominantly algae and bacteria, should allow an estimate of whether the dominant source to algal growth at any particular site and date is NO3 or NH4 (per Figure 7). The average C:N ratio of the POM for the March and April 2009 transects is 8.0, which indicates that the POM is composed predominantly of phytoplankton, with or without bacteria; hence, the δ15N of POM was used as a proxy for δ15N of phytoplankton.
Figure 43 and Figure 44 compare the actual measured POM-δ15N values for March and April 2009, respectively, with calculated values for δ15N for algae that assimilates only NO3 and for algae that assimilates only NH4. For these calculations, we assumed that the isotope fractionations for NO3 and NH4 uptake by algae were both 4 ‰. Since the average C:N for these POM samples is ~8, these samples are clearly dominated by algae and bacteria. Hence, the measured POM-δ15N can be used as a reasonable proxy for the actual algae-δ15N. The basic idea is that if algae only assimilated N from NH4, the calculated algae-δ15N line would be similar or parallel to the "Algae using NH4" line. In contrast, if algae only assimilated N from NO3, the calculated algae-δ15N line would be similar or parallel to the "Algae using NO3" line.
Comparison of the lines for actual vs. calculated algae-δ15N values makes it easy to see that algae generally assimilate NO3 at upstream sites and then switch to mostly NH4 uptake downstream of the SRWTP after encountering the higher concentrations of effluent-derived NH4. Between RM62 and RM50, algae-δ15N for the March transect is a few ‰ lower than NO3-δ15N while the δ15N-POM and δ15N-NO3 for the April transect are almost identical. This difference between sampling dates can be explained by differences in NO3 concentration. When nutrients are abundant, the assimilation rate for nutrients with low δ15N is higher than for nutrients with high δ15N, producing phytoplankton with δ15N values typically a few ‰ lower than that of their nutrient source. When nutrients are scarce or growth rate is low, phytoplankton discrimination between N isotopes is reduced, resulting in phytoplankton with δ15N values closer to or equal to their nutrient source.
On both the March and April transects, the δ15N-POM values decrease downstream by 3 to 8 ‰ between RM44 and RM15. The decrease in δ15N-POM is concurrent with decreasing chlorophyll concentrations (Figure 17 and Figure 18) and the increase in [NH4] from the SRWTP. The greater change in δ15N-POM occurs during the April transect, perhaps due to the lower upriver [NO3] causing a relatively greater impact on δ15N values by the newly added NH4. The decrease in δ15N-POM is consistent with a switch in nutrient sources from NO3 to NH4 during downstream travel. From about RM15 to RM-15 for the March transect, δ15N-POM increases while chlorophyll concentrations show only a small increase. This increase in δ15N-POM is concurrent with the increase in δ15N-NH4 and further indicates that phytoplankton is using NH4 rather than NO3 after entering the zone of increased [NH4] below the SRWTP. The evidence of a downstream switch from mainly NO3 assimilation to mainly NH4 assimilation is consistent with effluent addition experimental results that conclude that high upstream [NH4] appears to inhibit NO3 uptake and large algal blooms until nitrification drops [NH4] to ~4 μM (Parker et al, 2012).
Graphical means for evaluating the relative dominance of NO3 vs NH4 uptake
Figure 45 shows how plotting the δ15N of algal-dominated POM vs. NO3-δ15N provides a simple means for evaluating whether NO3 or NH4 is the dominant source of N to algae. Since the δ15N of algae should always be lower (generally 4 ‰ more lower) than the δ15N of its N source, data points that plot above the 1:1 line – and especially data points that plot 4 ‰ or more above the line – indicate that whatever nutrient δ15N value is plotted on the y-axis is a significant source of N to the algae plotted on the x-axis. In contrast, if the data points for NO3-δ15N plot below the line, then NO3 cannot be a significant source of N to algal growth. Hence, sometimes data about the δ15N of NH4 are not needed to evaluate whether NO3 or NH4 is the dominant source – if most or all of the data points for NO3-δ15N plot above the line. For example, in a recent study of the δ13C and δ15N of Microcystis in the San Francisco Delta, we later wondered what the source of the N to the Microcystis was. Although archived samples were only preserved for δ15N analysis of NO3 but not NH4, we were still able to determine that the dominant source of N to almost all the sites and dates was not NO3 – and hence was almost certainly NH4 – because almost all the data points plotted below the1:1 line on a plot like Figure 45 (Lehman et al., 2015).
The δ15N values of NH4, NO3, and POM for samples from the March and April 2009 transects were compared to evaluate the dominant source of N to algae (Figure 46). Only data for POM samples with C:N ≤ 9 are plotted; these are samples were most of the POM is composed of algae. There are two symbols for most of the POM (≈ algae) samples, one for samples analyzed for NH4-δ15N (pink symbols) and one for samples analyzed for NO3-δ15N. Data that plot above the 1:1 line, and especially 4 ‰ above the line, indicate that these NO3 and/or NH4 values are consistent with being major sources of N to the corresponding algae samples. Note that most of the symbols plotting above the 4 ‰ are the pink ones denoting NH4-δ15N samples, not the blue ones denoting NO3-δ15N.
Almost all of the pink data points for NH4-δ15N plot in a linear band (denoted by a pink arrow) above the 4‰ line. This increase in NH4-δ15N with increasing algae-δ15N is caused by the progressive fractionation of the NH4 pool during nitrification (Figure 15), followed by assimilation of NH4 with progressively higher δ15N values by algae. Hence, this linear trend of data (Figure 46), where the algae-δ15N is positively correlated (R2=0.46 for C:N ≤ 9; R=0.51 for C:N ≤ 8.5) with the NH4-δ15N, strongly suggests that NH4 is the dominant N source for these samples.
In contrast, almost all of the blue NO3-δ15N values fall in a tight grouping between the 1:1 and the 4 ‰ lines, indicating that NO3 is a much less plausible dominant source of N for these samples. The NH4 data with the highest δ15N values correspond to the lowest NO3-δ15N values, ones close to or below the 1:1 line, which suggests that these samples have the highest % NH4 uptake; and the NH4 data with the lowest δ15N values correspond to the NO3-δ15N values above or close to the 1:1 line, which suggests that these samples probably have the lowest % NH4 and hence the highest % NO3 uptake. Comparison of the δ15N values for NO3 and NH4 on Figure 46 with Figure 43 and Figure 44 indicates that the samples with the highest NH4-δ15N values on Figure 46 are all from sites downstream of Rio Vista (RM12). Hence, the samples from downstream of Rio Vista, where NH4 concentrations have dropped to about 25% of their original concentrations, is where the % NO3 uptake is minimal. This interpretation is consistent with the findings in Parker et al. (2012).
Figure 47 shows all the δ15N data for NO3, NH4, and POM samples from 22 transects conducted 2009-2010, for POM samples with C:N ≤ 9. The general patterns are similar to the data for two transects shown in Figure 46, except that a fair number of NH4-δ15N values for this larger dataset plot below the 4 ‰ line, and even a few below the 1:1 line, indicating that NH4 was NOT a major source of N to algal growth for these sites and dates. Hence, a reasonable conclusion is that more of the samples collected over a longer sampling interval show significant amounts of NO3 uptake than was observed for March and April 2009. More accurate estimations of the relative amounts of NH4 and NO3 uptake require more sophisticated evaluation of the actual isotopic fractionation factors (ε) for NH4 and NO3 uptake for individual samples or transects. As a general rule, when the concentration of the nutrient being utilized is high, isotope fractionations are generally larger than when the concentration is lower (Fogel & Cifuentes, 1993). Fractionation factors are also affected by algae species and other factors. Glibert et al. (2014) show that uptake by cyanobacteria may be significant under some conditions in the Delta; a downstream transition from mainly algal uptake to mainly bacteria uptake may be associated with changes in both nutrient preferences and fractionation factors. Hence, a more sophisticated method for estimating relative contributions of NH4 and NO3 uptake that provides more a quantitative assessment will require consideration of non-constant fractionation factors.
Calculating relative contributions of NH4 and NO3 to algal uptake
In order to calculate the relative proportions of N from nitrate and ammonium assimilated by algae, we must have accurate data for the δ15N of the algae. Ideally, we would have liked to isolate pure algae from our POM samples and then analyze the pure algae for isotopic composition. However, methods to physically separate algae from non-algal POM require large water samples, are difficult to piggyback onto monitoring programs, and are difficult and time-consuming. Therefore, instead of processing a small number of manpower-intensive samples to isolate pure algal biomass for isotopic analysis using the Hamilton et al. (2005) "Ludox" density separation method or a new flow cytometry method being developed by colleague Calla Schmidt (Schmidt et al., 2013), we have chosen to collect bulk POM from all the sites sampled ~monthly for water chemistry, and then to estimate the δ15N and δ13C of the algae in bulk POM samples by use of a two-component mixing model, revised from Francis et al. (2011) with the assistance of Don Phillips (Don Phillips, personal communication). This approach is especially feasible since the average C:N of POM in the SF Bay and Delta is 8.5 ± 1 (with values ranging from 5.4 to 13.6), indicating that many POM samples contain a large fraction of algae.
Using this mixing model, we can estimate the δ15N of algae in our POM samples by assuming that POM consists of two components: algal biomass and terrestrial matter. In order to calculate the δ15N and δ13C of algae, we have estimated average δ15N, δ13C, and C:N values for the terrestrial endmember, using literature values (Cloern et al., 2002) and our own large datasets from terrestrially-dominated local water sources. We additionally assume that the C:N value for the algal endmember is the Redfield ratio: C:N = 6.6. However, since we find no statistically significant differences in the δ13C and δ15N values of POM samples from the same locations that have C:N <7 or C:N <8.5, we have assumed that POM samples that have C:N values as high as 8.5 are ~ all algae.
Since 60% of our SF Bay and Delta POM samples have C:N ratios between 6.6 and 9, while terrestrial matter has C:N ratios of 15 or more, the calculated δ15N and δ13C values of algae are usually not very different from the original δ15N and δ13C of POM. Complications with the estimated values derive from uncertainty about the non-algal POM component, which includes bacteria, terrestrial and aquatic vegetation, and soil. For example, should we be using slightly different δ15N, δ13C, and C:N values for terrestrial organic matter derived from the different dominant water (and presumably organic matter) sources (e.g., the Sacramento River upstream of SRWTP, Cache/Yolo Complex sloughs, San Joaquin River, or bay/marine sources) to different sections of transects? But perhaps the most important uncertainty is in the fraction of bacteria which has low C:N values similar to algae, in contrast to relatively high values of soil and vegetation. Refinements to the model are in progress.
Using the calculated δ15N value for algae, we can then calculate the fractions of algal N assimilated as NO3 and NH4 for each site and date, using a model previously described by York et al. (2007). For this calculation, we use measured values for the δ15N of nitrate and ammonium. The fractionation factor for algal uptake of nitrate (Ɛ = 4 ‰) is estimated using literature values (Fogel & Cifuentes, 1993), which are consistent with fractionation factors we have calculated in other nitrate-dominated systems (Finlay & Kendall, 2007). The fractionation factor for algal uptake of ammonium is estimated within the model, with the constraint that a consistent fractionation factor applies to all the samples from each transect. We find that sensitivity to small changes in fractionation factor is low, especially in the context of relative NH4 uptake within a transect.
Plots of river miles vs. % NH4 uptake along the Sacramento River show a spectrum of trends downstream for the different transects. We include one example (Figure 48) for the August 2009 transect, where calculations were performed using 3 different fractionation factors for NH4; a line connects average % NH4 uptake values calculated at each site. Results from this model indicate that the percentage of NH4 (as opposed to NO3) assimilated decreases downstream from ~60% at RM40 to ~30% at RM12 (Rio Vista), opposite to the general trend observed in Parker et al. (2012, 2014), and then increases where the San Joaquin River converges with the Sacramento River (RM0). It is possible that the increase in % NH4 at RM0 is due to mixing of NO3 and algae formed in two different environments instead of algae growing in a location where the nutrients are well mixed. The δ34S of POM may be useful in identifying where the algae actually grew, and is evaluated further below. (Estimation of the relative contributions of nutrients and organics from the Cache/Yolo Complex tributaries to the Sacramento River downstream of Rio Vista)
Further statistical analysis is needed to resolve complicated effects of flow, NH4 and NO3 concentrations, travel time, etc. In addition, algal community composition, nutrient concentrations, and growth rates affect assimilation fractionation factors. However, these results demonstrate that this approach shows promise as a tool for direct measurement of in-stream uptake of different nutrient sources that can be piggybacked onto routine monitoring programs designed for habitat characterization. This information can help us identify and quantify the impacts of N loads from different sources, which in turn can inform watershed management.
Mass balance modeling
A major goal of this project was to evaluate whether isotopic data would allow accurate estimations of the relative amounts of NO3, NH4, and organic matter from different types of sources to specific locations, under different hydrological conditions and seasons. In particular, there was interest in evaluating (1) how much of the NH4 that Dugdale et al. (2007) suggested was causing inhibition of large algal blooms in the Sacramento River and Delta was derived from SRWTP versus agricultural sources in the Cache/Yolo Complex sloughs; (2) how much of the algae in the Delta downstream of Rio Vista was growing in place versus derived from the Sacramento River upstream of Isleton and/or from the Cache/Yolo Complex sloughs that converge with the mainstem at ~RM14; and later, (3) how much of the N assimilated by algae growing in some of the Cache/Yolo Complex sloughs, and supporting fish nurseries, was actually derived from the Sacramento River and specifically from NH4 and/or NO3 originally derived from effluent from SRWTP.
Isotopic compositions can be used in mixing models the same way chemical compositions are used. For example, if conservative mixing is the main process affecting the distribution of nutrients in the estuary, the δ15N of NO3 (and similarly NH4) at a location in the estuary can be estimated from a simple mass balance equation: [NO3](total)* δ15N(total) = [NO3](A)*δ15N(A) + [NO3](B)*δ15N(B), where A and B are the two main end members (e.g., fertilizer NO3 and waste-water NO3, or waste-water NH4 and agricultural NH4). If the nutrient concentrations are not conservative because of biological processes (e.g., uptake or nitrification), the isotopic "signatures" of these processes might mask the effects of mixing of different sources, making identification and quantification of sources much more complicated. However, the changes in concentration and δ15N during progressive reactions can be calculated and added to the conservative mixing equations.
Estimation of the relative contributions of nutrients and organics from the Cache/Yolo Complex tributaries to the Sacramento River downstream of Rio Vista
The first step towards evaluating whether mixing calculations using isotopes and chemical data are likely to provide valid estimates of relative contributions of nutrients and organics from the Cache/Yolo Complex sloughs to the Sacramento River downstream of the Cache/Yolo Complex is to determine if the proposed endmembers (e.g., the Sacramento River at Isleton and the Cache/Yolo Complex sloughs) have sufficiently distinctive compositions. Figure 49 shows the approximate locations of the slough sites sampled during this study, and the locations of the Isleton and Rio Vista sites on the Sacramento River. Isleton is the site immediately upstream of the confluence area (~RM17) and Rio Vista (RM12) is the site immediately downstream of the confluence. There are 15 isotopic and chemical parameters where the datasets are sufficiently complete to merit statistical analysis. Unfortunately, analyses for H20-δ18O, H2O-δ2H, and DOC-δ13C are still in progress and were hence excluded from the analyses discussed below. However, limited data (Table 3) suggest that all three parameters probably show significant differences between the proposed endmembers.
Table 4a shows statistical comparisons (unpaired t-tests) between Sacramento River water at Isleton (R) and water from the Cache/Yolo Complex tributaries/sloughs (T). All the chemical and isotopic data from all samples collected as part of this study at Isleton and at the 7 slough sites listed in Table 1 and shown on the map (Figure 49), were pooled for these unpaired t-test statistics. With the exception of NO3-δ18O and NH4-δ15N, all 13 other measured parameters showed statistically significant differences between values for Isleton and values for the combined set of Cache/Yolo Complex sloughs. However, because there is considerable temporal variation in the chemistry and isotopic compositions for many sites (Figure 28, Figure 29, Figure 31 and Figure 32), we conducted paired t-tests of the statistical differences for each pair of Isleton and slough samples collected during the same sampling cruise to eliminate any effects of seasonal variation in composition.
Paired t-tests (Table 4b) were computed by pairing the date-specific data for Isleton with each of the tributary samples collected at the same date, so that the number of pairs for each parameter was approximately equal to the number of tributary samples with data for each parameter, with 79 pairs on average. The paired t-test data, like the unpaired t-tests (Table 4a), show that NO3-δ18O and NH4-δ15N are not statistically significantly different between Isleton and Cache/Yolo Complex slough sites. However, using the paired t-tests POM-δ34S values were now not significantly different, largely because POM-δ34S values for 2 of the sloughs (Cache Slough @ DWSC and Lindsey Slough) were 3-5 ‰ higher than the other 5 sloughs (Table 3). Of those 5 sloughs, 3 of them were only sampled 2-5 times, probably insufficient data to be confident that the temporal variability had been adequately sampled. In addition, using the paired t-tests, all of the P values for the significant differences were much lower compared to the unpaired t-tests; in the case of [NH4], the paired t-test reduced the P value by >15 orders of magnitude, and several other comparisons had P values that were 4-8 orders of magnitude smaller. Therefore, 13 of the 15 chemical and isotopic parameters show statistically significant differences when data for Isleton are compared with data for Cache/Yolo Complex slough samples collected at the same time.
For the 4 of the 7 slough sites that were sampled ~21 times 2009-2011 as part of both the Foe and Slough studies (Table 3), paired t-tests were conducted to compare water at Isleton versus data from each separate slough site (Table 5a, Table 5b, Table 5c, and Table 5d). The number of statistically significant parameters for the 4 sites ranged from 9 for Liberty Island to 13 at the Toe Drain. All 4 slough sites showed significant differences for 5 parameters; in specific, T>R for chlorophyll-a, specific conductivity, [NO3], [PO4]; and T<R for POM-δ13C. This set of common parameters is consistent with higher amounts of agricultural nutrients (NO3 and PO4), more evaporation, larger algal blooms, and more photosynthesis in the sloughs than at Isleton and upstream Sacramento River sites.
Of the 2 parameters that did not show significant unpaired t-test differences (Table 4a) between Isleton and the complete set of Slough sites (NO3-δ18O and NH4-δ15N), 3 of the 4 slough sites also showed non-significant paired t-test values for NO3-δ18O (all but Toe Drain), and 3 of the slough sites also showed significant paired t-test values for NH4-δ15N (all but Lindsey). Toe Drain, unlike Liberty Island and Cache @ DWSC, showed lower NH4-δ15N values than Isleton. In summary, most measured parameters showed statistically significant differences between major tributary vs river sources, for unpaired and paired t-tests, indicating that traditional chemistry plus isotopes can be used to quantify the relative contributions from these sources.
One of the most exciting results of the unpaired t-test comparison of pooled Cache /Yolo Complex tributary samples with samples from the Sacramento River at Isleton is that POM from the tributaries has a low, significantly different δ34S (Table 4a). Paired t-tests showed that POM-δ34S values were not significantly different (Table 4b), largely because POM-δ34S values for 2 of the sloughs (Cache Slough @ DWSC and Lindsey Slough) were 3-5 ‰ higher than the other 5 sloughs (Table 3). However, the other 2 sloughs that had enough δ34S data for statistical analysis (e.g., Toe-Drain @ Dredger and Liberty Island), both had low POM-δ34S values averaging -0.5 ‰. A reasonable explanation for these low δ34S values is sulfate reduction in the upstream rice farming areas (Kendall et al., 2010; B-D talk). These low δ34S values in the Cache/Yolo Complex provide a useful "fingerprint" that can be used to identify fish and other organisms that spent a portion of their early life foraging on the Yolo Bypass (as sampled at the Toe Drain @ Dredger site) and several other sloughs (Johnson et al., 2014).
There appear to be 4 different important sources of SO4 in the estuary that affect the δ34S of organic matter growing in the estuary, as shown in Figure 50 for the April 2009 transect: (1) water from the Sacramento River upstream of SRWTP, (2) WWTP effluent, (3) tributaries in the Cache/Yolo complex, and (4) marine-derived water from the Bay. The fact that POM from the Cache Slough area has an isotopically distinctive δ34S value is currently being used to identify fish populations that live most of their lives in the Sloughs (Johnson et al., 2014); since the average C:N (n=89) of POM samples from these sloughs is 7.9, we are comfortable concluding that the POM at these sites is largely algae. The drop in POM-δ34S values downstream of SRWTP is probably because of the SO2 gas added to the effluent to "polish" the water to remove chlorination byproducts.
Comparison of data from the mainstem Sacramento River and its major distributaries
One of the complications for mass balance modeling within and downstream of the Cache/Yolo Complex confluence area is the two under-sampled Sacramento River distributaries: Miner Slough and Steamboat Slough (Figure 51). These sloughs carry water diverted from the Sacramento River downstream of SRWTP to the Cache/Yolo Complex area. These important sloughs were generally "believed" to have the same chemistry as the mainstem Sacramento River and hence were not included in the sampling design for the Dugdale-Parker cruises or the Foe NH4 monitoring project. However, we are unaware of any systematic sampling of either of these slough for water chemistry (or isotopes) before we started our first pilot studies for the development of our "Slough study", which formally started sampling in 2011. Hence, at that time, there appeared to be no basis for the general belief that one or both of the distributaries had the same chemistry as the mainstem Sacramento River.
When we alerted Chris Foe about this complication in January 2010, he was willing to collect samples from these two sloughs (collected roughly a mile upstream of their confluences with Prospect Slough), plus a sample from near Courtland where Sacramento River water is diverted to Miner Slough, during his January and February 2010 sampling cruises. The concentration data associated with these samples are reported in Foe et al (2010). The compositions are very similar to samples from Sacramento River sites during these same dates. However, because of the high flow during these collection periods, these samples are not a very good test of whether the distributaries have chemical compositions similar to water in the mainstem Sacramento River. Hence, we concluded that additional sampling was required to assess whether the water in these 2 sloughs was similar enough in chemistry and isotopic composition to water of similar travel times in the mainstem that we could continue with mass balance calculations within and downstream of the Cache/Yolo Complex confluence during transects where we had no chemical and isotopic data for the distributaries (i.e., the 2009-2010 transects).
These 2 sloughs (technically "distributaries" since they are additional channels of the Sacramento River) contain a large part of the combined flow of the Sacramento River. For example, a comparison of net flows for 3 sites on the Sacramento River (Kenady, Isleton, and Rio Vista) and 3 slough sites for the dates of the March and April 2009 transects (Figure 52), shows that the combined flow from Miner and Steamboat Sloughs is about the same as at Isleton during the sampling dates, and roughly equivalent to half the flow at Rio Vista. An examination of the relative net flows for 2009-2010 shows that Miner and Steamboat Sloughs combined usually carry about half the flow of the Sacramento River measured at Rio Vista.
One reason that these 2 sloughs may have been overlooked during the design of the above mentioned sampling programs is that many hydrologists appear to consider the water in Miner and Steamboat Sloughs as Sacramento River water – and expected that the water would naturally be chemically the same as in the mainstem. For example, the DSM2-derived estimates of the proportions of different water sources consider the water from these two sloughs as Sacramento River water. Figure 53 shows downstream variations in water sources during the April 2009 transect, with ~90% of the water at Rio Vista derived from the Sacramento River. However, when the relative flows shown in Figure 52 are used to re-apportion the "Sacramento" water into mainstem Sacramento River and diverted Sacramento River water (i.e., diverted through Miner and Steamboat Sloughs), we see a very different image of water sources to Rio Vista and downstream sites (Figure 54).
From a biogeochemical perspective, it seems strange that waters from these sloughs would be lumped with mainstem Sacramento River sites for any hydrological model – especially one that underpins an important local water quality module (DSM2-QUAL). The water in the sloughs is diverted from the Sacramento River downstream of the SRWTP, and thus the sloughs contain effluent-rich waters. The travel times down the sloughs are ~ 2 days, very similar to the travel times down the mainstem (probably the main reason the waters were lumped hydrologically). While biogeochemical reactions in the sloughs are probably similar to the mainstem (because of the waters are derived from the same source and have almost identical transit times), "probably" is not good enough for such a huge water source to downstream sites. From our brief examination of the sloughs by boat and later examination via Google Maps, we found that Steamboat Slough is similar to the mainstem in terms of channel characteristics such as rip-rock banks and lack of near-river vegetation whereas Miner Slough has a more irregular vegetated margin that is more similar to the biologically active Cache/Yolo Complex sloughs.
During most flow conditions and tidal cycles, Sacramento River water flowing down Miner and Steamboat Sloughs is a much larger source of Sacramento River-derived water to the smaller sloughs in the Cache/Yolo Complex than Sacramento River water flowing past Isleton (RM17) and converging with the Cache/Yolo Complex at ~RM14. The almost complete lack of chemical data available for these sloughs, and the consequent lack of information on the roughly half of the Sacramento River-derived water passing Rio Vista, leaves a potentially large hole in our understanding of this ecosystem and our ability to correctly model contributions of nutrients and organic matter from different sources. Therefore, we designed the Slough Study to obtain the needed chemical and isotopic data. Therefore, with a boat and skipper borrowed from the USGS office in Sacramento, we collected samples on ebb tides irregularly in 2010 and then monthly from April 2011 to December 2012.
The sampling sites are shown in Figure 51 and include: 2 sites on Miner Slough and 2 sites on Steamboat Slough. To establish the original compositions of the waters flowing down the two sloughs, samples were also collected from under the bridges where the two sloughs branched off from the mainstem Sacramento River. The waters that flow down Miner Slough are diverted at RM34 near Courtland, where Elk Slough branches off from the Sacramento River; Elk Slough intersects with Sutter Slough in <0.5 mile, and Miner Slough branches off to form Miner Slough a few miles later. The waters that flow down Steamboat Slough are diverted from the Sacramento River at RM32.4. Samples were also collected from a few other mainstem sites upstream and downstream of the diversions previously sampled as part of the Foe transects, and at important Cache/Yolo Complex slough sites including the 4 sampled as part of the Foe transects.
All the Slough Study transect samples have been analyzed for the same suite of chemical constituents as in Foe et al. (2010), using the same analytical methods, because the samples were submitted to the same UC-Davis laboratory. And samples were collected and archived for the same suite of isotope analyses as used for the Foe transects. However, to date the isotopic analyses are incomplete so we only include data from 2011 in this report. When all the isotopic analyses are complete, and the chemical and isotopic data fully evaluated, these data will help ensure that mixing-model calculations using the chemical and isotopic data generated as part of past and current studies in the Sacramento River and Delta are not misinterpreted.
Table 6a and Table 6b contain the results of unpaired t-tests comparing the chemistry and isotopic compositions of pooled samples from the two distributaries, with the same list of 15 chemical and isotope parameters as in Tables 4 and 5. Table 6a compares the data from the two Miner Slough sites with the data for the two Steamboat Slough sites, and shows that none of the parameters show significant differences. Table 6b compares only the data from the two lower (downstream) sites on Miner and Steamboat Sloughs, and also shows no significant differences between the two distributaries.
Unpaired t-test results for various comparisons of data from the distributaries and the mainstem at Isleton show a few parameters with barely significant differences: namely for [NH4], [PO4], and POM-δ13C. Table 7a shows the comparison of data from Isleton versus data from both of the Steamboat Slough sites, Table 7b shows comparison of data from Isleton versus data from both of the Miner Slough sites, Table 7c shows the comparison of data from Isleton versus data from just the lower Steamboat Slough site (site #26 on Table 1), and Table 7d shows the comparison of data from Isleton versus data from just the lower Miner Slough site (site #27 on Table 1).
Since three parameters showed significant differences for unpaired t-tests, we performed paired t-tests for better comparison of Isleton and the lower Steamboat Slough site (Table 8a), and Isleton and the lower Miner Slough site (Table 8b). For most parameters, the sites were indistinguishable, with barely significant P values in the range of 0.03 to 0.05 for NO3, NH4, chlorophyll-a, and specific conductivity for Steamboat Slough (Table 8a); and a single barely significant P value of 0.04 for POM-δ13C for Miner Slough (Table 8b). All these parameters (except conductivity) that barely significantly differences are ones that show strong downstream trends in the mainstem river (Figure 17 and Figure 18) caused by biogeochemical processes that are largely dependent on travel time. Hence, further investigation of the seasonal variations in relative travel time for the mainstem Sacramento River versus these distributaries might provide some useful information on potential causes of small seasonal differences the chemical compositions of these waters. Furthermore, it will be useful to repeat these statistical analyses when all the isotope analyses of the 2011-2012 samples are complete.
In summary, statistical analysis of the existing data demonstrate that for almost all (11 out of 15) parameters measured, there were no statistically significant differences between Sacramento River water at Isleton and Sacramento River water diverted through Steamboat and Miner Sloughs – and only barely statistically significant differences for the other 4 parameters. Hence, regardless of which of the 3 channels taken by Sacramento River water as it flows into the Cache/Yolo Complex, the isotopic and chemical compositions are generally the same. This finding vastly simplifies the use of isotope and chemical data for mass balance calculations in this area.
Summary and Conclusions
As stated at the beginning of the report, the main objective of the study was to investigate whether stable isotope techniques can:
Identify sources of ammonium (NH4), nitrate (NO3), and organic compounds (especially particulate organic matter (POM) as a proxy for algae) at key locations.
Determine relative biogeochemical reactions rates of NH4 and NO3 at key locations, especially the relative utilization of NH4 and NO3 by algae.
Identify the geographic sources of dissolved and particulate organic matter (especially of algal origin) found at key locations (e.g., major fish nursery areas).
We now can answer several questions:
1) Are nutrients and organic matter downstream of the WWTP isotopically distinguishable from upstream nutrients?
YES. Nitrification of SRWTP effluent causes the residual NH4 and the bulk NO3 to have distinctive isotopic signatures indicative of nitrification. The δ15N values of NH4 and NO3 become progressively more distinctive downstream as more NH4 is nitrified to NO3.
2) Do NH4 and NO3 have sufficiently distinctive isotopic compositions downstream of the WWTP to distinguish the source of nutrients to algal and bacteria?
YES, at many locations. As the δ15N of NH4 and NO3 become more isotopically distinctive downstream, algae that assimilate mostly NH4 have different δ15N values than algae that assimilate mostly NO3.
3) Can we distinguish nutrients and organic matter derived from the Sacramento River from materials derived from the Cache/Yolo Complex sloughs?
YES. T-tests and paired t-tests of chemical and isotopic data from Isleton and all the main sloughs in the Cache/Yolo Complex area show that the waters are statistically significantly different.
Other key findings
Analysis of archived Microcystis samples collected in 2007-2008 from Delta sites for δ15N of NO3 and POM (and other isotopes), combined with a detailed statistical analysis of chemical, isotopic, and hydrological data, conclusively demonstrated that the major source of N assimilated by the Microcystis was NH4 derived from the Sacramento River downstream of SRWTP (Lehman, Kendall et al., 2015).
The fact that we could make the determination of the source of N to Microcystis without actually having any NH4-δ15N data was illuminating! We are currently exploring the extent to which our having δ15N data (or samples archived) for both NH4 and NO3 in all SFE samples collected since 2009 provides an over-determined system. We anticipate being able to use this information to estimate %NH4 uptake for Bay-Delta samples collected 2005-2007 and previously NOT analyzed for NH4-δ15N. This should ultimately let us add the comparison of the relative amounts of NH4 vs NO3 uptake for the last two high-flow falls (2006 and 2011) to our ongoing investigation of factors affecting seasonal and spatial changes in habitat quality related to flow conditions.
Our multi-isotope approach has demonstrated that many different isotope tracers are sensitive indicators of N-cycling mechanisms and sources, often providing unique information beyond what could be determined with just chemical data.
Preliminary mass balance calculations using these isotopic differences between the tributaries and the mainstem Sacramento River at Isleton indicate little support for the Cache/Yolo Complex tributaries being significant sources of nutrients to downstream sites. Instead, this area appears to be a major sink of nutrients, and an important source of algae for local and downstream food webs. Now that we have solid statistical support for nutrients and organic matter from the Cache/Yolo Complex tributaries being usually isotopically distinctive from nutrients and organic matter from the Sacramento River at Isleton, our large datasets can be used for more sophisticated mass balance models evaluating the relations between nutrients in the Sacramento River and algal growth in the Cache/Yolo Complex – and the contributions of this algae to Delta sites.
The two major distributaries of the Sacramento River, Miner and Steamboat Sloughs, that have a combined flow often greater than the mainstem Sacramento River at Isleton, have chemical and isotopic compositions that show no statistically significant differences for almost all of the chemical and isotopic parameters measured (11 out of 15), and only barely statistically significant differences for the other four parameters. This finding vastly simplifies the use of isotope and chemical data for mass balance calculations in this area.
Detailed evaluation of the temporal and spatial changes in nutrient and total chlorophyll concentrations for March 2009 through March 2010 show that downstream changes in NH4 concentrations are not mirrored in the downstream changes in NO3 concentrations – although the trends in nutrient concentrations appear to mirror each other when averaged at each site (per Foe et al., 2010). This suggests that in some locations there is a sink for NH4 besides nitrification, and in others there appear to be additional sources of NO3. The causes of these discrepancies are under investigation.
Data from our detailed transects and continuous data from our USGS collaborators suggest that our efforts to conduct pseudo-Lagrangian transects by sampling carefully on ebb flow (i.e., trying to follow a parcel of water) on our transects were probably insufficient for accurate estimates of biogeochemical rates between successive downstream sites where we had chemical data -- unless we can make corrections using effluent data (or with DSM2-modeled effluent and travel-time data – which we have).
We have found that POM-δ34S is an extremely valuable tracer of organic matter (particulate and dissolved) derived from water sources that have distinctive SO4-δ34S values because of unique S sources and/or biogeochemical processes. In particular, algae growing in many of the Cache/Yolo Complex tributaries have an isotopically distinctive δ34S value that provides a tracer for fish that are growing in these tributaries. Algae growing in the Bay also have a distinctive isotopic signature.
Our realization that much of the site-to-site downstream changes in chemistry and isotopes observed in our transects was probably a function of spatio-temporal variations in effluent concentrations and travel times combined with tidal cycles directly led to the USGS 2013-2014 Lagrangian study; papers are in preparation. Our hope is that we will be able to derive equations for how effluent [NH4] varies with season and flow, that will allow us to better interpret the older transect datasets – and will make it easier to interpret further chemical and isotopic studies piggybacked onto state and federal monitoring programs in tidal rivers.
Acknowledgments
This study would not have taken place without the financial support of the State Water Contractors, the San Luis & Delta-Mendota Water Authority, the State and Federal Contractors Water Agency, and the California Interagency Ecological Program; we are grateful for their support. We would like to thank Dick Dugdale (SFSU) and Alex Parker (formerly SFSU and now CSUM) for letting us piggyback our isotope sample collection onto their March and April 2009 transects, and for providing access to their chemical data prior to publication in Parker et al. (2010, 2012). We also thank Chris Foe (CVRWQCB) for collecting isotope samples for us from his May 2009 through February 2010 transects, for providing access to their chemical data prior to publication in Foe et al. (2010), and for providing a lot of useful advice over the years. We also sincerely thank Randy Dahlgren (UCD) for providing chemical data for the slough project samples collected spring 2010 through December 2012. And last, but not least, we thank Brian Bergamaschi (USGS) for letting us rent his boat and a skipper to collect the slough study samples. Any use of trade, firm, or product names is for descriptive purposes only and does not imply endorsement by the U.S. Government.
References
Andersson, K.K., Philson, S.B., and Hooper, A.B., 1982, 18O isotope shift in 15N NMR analysis of biological N-oxidations: H2O-NO2-exchange in the ammonia-oxidizing bacterium Nitrosomonas: Proceedings of the National Academy of Science of the United States of America, v. 79, p. 5,871-5,875.
Berounsky, V.M., and Nixon, S.W., 1993, Rates of nitrification along an estuarine gradient in Narragansett Bay: Estuaries, v. 16, p. 718-730.
Bowen, G.J., West, J.B., Vaughn, B.H., Dawson, T.E., Ehleringer, J.R., Fogel, M.L., Hobson K., Hoogewerff J., Kendall, C., Lai, C-T., Miller, C.C., Noone, D., Schwarcz, H., and Still, C.J., 2009, Isoscapes to address large-scale earth science challenges: Eos, v. 90, no. 13, p. 109-110.
Casciotti, K.L., Sigman, D.M., Galanter-Hastings, M., Böhlke, J.K. and Hilkert, A., 2002, A bacterial method for the measurement of the oxygen isotope composition of nitrate in marine and fresh waters: Analytical Chemistry, v. 74, p. 4,905-4,912.
Cifuentes, L.A., Fogel, M.L., Pennock, J.R., and Sharp, J.H., 1989, Biogeochemical factors that influence the stable nitrogen isotope ratio of dissolved ammonium in the Delaware estuary: Geochimica et Cosmochimica Acta, v. 53, p. 2,713-2,721.
Cloern, J.E., Canuel, E.A., Harris, D., 2002, Stable carbon and nitrogen isotope composition of aquatic and terrestrial plants of the San Francisco Bay estuarine system: Limnology and Oceanography, v. 47, p. 713-729.
Cloern, J., and Jassby, A., 2012, Drivers of change in estuarine-coastal ecosystems: Discoveries from four decades of study in San Francisco Bay: Reviews of Geophysics, v. 50, no. 4, 33 p.
Dugdale, R.C., Wilkerson, F.P., Hogue, V.E., and Marchi, A., 2007, The role of ammonium and nitrate in spring bloom development in San Francisco Bay: Estuarine, Coastal and Shelf Science, v. 73, p. 17-29.
Finlay, J.C., and Kendall, C., 2007, Stable isotope tracing of temporal and spatial variability in organic matter sources to freshwater ecosystems, Chapter 10, Michener, R.H. and Lajtha, K., eds., Stable Isotopes in Ecology and Environmental Science, 2nd edition: Malden, Massachusetts, USA, Blackwell Publishing, p. 283-333.
Foe, C., Ballard, A., and Fong, S., 2010, Nutrient concentrations and biological effects in the Sacramento-San Joaquin Delta, Final report by the Central Valley Regional Water Quality Control Board Central Valley Region, 90 p.
Fogel, M. L., and Cifuentes, L.A., 1993, Isotope fractionation during primary production, Chapter 3, Engel, M. H., and Macko, S. A., eds., Organic Geochemistry: Principles and Applications: New York, USA, Plenum Press, p. 73-98.
Francis, T.B., Schindler, D.E., Holtgrieve, G.W., Larson, E.R., Scheuerell, M.D., Semmens, B.X., and Ward, E.J., 2011, Habitat structure determines resource use by zooplankton in temperate lakes: Ecology Letters, v. 14, n. 4, p. 364-372.
Fry, B., Silva, S.R., Kendall, C., and Anderson, R.K., 2002, Oxygen isotope corrections for online δ34S analysis: Rapid Communications in Mass Spectrometry, v. 16, p. 854-858.
Glibert, P.M., Dugdale, R.C., Wilkerson, F., Parker, A.E., Alexander, J., Antell, E., Blaser, S., Johnson, A., Lee, J., Murasko, S., and Strong, S., 2014, Major – but rare – spring blooms in 2014 in San Francisco Bay Delta, California, a result of the long-term drought, increased residence time, and altered nutrient loads and forms: Journal of Experimental Marine Biology and Ecology, v. 460, p. 8-18.
Glibert, P.M., Wilkerson, F.P., Dugdale, R.C, Parker, A.E., Alexander J., Blaser, S., and Murasko S., 2014, Phytoplankton communities from San Francisco Bay Delta respond differently to oxidized and reduced nitrogen substrates—even under conditions that would otherwise suggest nitrogen sufficiency: Frontiers in Marine Science, v. 1, doi:10.3389/fmars.2014.00017.
Granger, J., and Sigman, D.M., 2009, Removal of nitrite with sulfamic acid for nitrate N and O isotope analysis with the denitrifier method: Rapid Communications in Mass Spectrometry, v. 23, p. 3,753-3,762.
Hager, S.W., and Schemel, L.E., 1992, Sources of nitrogen and phosphorus to Northern San-Francisco Bay: Estuaries, v. 15, p. 40-52.
Hamilton, S.K., Sippel, S.J., Bunn, S.E., 2005, Separation of algae from detritus for stable isotope or ecological stoichiometry studies using density fractionation in colloidal silica: Limnology and Oceanography: Methods, v. 3, p. 149–157.
Hollocher, T. C., 1984, Source of the oxygen atoms of nitrate in the oxidation of nitrite by Nitrobacter agilis and evidence against a P-O-N anhydride mechanism in oxidative phosphorylation: Archives of Biochemistry and Biophysics, v. 233, n. 2, p. 721-727.
Holmes, R.M., McLelland, J.W., Sigman, D.M., Fry, B., and Peterson, B.J., 1998, Measuring 15N-NH4 in marine, estuarine and fresh waters: An adaption of the ammonia diffusion method for samples with low ammonium concentrations: Marine Chemistry, v. 60, p. 235-243.
Johnson, R.C., Sommer, T., Sturrock, A., Kendall, C., Conrad, L., and Frantzich, J., 2014, You are what you eat: isotope forensic science to track floodplain rearing on the Yolo Bypass. 8th Biennial Bay-Delta Science Conference, October 28-30, Sacramento CA
Kendall, C. and Caldwell, E.A., 1998, Fundamentals of isotope geochemistry, Chapter 2, In: Kendall, C. and J.J. McDonnell (Eds.), Isotope Tracers in Catchment Hydrology, Elsevier, Amsterdam, p. 51-86.
Kendall, C., and McDonnell, J.J., eds, 1998, Isotope Tracers in Catchment Hydrology: Amsterdam, Netherlands, Elsevier, 839 p.
Kendall, C., Silva, S.R., and Kelly, V.J., 2001, Carbon and nitrogen isotopic compositions of particulate organic matter in four large river systems across the United States: NASQAN Special Issue, Hydrological Processes, v. 15, n. 7, p. 1,301-1,346, doi: 10.1002/hyp.216.
Kendall, C., Elliott, E.M., and Wankel, S.D., 2007, Tracing anthropogenic inputs of nitrogen to ecosystems, Chapter 12, Michener, R.H. and Lajtha, K., eds., Stable Isotopes in Ecology and Environmental Science, 2nd edition: Malden, Massachusetts, USA, Blackwell Publishing, p. 375-449.
Kendall, C., Young, M.B., and Silva, S.R., 2010, Applications of stable isotopes for regional to national-scale water quality and environmental monitoring programs, Chapter 5, West, J.B., Bowen, G.J., Dawson, T., and Tu. K.P., eds, Isoscapes: Understanding Movement, Pattern, and Process on Earth through Isotope Mapping: Springer, p. 89-112.
Kratzer, C.R., Dileanis, P.D., Zamora, C., Silva, S.R., Kendall, C., Bergamaschi, B.A., and Dahlgren, R.A., 2003, Sources and transport of nutrients, organic carbon, and chlorophyll-a in the San Joaquin River upstream of Vernalis, California, during summer and fall, 2000 and 2001: U.S. Geological Survey Water-Resources Investigations Report 03-4127, http://water.usgs.gov/pubs/wri/wri034127/.
Kratzer, C.R., Kent, R.H., Saleh, D.K., Knifong, D.L., Dileanis, P.D., and Orlando, J.L., 2011, Trends in nutrient concentrations, loads, and yields in streams in the Sacramento, San Joaquin, and Santa Ana Basins, California, 1975–2004: U.S. Geological Survey Scientific Investigations Report 2010-5228, 112 p., http://pubs.usgs.gov/sir/2010/5228/.
Kraus, T., Bergamaschi, B., Downing, B., Carpenter, K., Parker, A., Kendall, C., Stumpner, E., O'Donnell, K., Travis, N., and Mussen, T., 2014, Too much or too little? Assessing the impact of reduced nutrient loading from wastewater effluent on foodweb dynamics in the Delta. 8th Biennial Bay-Delta Science Conference, October 28-30, Sacramento CA
Lehman, P.W., Kendall, C., Guerin, M.A., Young, M.B., Silva, S.R., Boyer, G.L., and Teh, S.J., 2015, Characterization of the Microcystis bloom and its nitrogen supply in San Francisco Estuary using stable isotopes: Estuaries & Coasts, v. 38, p. 165-178.
Lis, G., Wassenaar, L.I., and Hendry, M.J., 2008, High precision laser spectroscopy D/H and 18O/16O measurements of microliter natural water samples: Analytical Chemistry, v. 80, p. 287-293, doi:10.1021/ac701716q S0003-2700(70)01716-X.
Mariotti, A., Germon, P., Hubert, P., Kaiser, P., Letolle, R.,Tardieux, A., and Tardieux, P., 1981, Experimental determination of nitrogen kinetic isotope fractionation: Some principles, illustrations for denitrification and nitrification: Plant Soil Science, v. 62, p. 413-430.
Parker, A.E., Marchi, A.M., Davidson-Drexel, J., Dugdale, R.C., and Wilkerson, F.P., 2010, Effect of ammonium and wastewater effluent on riverine phytoplankton in the Sacramento River, CA: Final Report to the California State Water Resources Board, 73 p.
Parker, A.E., Dugdale, R.C., and Wilkerson, F.P., 2012, Elevated ammonium concentrations from wastewater discharge depress primary productivity in the Sacramento River and the Northern San Francisco Estuary: Marine Pollution Bulletin, v. 64, p. 574-586.
RMA, 2005, Flooded Islands – Pre-Feasibility Study, Resource Management Associates, Inc. Delta Model Calibration Report. Report to the California Department of Water Resources.
St. Jean, G., 2003, Automated quantitative and isotopic (13C) analysis of dissolved inorganic carbon and dissolved organic carbon in continuous-flow using a total organic carbon analyzer: Rapid Communications in Mass Spectrometry, v. 17, n. 5, p. 419-428.
Schmidt, C.M., Kendall, C., Silva, S.R., Young, M.B., and Parker, A.E., 2013, In situ measurement of ammonium utilization by phytoplankton and bacteria to determine the impacts of nutrient loading on the base of the Delta food web (abs): American Geophysical Union, Fall Meeting, San Francisco, CA., December 9-13, 2013, Abstract h43I-02.
Senn, D. B. and Novick, E., 2014, Suisun Bay Ammonium Synthesis Report. Contribution No. 706. San Francisco Estuary Institute, Richmond, California. 189 p.
Sebilo, M., Billen, G., Mayer, B., Billiou, D., Grably, M., Garnier, J., and Mariotti, A., 2006, Assessing nitrification and denitrification in the Seine River and estuary using chemical and isotopic techniques: Ecosystems, v. 9, p. 564-577.
Sigman, D.M., and Casciotti, K.L., 2001, Nitrogen isotopes in the ocean, Steele, J. H., Turekian, K. K., and Thorpe, S. A., eds., Encyclopedia of Ocean Sciences: New York, Elsevier, p. 1,884-1,894.
Sigman, D.M., Casciotti, K.L., Andreani, M., Barford, C., Galanter, M., Böhlke, J.K., 2001, A bacterial method for the nitrogen isotopic analysis of nitrate in seawater and freshwater: Analytical Chemistry, v. 73, n. 17, p. 4,145-4,153.
Sommer, T., Armor, C., Baxter, R., Breuer, R., Brown, L., Chotkowski, M., Culberson, S., Feyrer, F., Gingras, M., Herbold, B., Kimmerer, W., Mueller-Solger, A., Nobriga, M., Souza, K., 2007, The collapse of pelagic fishes in the upper San Francisco Estuary: Fisheries, v. 32, n. 6, p. 270-277.
Wankel, S.D., Kendall, C., Francis, C.A., and Paytan, A., 2006, Nitrogen sources and cycling in the San Francisco Bay Estuary: A nitrate dual isotope approach: Limnology and Oceanography, v. 51, p. 1654-1664.
Wankel, S.D., Kendall, C., and Paytan, A., 2009, Using nitrate dual isotopic composition (δ15N and δ18O) as a tool for exploring sources and cycling of nitrate in an estuarine system: Elkhorn Slough, CA.: Journal of Geophysical Research, v. 114, G01011, doi:10.1029/2008JG000729.
York, J.K., Tomasky, G., Valiela, I., and Repeta, D.J., 2007, Stable isotopic detection of ammonium and nitrate assimilation by phytoplankton in the Waquoit Bay estuarine system: Limnology and Oceanography, v. 52, n. 1, p. 144-155.
Figures
Figure 1

Fig. 1. The San Francisco Estuary (SFE) drains the two major rivers in California, the higher-flow Sacramento River and the San Joaquin River. These rivers drain the main agricultural basins in the Central Valley, and both have major WWTPs at the upstream ends of the tidal parts of the rivers.
Figure 2

Fig. 2. This map shows the location of sampling sites in the Sacramento River, Delta, northern San Francisco Bay, with different symbols for the different types of sites: mainstem, slough, and distributary.
Figure 3

Fig. 3. This map is an expanded version of Figure 2 that includes the site names for sampling sites on the mainstem Sacramento River; see Table 1 for more information about the sites.
Figure 4
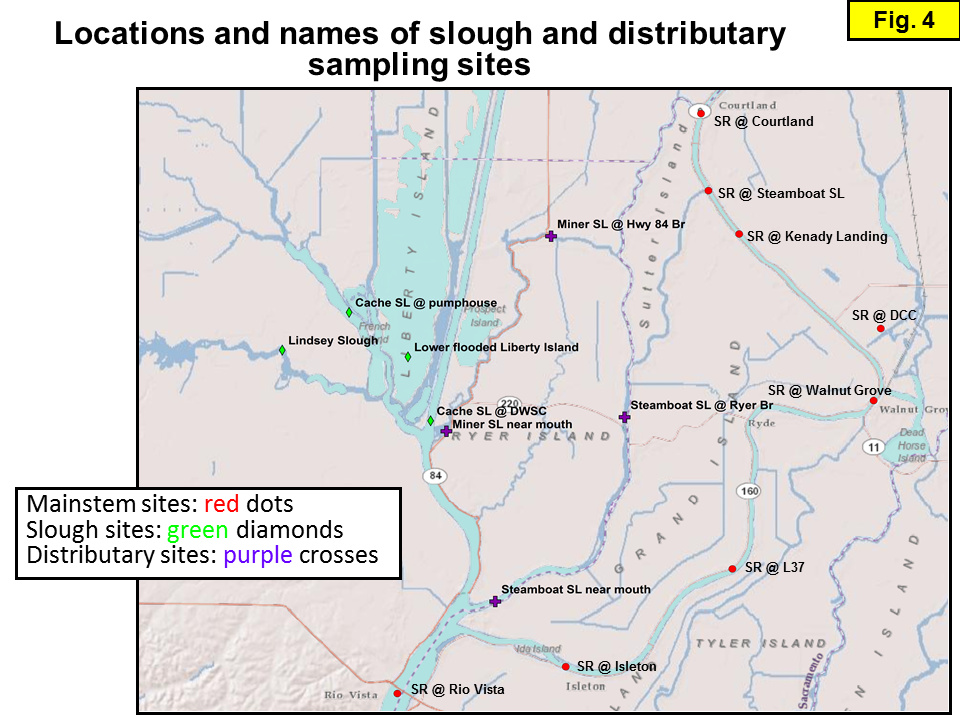
Fig. 4. This map is an expanded version of Figure 2 that includes the site names for sampling sites on sloughs in the Cache/Yolo Complex and distributaries on Miner and Steamboat Sloughs – and at some upper Sacramento River mainstem locations; see Table 1 for more information about the sites.
Figure 5

Fig. 5. This map is an expanded version of Figure 2 that includes the site names for mainstem Sacramento River sampling sites in the Delta and Northern San Francisco Bay; see Table 1 for more information about the sites. (Need to add site names!!)
Figure 6

Fig. 6. This cartoon shows the main sources of N to a typical aquatic ecosystem and the main biogeochemical processes that convert one form of N to another. Note that phytoplankton (as well as cyanobacteria) can derive N from 3 different sources: N fixation, NH4 assimilation, and NO3 assimilation. The main external sources of NH4 are waste water treatment plant effluent, animal manure, and fertilizer. The main external sources of NO3 are fertilizer and nitrification of NH4 from waste water treatment plant effluent, animal manure, and fertilizer.
Figure 7

Fig. 7. This cartoon shows how nitrification and uptake can cause shifts in the δ15N of the resulting NH4, NO3, and algae pools. The sizes of the boxes APPROXIMATE the relative amounts of N in algae and nutrients during NH4 and NO3 uptake, and the relative vertical positions of the boxes APPROXIMATE their relative δ15N values. These boxes are not to scale in that the uptake rate of NH4 is about an order of magnitude higher than that of NO3 (Parker et al., 2012). The main principle is that biogeochemical processes preferentially utilize more of the lower-mass isotopes (e.g., 14N instead of 15N), causing “isotope fractionations” that result in new products to have lower δ15N values than the starting compositions, and residual substrates having higher δ15N values.
Figure 8

Fig. 8. This cartoon illustrates the idealized trends in δ15N for NH4, NO3 and algae during progressive downstream nitrification. Since algae and bacteria will utilize the lower-mass isotopic fraction first, the δ15N of the algae will be lower than the δ15N of the N being assimilated; this cartoon uses a 4‰ fractionation for both NO3 and NH4 assimilation. At upstream sites, the δ15N of algae is 4‰ lower than the δ15N-NO3, which is consistent with algae mainly assimilating NO3. However, downstream of RM25, the δ15N of algae becomes higher than the δ15N-NO3, which means that the NO3 cannot be a significant source of N to algae at these sites. Hence, there is a transition at RM25 from algae assimilating NO3 to algae assimilating NH4, in this case again with a 4‰ fractionation.
Figure 9

Fig. 9. Seasonal variations in the relative contributions of different sources of water to the Sacramento River at Chain Island for the years 2001-2011. The Chain Island site on the Sacramento River is located at the confluence with the San Joaquin River at River Mile = 0 (denoted RM0). These estimates were made using the Delta Simulation Model II (DSM2), a one-dimensional mathematical model for dynamic simulation of one-dimensional hydrodynamics, water quality, and particle tracking in a network of riverine or estuarine channels. Determination of the sources of nutrients to specific locations is complicated by the considerable seasonal variation in the major sources of water to these locations.
Figure 10

Fig. 10. Temporal variations in river stage (water level height, in feet) over 48 hours for 11 sites on the Sacramento River, from Tower Bridge (RM59) to Martinez (RM-17). Most of the locations with stage data are sites where samples were collected (see Table 1). These temporal variations are caused by the semi-diurnal tidal cycle in the ocean, with two high water-levels (of different heights) and two low-water levels (of different heights) each day. The amplitudes of the tidal cycles increase downstream. The tide reverses direction every 8-14 hours, making it difficult to collect all the samples on the ebb tide.
Figure 11

Fig. 11. Downstream variation in the δ15N values of NH4 and NO3, and in stage and net flow for the March 2009 transect are plotted as symbols and lines; the corresponding NH4 and NO3 concentrations (sometimes denoted as [NH4] and [NO3], respectively), are plotted as overlapping color blocks at the bottom of the plots. The net (not instantaneous) flow data are from the DSM2 model. Increases in [NO3] and decreases in [NH4] downstream from this point result from nitrification of effluent-derived NH4. Downstream changes in stage and net (not instantaneous) flow are also shown (net flow data from the DSM2 model). Samples were collected over 4 consecutive tidal cycles, sampling from upstream to downstream. The downstream oscillations in stage and flow reflect changes in tidal cycles during the two days of sampling (March 26th and 27th). The drop in net flow at ~RM38 reflects diversion of ~50% of the flow of the Sacramento River to Miner and Steamboat Sloughs.
Figure 12

Fig. 12. Downstream variation in the δ15N values of NH4 and NO3, and in stage and net flow for the April 2009 transect are plotted as symbols and lines; the corresponding NH4 and NO3 concentrations (sometimes denoted as [NH4] and [NO3], respectively), are plotted as overlapping color blocks at the bottom of the plots. The net (not instantaneous) flow data are from the DSM2 model. The Sacramento Regional Water Treatment Plant (SRWTP) releases treated wastewater effluent to the river at ~RM46. Increases in [NO3] and decreases in [NH4] downstream from this point result from nitrification of effluent-derived NH4. Downstream changes in stage and net (not instantaneous) flow are also shown (net flow data from the DSM2 model). Samples were collected over 4 consecutive tidal cycles, sampling from upstream to downstream. The downstream oscillations in stage and flow reflect changes in tidal cycles during the two days of sampling (April 23rd and 24th). The drop in net flow at ~RM38 reflects diversion of ~50% of the flow of the Sacramento River to Miner and Steamboat Sloughs.
Figure 13
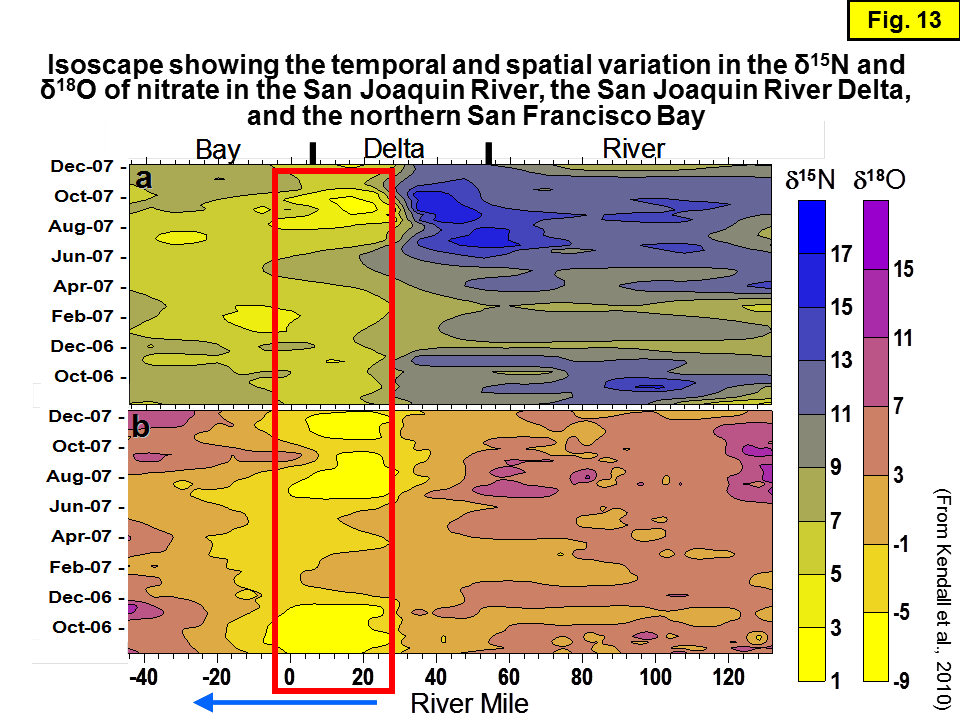
Fig. 13. Spatial and temporal distribution of nitrate-δ15N values (a) and nitrate-δ18O values (b) along 170 miles of river, extending from the headwaters of the San Joaquin River, through areas receiving Central Valley agricultural return waters through the Sacramento-San Joaquin Delta, and across the northern San Francisco Bay to where the estuary drains into the Pacific Ocean (see map, Figure 14). River miles are measured from where the San Joaquin River converges with the larger Sacramento River (RM0), with positive values representing upstream locations and negative values representing downstream locations. This plot reflects data from ~1200 samples collected August 2006-December 2007. The red-bordered box extending from ~RM-4 to RM28 encloses a section of the transect with δ15N and δ18O values of nitrate that are significantly lower than locations upstream and downstream of this section. Figure modified from Kendall et al. (2010).
Figure 14

Fig. 14. This map shows the locations of sites sampled as part of several studies 2005-2007. Only isotope data from the mainstem (main channel) sites were used to prepare Figure 13 (Kendall et al., 2010). The mainstem samples include sites on the main channel of the San Joaquin River (RM109 to RM56; note different symbols for different San Joaquin River site types), on the main channel of the upper (deltaic) San Joaquin River (RM41 to RM24), and then on the main channel of the lower (deltaic) Sacramento River (RM12 to RM-45). The San Joaquin River converges with the Sacramento River at RM0.
Figure 15

Fig. 15. Downstream variation in the δ15N values and concentrations of NH4 and NO3 for the March 2009 transect of the Sacramento River. The schematic at the top illustrates the relationships among the parameters: as a fraction of the NH4 pool (a fraction with lower δ15N) undergoes nitrification, the newly formed NO3 has a lower δ15N than the original NH4, causing the δ15N of the remaining pool of NH4 to increase. This downstream increase in the δ15N-NH4 is gradual while NH4 concentrations are high, and then increased rapidly as NH4 concentrations drop downstream. The spatial variations of these data, especially the δ15N-NH4 values, clearly show the effect of gradual nitrification of NH4 to NO3. All data for the Delta Cross Channel (DCC) site at RM27 are omitted. SRWTP: indicates where treated effluent from the Sacramento Regional Wastewater Treatment Plant enters the River.
Figure 16

Fig. 16. Downstream variation in the δ15N values and concentrations of NH4 and NO3 for the April 2009 transect of the Sacramento River. The schematic at the top illustrates the relationships among the parameters: as a fraction of the NH4 pool (a fraction with lower δ15N) undergoes nitrification, the newly formed NO3 has a lower δ15N than the original NH4, causing the δ15N of the remaining pool of NH4 to increase. This downstream increase in the δ15N-NH4 is gradual while NH4 concentrations are high, and then increased rapidly as NH4 concentrations drop downstream. The spatial variations of these data, especially the δ15N-NH4 values, clearly show the effect of gradual nitrification of NH4 to NO3. All data for the Delta Cross Channel (DCC) site at RM27 are omitted. SRWTP: indicates where treated effluent from the Sacramento Regional Wastewater Treatment Plant enters the River.
Figure 17

Fig. 17. Downstream variation in the δ15N values of NO3, NH4, and POM; the δ18O of NO3 and H2O; and chlorophyll-a concentration for March 2009 transect of the Sacramento River. The isotope and chlorophyll data for the Delta Cross Channel (DCC) site at RM27 are omitted.
Figure 18
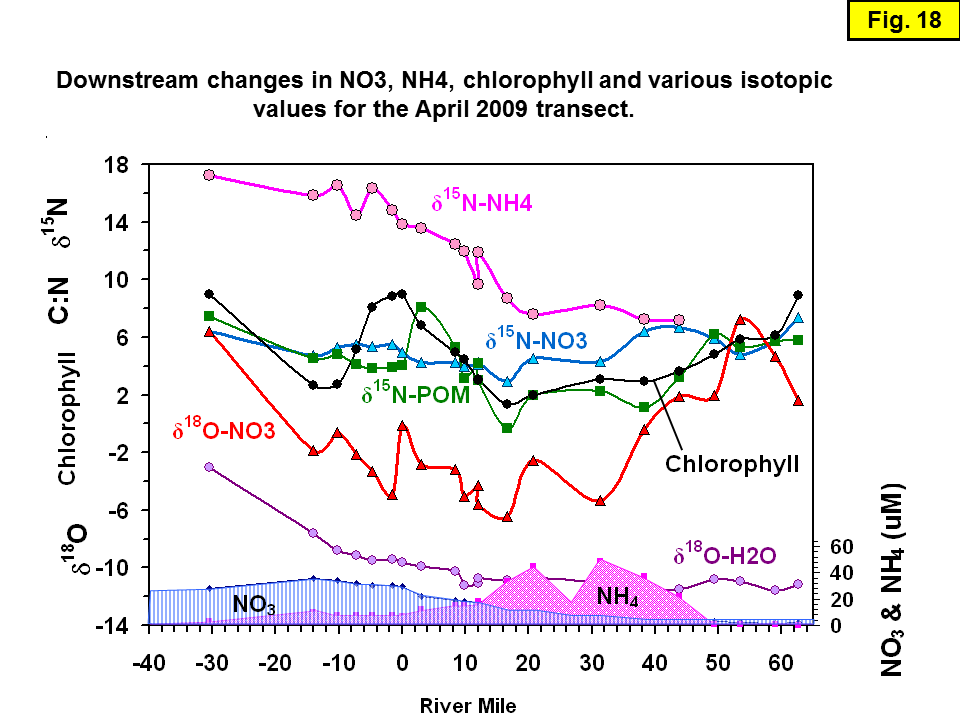
Fig. 18. Downstream variation in the δ15N values of NO3, NH4, and POM; the δ18O of NO3 and H2O; and chlorophyll-a concentration for the April 2009 transect of the Sacramento River. The isotope and chlorophyll data for the Delta Cross Channel (DCC) site at RM27 are omitted. Note the algal bloom at the confluence of the SJR (RM0), shown by the increase in chlorophyll. The “spike” in the δ15N of the POM upstream of RM0 may reflect tidal sloshing of algae derived from the confluence area. The progressive increase in the δ18O of H2O downstream of RM12 and especially downstream of RM-10 reflects mixing with marine water of ~ δ18O-H2O = 0.
Figure 19

Fig. 19. The downstream changes in NH4 and NO3 concentration for samples collected during the April 2009 transect of the Sacramento River from RM44 to the Bay (site US13) are plotted relative to δ15N of NH4 to show the effects of nitrification (conversion of NH4 to NO3) on nutrient concentrations and NH4-δ15N. No data are presented for sites upstream of RM44 because the NH4 concentrations were too low above the entry point of wastewater effluent for analysis of δ15N-NH4; data from the DCC site were omitted. The NO3 and NH4 lines are approximately mirror images of each other for the section of the transect with for NH4-δ15N values ranging from about +8 to +16‰, consistent with nitrification being the dominant biogeochemical process acting on these two pools of N in this section of the river. The oscillations in NH4 and NO3 concentration between the RM44 site and Isleton are likely due to variability in wastewater effluent input, as well as tidal reversals which affect the amount of NH4 that has been converted to NO3 via nitrification (O’Donnell 2014). The reversal between the US5 (Middle Ground, RM-7) and the US13 (North of Pinole Point, RM-30) reflects a local source of NH4 (Figure 18). However, this section of the transect also shows the downstream transition from the tidally dominated river channel to the more open Bay, where mixing with marine water becomes the dominant process affecting water chemistry and isotopes. This transition to a mixing zone is best illustrated by the dramatic changes in water-δ18O values downstream of about RM-10 (Figure 18).
Figure 20

Fig. 20. The downstream changes in NO3-δ15N and NO3-δ18O for samples collected during the April 2009 transect of the Sacramento River from the I-80 Bridge (RM63)to the Bay (site US13, RM-31) are plotted relative to NO3 concentrations. The matching trends of the two lines show that the δ15N and δ18O values are closely “coupled”, which is consistent with nitrification being the dominant process affecting NO3 isotopic compositions in the Sacramento River downstream of the WWTP (Figure 18); however, mixing of riverine and Bay (marine) sources of nitrate downstream of about RM-10 (Figure 18) could also account for the trends in this section of the transect. The “out of phase” trends upstream of RM44 reflect the upstream origin of the NO3 upstream of SRWTP.
Figure 21

Fig. 21. Comparison of δ15N values of NO3 (pink/violet) and NH4 (blue/aqua) plotted against River Mile for samples collected at mainstem and slough locations of the Sacramento River for all transects. Symbol shape identifies mainstem versus slough locations. The entry points of SRWTP effluent and water from the Cache/Yolo Complex sloughs are shown with red arrows. All the slough samples are plotted at RM14.1 because the various sloughs sampled all drain into Cache Slough and this RM value is where Cache Slough converges with the mainstem Sacramento River. The data show the overall downstream trend of increasing NH4-δ15N as an isotopically light fraction of the ammonium pool is preferentially converted to nitrate (nitrification).
Figure 22

Fig. 22. Comparison of the δ15N values of NO3 and NH4 for all sites sampled on all Sacramento River transects. Different symbol shapes and colors indicate sample types (e.g., distributary and slough sites) and section of the river for mainstem sites.
Figure 23

Fig. 23. This plot shows a revised version of the original Kendall (1998) plot that summarized the dominant compositional ranges of all available δ15N and δ18O data for nitrate; the compositional boxes have been adjusted for additional data. The black arrow shows a typical slope for a groundwater denitrification line, with a slope of 2:1. Slopes as low as 1:1 are not uncommon in lab studies (and some field studies). The ranges in the δ18O values reflect the ranges in the ambient δ18O of water and O2 gas during nitrification (Kendall et al., 2007).
Figure 24

Fig. 24. Nitrate δ15N and δ18O values for all sites and dates are plotted on a dual isotope plot (Kendall et al., 2007). Samples from different types and locations of sites are denoted by different symbol colors and shapes. The expected trend for uptake (and denitrification) is shown as a thin black arrow. Despite all the N-cycling in the ecosystem, the isotopic compositions of NO3 have not changed very much from what would be considered “typical” NO3 derived from a mixture of soil, agricultural, and septic waste sources. See Figure 25 for details.
Figure 25

Fig. 25. This plot expands the scale of the previous plot (Figure 24) to show that samples collected upstream of the WWTP tend to have slightly higher NO3-δ18O values compared to other sites; the average δ18O-NO3 values from mainstem sites are +2.0‰ (n=26) upstream of the WWTP, -1.0‰ (n=79), +2.0 (n=26) from RM44 to Isleton, and -2.9‰ (n=70) from Rio Vista downstream. Also, there is some indication that uptake may be causing δ15N and δ18O values from some “RM44 to Isleton” and “Slough” samples to increase along the theoretical “uptake line” indicated by the black arrow. However, this very slight trend might also be explained by temporal and spatial variation in the original nitrate sources to different sites, later augmented by the effects of mixing with newly formed nitrate. For example, different sources of nitrate at slough versus mainstem sites is supported by the differences in the average δ18O and δ15N values (respectively) of samples from sites upstream of the WWTP and slough sites: +2.0‰ and +6.7‰ for upstream samples (n=26), versus -1.9‰ and +6.4‰ for slough samples (n=83).
Figure 26

Fig. 26. Comparison of the downstream average changes in NH4 and NO3 concentrations for all the Sacramento River and Delta samples collected as part of the Foe study in 2009-2010 (see text for details). Note that the x axis in this plot is reversed relative to the other plots in this report in that flow goes from left to right as indicated by the blue arrow, and downstream sites here are to the right. The figure is modified from Foe et al (2010).
Figure 27

Fig. 27. The downstream change (Δ) in NH4 concentrations between adjacent mainstem Sacramento River and Delta sites, divided by the change (Δ) in NO3+NO2 concentrations between adjacent sites are plotted relative to river mile for all sites and dates where concentration data are available; the values are plotted at the downstream end of each reach. Note that the Δ/Δ color bar scale is not linear, with the scale expanded to better show values closer to 0. For comparison, the flow at Freeport is also shown; the black and red lines indicate the locations where SRWTP effluent and Cache/Yolo Complex water, respectively, enter the Sacramento River. The plots were made using Surfer. The largest discrepancy ratios (positive and negative), which represent a disconnect between a change in these two pools of N (NH4 vs. NO3+NO2), are for adjacent sites downstream of SRWTP (RM46) and upstream of Isleton (RM17). The main conclusion is that downstream changes in NH4 concentrations between adjacent sites are NOT mirrored by downstream changes in NO3+NO2 concentrations between the same adjacent sites – when the data are examined in detail.
Figure 28

Fig. 28. NH4 concentrations are plotted relative to river mile for all sites and dates where concentration data are available. For comparison, the flow at Freeport is also shown. SRWTP effluent is discharged at about RM46 whereas the maximum NH4 concentrations are seen at RM32 to RM38. This gradual increase in [NH4] suggests slow downstream mixing of the effluent plume and/or degradation of effluent to form NH4. The [NH4] start declining rapidly downstream of RM17 (Isleton).
Figure 29
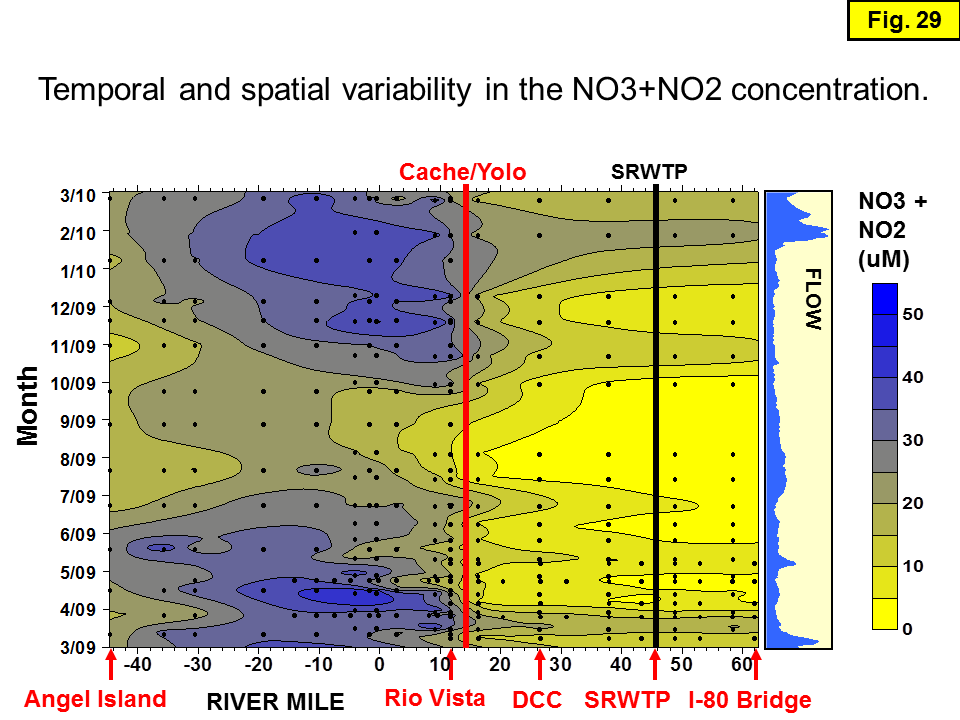
Fig. 29. The sum of NO3 and NO2 concentrations are plotted relative to river mile for all sites and dates where concentration data are available. For comparison, the flow at Freeport is also shown. NO3+NO2 concentrations increase sharply downstream of Isleton (RM17) where NH4 concentrations also begin to drop (Figure 28).
Figure 30

Fig. 30. DON concentrations are plotted relative to river mile for all sites and dates where concentration data are available. For comparison, the flow at Freeport is also shown. DON concentrations downstream of SRWTP are high during three time periods, two associated with high flows. In general, the C:N of the DOM during the periods when [DON] is high ranges from 5-20, values that are lower than normal. The DON data are all from Foe et al (2010).
Figure 31

Fig. 31. Total chlorophyll concentrations are plotted relative to river mile for all sites and dates where concentration data are available. For comparison, the flow at Freeport is also shown. The high concentrations observed at downstream sites in May 2009 and September 2009, and to a lesser extent in December 2009, suggest that the growth of algae at these sites and dates may be influenced by the marine-derived waters.
Figure 32

Fig. 32. The ratios of chlorophyll-a to total chlorophyll concentrations (total chlorophyll = chlorophyll-a + pheophyton) are plotted relative to river mile for all sites and dates where concentration data are available. For comparison, the flow at Freeport is also shown. A higher ratio suggests a higher fraction of fresh (dominated by chlorophyll-a) algae. Note that the high ratio values observed at downstream sites in May 2009 and September 2009 correspond to the high total chlorophyll concentrations observed at these sites in Figure 31.
Figure 33

Fig. 33. The general downstream decreases in [DOC] and δ15N-NO3 -- and increases in DOC-δ13C, observed downstream to about RM20 for the March 2009 Sacramento River transect may be a consequence of bacterial uptake of DOC and NH4 associated with nitrification that takes place downstream of the WWTP. After uptake of the more bioavailable DOC by bacteria, the residual DOC in the river is probably much less labile, with adverse consequences for bacteria-based food webs downstream of RM25. The inversion points for DOC concentration and DOC-δ13C, and “dip” in δ15N-NO3, occur at about the location (~RM20) where the tide reversed during sampling (see Figure 11 and discussion in the report). The abrupt changes at Rio Vista probably also reflect the effect of another tidal reversal during sampling (see Figure 11), perhaps resulting in poorly mixed influxes of water with a different composition from the Cache/Yolo Complex sloughs.
Figure 34
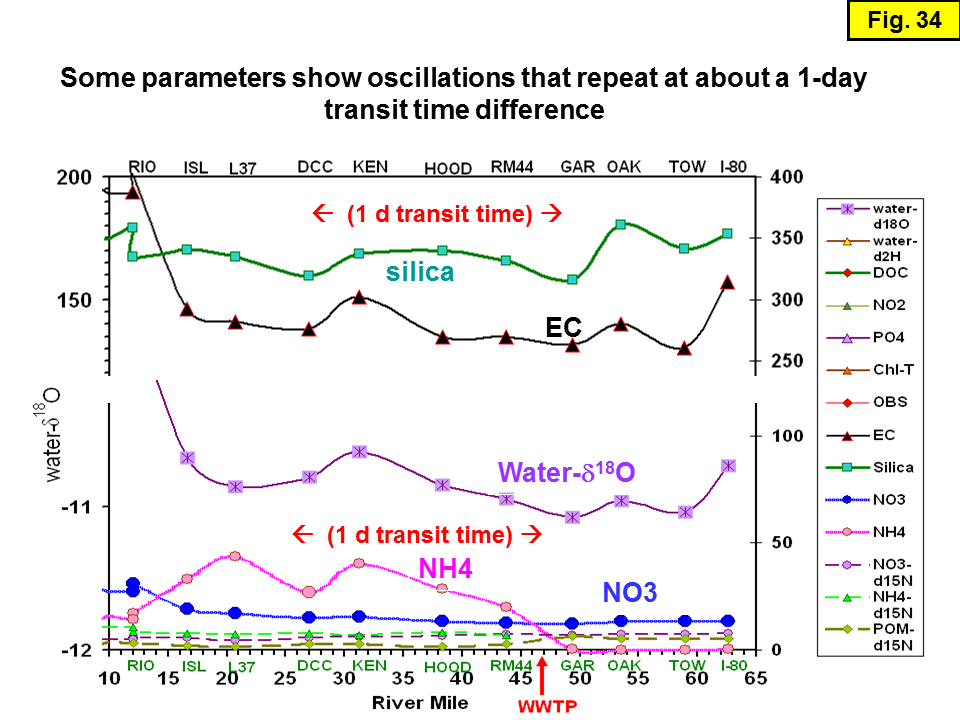
Fig. 34. Conservative tracers of water sources like EC (electrical conductivity), δ18O-water, and silica for March 2009 samples show similar downstream oscillations in composition, suggesting temporal differences in the effluent loads (i.e., variable dilution with upstream water). With the exception of the dip in [NH4] at DCC (RM27), which is about 1-day transit time from SRWTP, the other non-conservative parameters do not appear to show significant oscillations. Hence, a likely explanation for the frequently observed dip in [NH4] at the DCC site is that it is a sampling artifact, caused by sampling a parcel of water at DCC with a relatively low % effluent. On most transects, sampling starts near the SRWTP at close to high tide when the effluent is most diluted, and since under many flow conditions water at the DCC site has traveled ~1day since passing the SRWTP, the water at this site represents the dilute “high tide” parcel from the previous day. The [NO3] downstream of SRWTP is minimally affected by changes in % effluent because the load of NO3 from SRWTP is normally much smaller than the load from upstream of SRWTP. Also, nitrification, the main process affecting [NO3] in the Sacramento River is not limited by substrate (NH4) concentration.
Figure 35

Fig. 35. Many parameters measured for March 2009 samples do NOT oscillate in composition -- but instead show gradational downstream changes in composition indicative of processes (such as nitrification) relatively unaffected by changes in effluent loads, except for locations that receive significant amounts of new water and constituents from the Cache/Yolo Complex tributaries like RM12 (Rio Vista). The downstream inverse trends in [DOC] and DOC-δ13C suggest degradation of organic matter.
Figure 36

Fig. 36. The typical values and ranges in the δ13C, δ15N, and δ34S of the major organic matter sources to aquatic ecosystems are shown without parentheses; the ranges of observed values are in parentheses. The data are from Table 10.2 in Finlay and Kendall (2007).
Figure 37

Fig. 37. POM-δ13C for samples from different sections of the transects and site types are plotted relative to RM. The data for the Cache/Yolo Complex tributaries (sloughs) and the Miner and Steamboat Slough distributaries are plotted at RM14 because that is where the Cache Slough converges with the Sacramento River. Many of the slough samples have much lower δ13C values than samples from upstream or downstream of where the Cache/Yolo Slough converges with the Sacramento River, probably indicating more drawdown of the DIC pool in the semi-restricted Cache/Yolo Complex tributaries due to more intense photosynthesis and algal growth in this section of the Delta than in other sections.
Figure 38
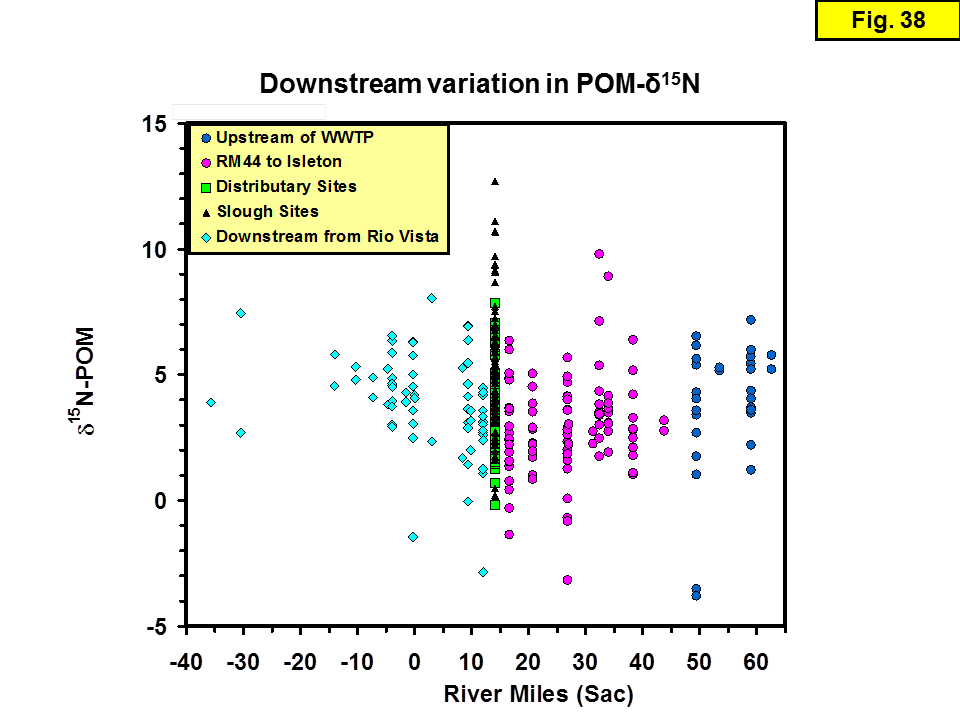
Fig. 38. POM-δ15N for samples from different sections of the transects and site types are plotted relative to RM. The data for the Cache/Yolo Complex tributaries (sloughs) and the Miner and Steamboat Slough distributaries are plotted at RM14 because that is where the Cache Slough converges with the Sacramento River. Many of the Slough samples have much higher δ15N values than samples from upstream or downstream of where the Cache/Yolo Slough converges with the Sacramento River, probably indicating more uptake of NH4 (and more drawdown of the NH4 pool) and hence more fractionation of the resulting NH4 in the semi-restricted Cache/Yolo Complex sloughs due to more intense photosynthesis and algal growth in this section of the Delta than in other sections.
Figure 39

Fig. 39. POM-C:N for samples from different sections of the transects and site types are plotted relative to RM. The data for the Cache/Yolo Complex tributaries (sloughs) and the Miner and Steamboat Slough distributaries are plotted at RM14 because that is where the Cache/Yolo Slough converges with the Sacramento River. Many of the Slough samples have much lower C:N than samples from upstream or downstream of where the Cache/Yolo Slough converges with the Sacramento River, indicating that the POM contains a higher proportion of algae and bacteria than the other samples.
Figure 40

Fig. 40. POM-δ13C for samples collected from different sections of the transects and site types are plotted relative to POM-C:N. Box boundaries for different POM sources (plankton, aquatic plants, soil and leaves) are based on data from Cloern et al. 2002), Finlay and Kendall (2007), and unpublished USGS data from the San Francisco Estuary (SFE). Despite appearances, the average C:N of slough POM samples is 7.9 ± 1.2, only slightly lower than the average C:N of POM from RM44 to Isleton, which is 8.6 ± 0.9. The Lindsey and Toe Drain slough sites have only slightly lower C:N values than the other sloughs (7.6 vs. 8.3), so site location does not explain the group of slough sites with C:N values of 5-7 on the plot. But examination of the data in the downloadable Excel file shows that most of the low C:N values are for samples collected May through September during the dry season when there are few storms events which carry terrestrial runoff into the river.
Figure 41

Fig. 41. POM-δ15N for samples collected from different sections of the transects and site types are plotted relative to POM-δ13C. Box boundaries for different POM sources (plankton, aquatic plants, soil and leaves) are based on data from Cloern et al. (2002), Finlay and Kendall (2007), and unpublished USGS data from the SFE. The average POM-δ15N for slough samples is +5.2 ± 2.4‰, which is considerably higher than the average POM-δ15N from RM44 to Isleton, which is +2.9 ±2.2‰. The average POM-δ13C for slough samples is -29.5 ±1.7‰, which is considerably lower than the average POM-δ13C from RM44 to Isleton, which is -27.3 ±1.0‰.
Figure 42

Fig. 42. POM-δ13C for samples collected from different sections of the transects and site types are plotted relative to POM-δ34S. Box boundaries for different POM sources (plankton, aquatic plants, soil and leaves) are based on data from Cloern et al. (2002), Finlay and Kendall (2007), and unpublished USGS data from the SFE. Samples from the Cache/Yolo Complex tributaries and sloughs are grouped under “Slough sites” on this plot. The average POM-δ34S of slough samples is +1.3 ±7.1‰, which is not significantly different from the average POM-δ34S from RM44 to Isleton, which is +2.4 ±4.9‰. The high POM-δ34S for sites upstream of Rio Vista are suspicious and merit investigation.
Figure 43

Fig. 43. The March 2009 δ15N values for NH4, NO3, and POM (solid lines) are compared with calculated δ15N values for algae assuming a 4‰ fractionation (dashed lines) for both NH4 uptake (denoted “algae using NH4”) and NO3 uptake (denoted “algae using NO3”). Data for the DCC site (RM27) are omitted due to anomalously low NH4 concentrations. The actual POM data plot between calculated values for algae data for NO3 and NH4 assimilation. In general, between the SRWTP and RM15, the actual POM data are a better match to the calculated algae data for NO3 assimilation downstream, and the calculated algae data for NH4 assimilation are generally a better fit downstream of RM15.
Figure 44

Fig. 44. The April 2009 δ15N values for NH4, NO3, and POM (solid lines) are compared with calculated δ15N values for algae assuming a 4‰ fractionation (dashed lines) for both NH4 uptake (denoted “algae using NH4”) and NO3 uptake (denoted “algae using NO3”). Data for the DCC site (RM27) are omitted due to anomalously low NH4 concentrations. Data from April 2009 are more complex than for March 2009. The abrupt trend upward in δ15N-POM at the same location (RM17) as the upward trend in δ15N-NH4 is evidence of increasing proportion of NH4 assimilation downstream of this location, and the sharp drop to lower values (RM0) is probably reflecting a switch back to dominant NO3 use downstream of this location.
Figure 45
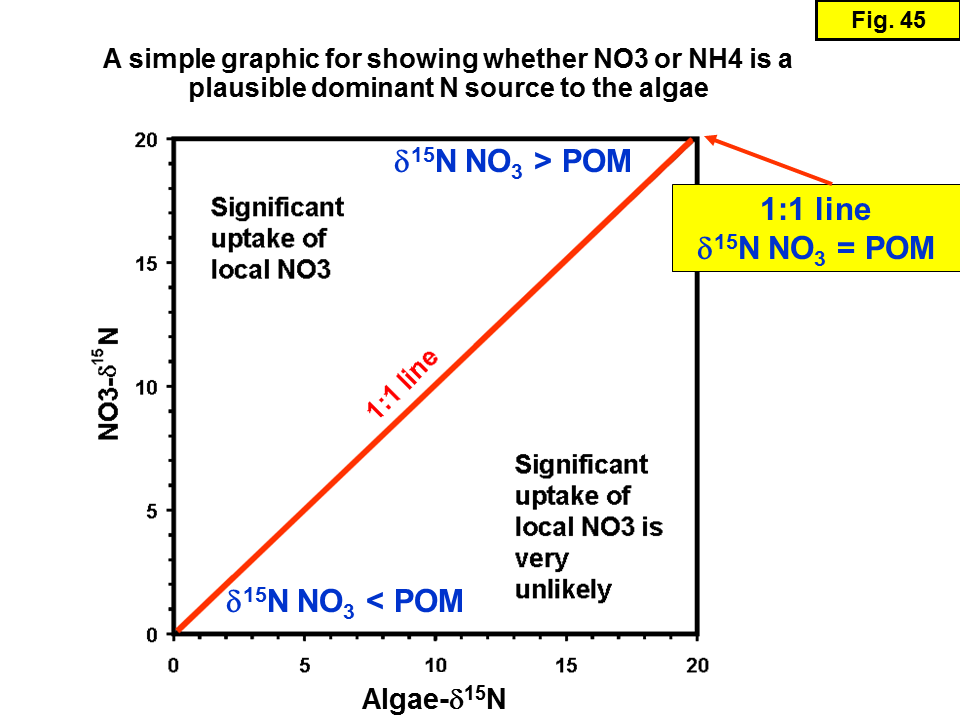
Fig. 45. This plot provides a useful graphical means for showing whether the δ15N data for algae (i.e., only data for POM samples with C:N ≤ 9.0) are consistent or not consistent with NO3 as dominant N source. The red 1:1 line denotes when the δ15N values of algae and NO3 are the same. Because of isotope fractionation, algae assimilating NO3 should plot above line for samples, and algae that were not assimilating NO3 (and thus were presumably assimilating NH4) would plot below the line. If the algae consumed all the NO3, there would be no isotope fractionation and the algae would plot on the line.
Figure 46

Fig. 46. The δ15N values of NO3 and NH4 for March and April 2009 of algae-dominated POM samples (C:N ≤ 9) collected along the Sacramento River transects are plotted relative to δ15N-POM (see Figure 45 for plot explanation). Note that the axis labels and symbols are color coded (NH4: pink; NO3: blue). The dashed line above the 1:1 line represents the theoretical position of data if all the N in algae was derived entirely from ambient NO3, with a typical 4‰ isotope fractionation. Since all the δ15N-NH4 values (pink) plot well above the 1:1 line, NH4 is a plausible dominant source of N to algae. Since almost all of the NO3-δ15N values (blue) plot either below the 1:1 line or < 4‰ above the line, NO3 is not a plausible dominant source of N to algae. The pink arrow shows the linear trend of increasing δ15N-POM and values with decreasing NH4 concentration (see Figure 17 and Figure 18).
Figure 47

Fig. 47. This plot shows all the δ15N data for samples collected during the 2009-2010 transects that have algae-dominated POM with C:N ≤ 9. Note that the axis labels and symbols are color coded (NH4: pink; NO3: blue). Sample shape denotes samples from just the two “Dugdale transects” (denoted “2009”), and ones from the “Foe transects” (denoted “2009-2010”). Like the previous plot, for most samples, NH4 is the most plausible dominant source of N to algae. However, for samples where both the NH4-δ15N and the NO3-δ15N values plot above the 4‰ fractionation line (thin black line), contributions of NH4 and NO3 to algal uptake may be sub-equal (assuming that a 4‰ fractionation is a reasonable assumption for both NH4 and NO3, which is still unresolved).
Figure 48

Fig. 48. This plot shows an example of preliminary calculations of the %NH4 uptake by algae along the Sacramento River between RM38 (Hood) and RM-5 (US 649), for data from the August 2009 Foe transect. The calculations assumed a NO3 fractionation factor of 4, and three different NH4 fractionation factors (ε = 3, 4, 5). Calculations for sites downstream of RM-3 did not give good model fits, for reasons still being investigated. This plot shows that the % of NH4 (as opposed to NO3) assimilated decreases from ~60% at RM38 to ~30% at RM12 (Rio Vista), and then slightly increases where the San Joaquin River converges with the Sacramento River (RM0).
Figure 49
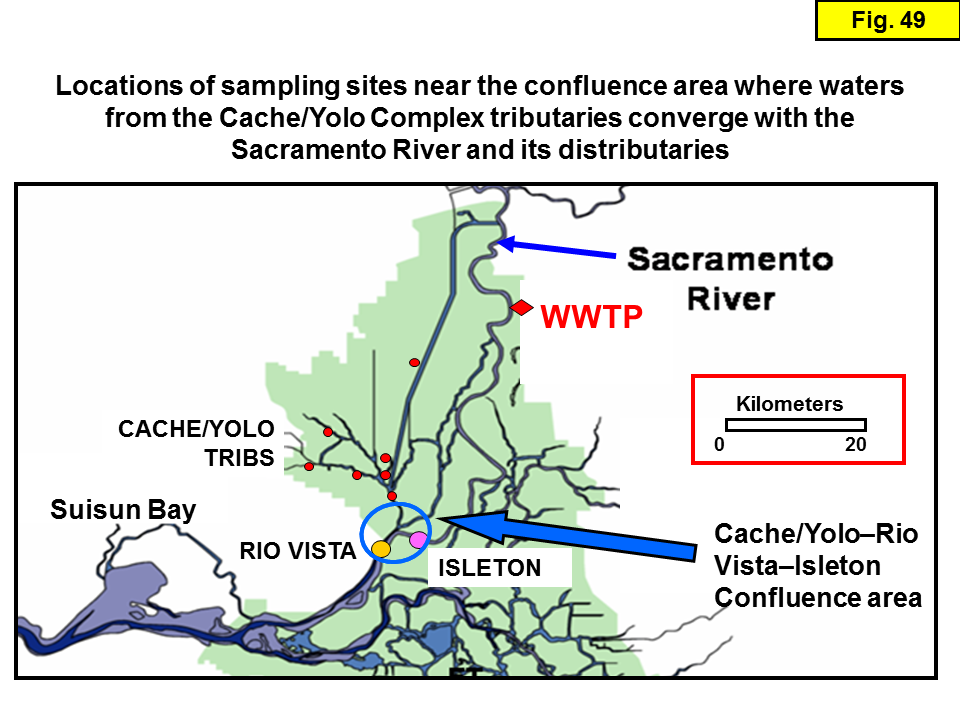
Fig. 49. Locations of the sites used for the evaluation of whether mainstem Sacramento River water (as collected at Isleton, RM17) is chemically and isotopically distinctive from waters from the Cache/Yolo Complex tributaries (sloughs). If the waters are distinctive, then the data can be used to estimate the relative proportions of water, nutrients, and organics derived from the Sacramento River at Isleton and water, nutrients, and organics derived from the tributaries to Rio Vista (RM12).
Figure 50

Fig. 50. POM-δ34S data for samples collected in April 2009 show that 4 sections of the transect have distinctive of δ34S values, as noted by arrows on the plot. Effluent from the WWTP imparts a distinctive δ34S value to algae growing downstream of SRWTP. The lower δ34S value for POM from the Cache/Yolo tributaries probably reflects the effect of sulfur reducing reactions in upstream wetlands, and the high δ34S values in the Bay show the influence of marine-derived sulfate (with a δ34S of +21‰) on algae growing in the Bay. POM shows a HUGE drop near RM12, presumably due to organics from the Cache/Yolo Complex tributaries (which have very low δ34S values, probably because of sulfate reduction in the wetlands). Also, effluent from the WWTP has a distinctive value compared to upstream δ34S values. SO4-δ34S may be a useful tracer in this region too.
Figure 51

Fig. 51. Locations of the sites used for the evaluation of whether mainstem Sacramento River water (as collected at Isleton, RM17) is chemically and isotopically distinctive from waters from Miner Slough and Steamboat Slough, both distributaries of the Sacramento River. The water in these distributaries is mainly derived from the Sacramento River at Courtland, but some other agricultural drainages may be seasonally important. The combined flow from Miner and Steamboat Sloughs is about the same flow as at Isleton, and they contribute roughly half the flow to Rio Vista (see Figure 52).
Figure 52
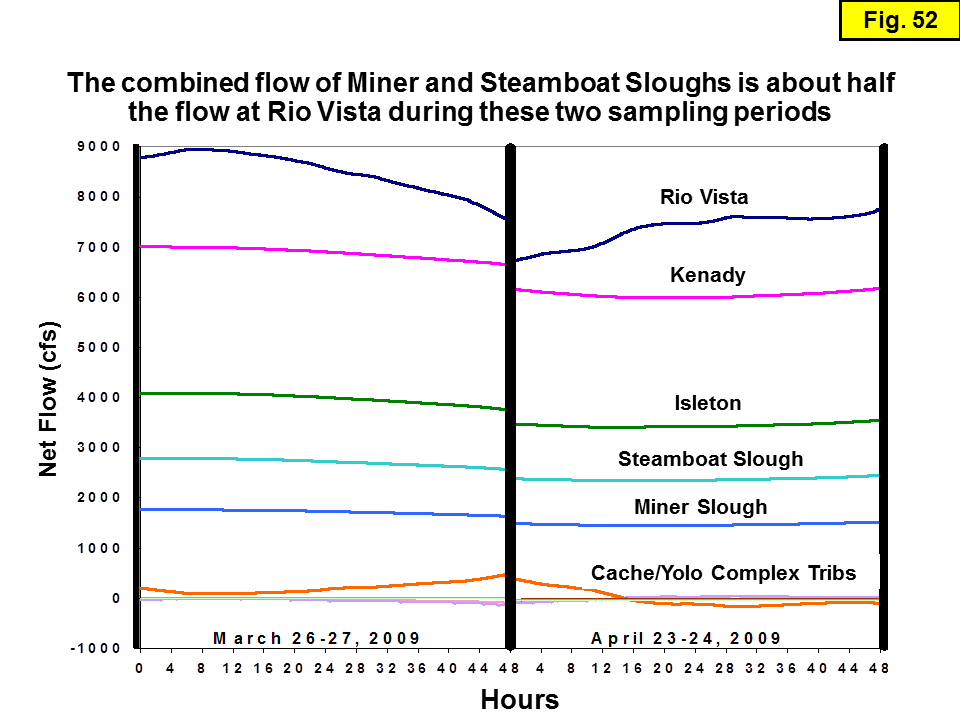
Fig. 52. This plot shows the net flow values for important sites on the mainstem Sacramento River and its two main distributaries (Miner and Streamboat Slough), from Kenady (RM31) downstream to Rio Vista (RM12) during the days in March and April 2009 when isotope and chemistry samples were collected. Note that the sum of the flows for Miner Slough and Steamboat Slough is greater than the mainstem flow of the Sacramento River at Isleton, and that the flows in these two sloughs are MUCH higher than the rather trivial flows from the locations where we collected chemistry and isotope samples in the Cache/Yolo Complex tributaries.
Figure 53

Fig. 53. This plot shows how the volumetric % of water from different sources (calculated from the DSM2 model) for the April 2009 transect (April 23-24, 2009) change downstream for sites along the Sacramento River transect, from RM63 (the I-80 bridge across the Sacramento River) downstream to RM-17 at Martinez (which is as far as the DSM2 model extends). By definition, at the I-80 Bridge, 100% of the water is Sacramento River water, and at Martinez, 100% of the water is derived from downstream sources (i.e., the Bay).
Figure 54

Fig. 54. For this plot, the net flow values for Miner and Steamboat Sloughs for April 2009 (data for April 23-24, 2009) from the DSM2 model were used to estimate the downstream changes in the proportion of the Sacramento River water for our sampling sites that is actually diverted through these sloughs (which are actually distributaries. This plot (compared to the previous one) makes it clear that the diverted water is important volumetrically. The diverted water rejoins the mainstem at about RM14 when the Cache/Yolo Complex tributaries converge with the Sacramento River upstream of Rio Vista.
Tables
Table 1
Sampling site information.
| Project Name | Site # | Sampling Location | RM (SR) | RM upstrm. from RM=0 | RM downstrm. from SRWTP |
site type | Latitude | Longitude |
|---|---|---|---|---|---|---|---|---|
| Dugdale | I80 | SR @ I-80 Bridge | 62.6 | -16.6 | mainstem | 38.600 | -121.553 | |
| Foe, Dugdale | Site 1, TOW | SR @ Tower Bridge | 59.0 | -13.0 | mainstem | 38.580 | -121.508 | |
| Dugdale | OAK | SR @ Oak Hall Bend | 53.5 | -7.5 | mainstem | 38.518 | -121.529 | |
| Foe, Dugdale | Site 2, GRC | SR @ Garcia Bend | 49.4 | -3.4 | mainstem | 38.478 | -121.544 | |
| Dugdale | RM44 | SR @ River Mile 44 | 43.8 | 2.3 | mainstem | 38.435 | -121.524 | |
| Foe, Dugdale | Site 3, HOD | SR @ Hood | 38.3 | 7.7 | mainstem | 38.378 | -121.525 | |
| Slough | SL-CTL | SR @ Courtland | 34.0 | 12.0 | mainstem | 38.327 | -121.576 | |
| Slough | Site 25, SL-25 | SR @ Steamboat Slough | 32.4 | 13.6 | mainstem | 38.305 | -121.573 | |
| Dugdale | KEN | SR @ Kenady Landing | 31.3 | 14.7 | mainstem | 38.292 | -121.562 | |
| Dugdale | CRS | SR @ Delta Cross Channel | 27.0 | 19.0 | mainstem | 38.264 | -121.511 | |
| Foe, Slough | Site 5, SL-5 | SR @ Walnut Grove | 26.8 | 19.2 | mainstem | 38.243 | -121.514 | |
| Dugdale, Slough | L37, SL-L37 | SR @ L37 | 20.7 | 25.3 | mainstem | 38.194 | -121.564 | |
| Foe, Dugdale, Slough | Site 6, ISL, SL-6 | SR @ Isleton | 16.6 | 29.4 | mainstem | 38.163 | -121.610 | |
| Slough | SL-31 | Miner Sl. @ Hwy 84 Bridge | 14.1 | 10.3 | 17.9 | distributary | 38.291 | -121.629 |
| Slough | SL-30 | Steamboat Sl. @ Ryer Bridge | 14.1 | 6.4 | 19.2 | distributary | 38.238 | -121.603 |
| Foe, Slough | Site 27, SL-27 | Miner Slough near mouth | 14.1 | 5.0 | 23.2 | distributary | 38.234 | -121.667 |
| Foe, Slough | Site 26, SL-26 | Steamboat Slough near mouth | 14.1 | 1.3 | 24.3 | distributary | 38.184 | -121.650 |
| Foe | Site 8, SL-8 | Cache Slough @ DWSC | 14.1 | 4.7 | 36.6 | slough | 38.237 | -121.673 |
| Foe, Slough | Site 9, SL-9 | Liberty Island | 14.1 | 6.1 | 38.0 | slough | 38.257 | -121.680 |
| Slough | SL-721 | Cache Slough @ pumphouse | 14.1 | 7.3 | 39.2 | slough | 38.269 | -121.702 |
| Foe, Slough | Site 10, SL-10 | Lindsey Slough | 14.1 | 8.2 | 40.1 | slough | 38.258 | -121.726 |
| Foe, Slough | Site 11, SL-11 | Toe Drain @ Dredger | 14.1 | 13.1 | 44.9 | slough | 38.354 | -121.643 |
| Dugdale | HAS | Cache Slough @ Hastings Br. | 14.1 | 38.2 | slough | 38.247 | -121.702 | |
| Dugdale | CCR | Cache Slough @ Ryer Island | 14.1 | 38.0 | slough | 38.217 | -121.670 |
Table 1. continued.
| Project Name | Site # | Sampling Location | RM (SR) | RM upstrm. from RM=0 | RM downstrm. from SRWTP |
site type | Latitude | Longitude |
|---|---|---|---|---|---|---|---|---|
| Foe, Dugdale | Site 7, US 657 | SR @ Rio Vista | 12.0 | 34.0 | mainstem | 38.157 | -121.685 | |
| Dugdale | US 655 | USGS 655 | 9.8 | 36.2 | mainstem | 38.122 | -121.701 | |
| Foe | Site 13 | SR @ Three Mile Slough | 9.4 | 36.6 | mainstem | 38.106 | -121.700 | |
| Dugdale | US 653 | USGS 653 | 8.4 | 37.6 | mainstem | 38.106 | -121.720 | |
| Dugdale | US 649 | Sacramento River | 3.0 | 43.0 | mainstem | 38.045 | -121.799 | |
| Dugdale | US 2 | SR @ Chain Island | 0.0 | 46.0 | mainstem | 38.063 | -121.855 | |
| Foe | Site 14 | SR @ Pt. Sacramento | -0.3 | 46.3 | mainstem | 38.062 | -121.857 | |
| Dugdale | US 3 | Pittsburg | -1.5 | 47.5 | mainstem | 38.055 | -121.875 | |
| Foe | Site 15 | Chipps Island | -3.9 | 49.9 | mainstem | 38.046 | -121.919 | |
| Dugdale | US 4 | Simmons Point | -4.7 | 50.7 | mainstem | 38.049 | -121.930 | |
| Dugdale | US 5 | Middle Ground | -7.3 | 53.3 | mainstem | 38.060 | -121.979 | |
| Dugdale | US 6 | Roe Island | -10.3 | 56.3 | mainstem | 38.065 | -122.040 | |
| Dugdale | US 7 | Avon Pier | -14.0 | 60.0 | mainstem | 38.032 | -122.098 | |
| Dugdale | US 13 | North of Pinole Point | -30.5 | 76.5 | mainstem | 38.029 | -122.369 | |
| Dugdale | Site 25 | Paradise Cay | -35.7 | 81.7 | mainstem | 37.934 | -122.459 |
Table 2
Interpretive value of different isotope tracer types.
| Tracer type | Interpretive value |
|---|---|
| Particulate organic matter (POM) δ15N, δ13C, δ34S, and C:N | Information about the source of the C, N, and S - and the biogeochemical reactions that cycle the elements - even after incorporation into algal biomass; quantify algal vs. terrestrial contributions to biomass. |
| Nitrate δ18O, δ15N, and Δ17O | Quantify nitrate from different sources (fertilizer, wastewater, wetlands, atmosphere, etc), role in the productions of algae, and the degree of recycling, evidence for denitrification or assimilation |
| Ammonium δ15N | Quantify ammonium from different sources (fertilizer, wastewater, wetlands, etc), role in the production of algae, and degree of recycling, evidence for nitrification or assimilation. |
| Water δ18O and δ2H | Ideal conservative tracer of water sources and mixing; useful for quantifying flow contributions from different tributaries and groundwater. |
| Dissolved organic matter (DOM) δ15N, δ13C, δ34S, and C:N | Information about the source of the C, N, and S - and the biogeochemical reactions that cycle the elements - even after incorporation into algal biomass; quantify algal vs. terrestrial contributions to biomass. |
| Dissolved inorganic carbon (DIC) δ13C | Information on sources of DIC, evidence for in situ algal productivity, evidence for degradation of organic matter, degree of gas exchange with atmosphere, nitrification. |
Table 3
Average isotopic data by site. Site type codes: m = mainstem; s = slough; d = distributary.
| Sampling Location | RM (SR) | RM downstr. of SRWTP | site type | # samples | POM δ13C | POM δ15N | POM C:N (at.) | POM δ34S | POM C:S (at.) | DOC δ13C | NO3 δ15N | NO3 δ18O | NH4 δ15N | H2O δ18O | H2O δ2H |
|---|---|---|---|---|---|---|---|---|---|---|---|---|---|---|---|
| SR @ I-80 Bridge | 62.6 | -16.6 | m | 2 | -27.7 | 5.5 | 7.5 | 4.4 | -25.4 | 7.5 | 3.4 | -10.9 | -79.5 | ||
| SR @ Tower Bridge | 59.0 | -13.0 | m | 13 | -27.0 | 4.4 | 8.3 | 1.2 | 84 | -25.4 | 6.8 | 1.3 | 6.1 | -11.3 | -79.4 |
| SR @ Oak Hall Bend | 53.5 | -7.5 | m | 2 | -27.5 | 5.2 | 7.6 | 3.1 | -25.1 | 6.0 | 6.2 | -11.0 | -79.3 | ||
| SR @ Garcia Bend | 49.4 | -3.4 | m | 13 | -27.4 | 2.9 | 8.5 | 2.2 | 89 | -24.6 | 6.6 | 1.6 | 4.1 | -10.9 | -79.6 |
| SR @ River Mile 44 | 43.8 | 2.3 | m | 2 | -26.9 | 3.0 | 7.7 | 2.1 | -24.5 | 7.0 | 2.5 | 7.0 | -11.2 | -79.5 | |
| SR @ Hood | 38.3 | 7.7 | m | 13 | -26.6 | 2.3 | 8.5 | 0.8 | 105 | -24.4 | 6.0 | 0.2 | 8.5 | -11.2 | -79.6 |
| SR @ Courtland | 34.0 | 12.0 | m | 10 | -27.8 | 3.9 | 8.6 | 1.7 | 101 | 7.5 | -1.4 | 8.7 | |||
| SR @ Steamboat Slough | 32.4 | 13.6 | m | 12 | -27.5 | 4.4 | 8.7 | 1.0 | 105 | 6.6 | 0.9 | 9.1 | |||
| SR @ Kenady Landing | 31.3 | 14.7 | m | 2 | -26.7 | 2.5 | 8.2 | 0.7 | -24.1 | 5.2 | -3.1 | 7.6 | -10.8 | -79.0 | |
| SR @ Delta Cross Channel | 27.0 | 19.0 | m | 2 | -26.6 | 2.6 | 8.1 | 2.2 | -23.8 | 5.8 | -2.8 | 8.4 | -10.9 | -78.4 | |
| SR @ Walnut Grove | 26.8 | 19.2 | m | 21 | -27.3 | 2.4 | 8.9 | 1.1 | 104 | 5.6 | -1.5 | 9.6 | |||
| SR @ L37 | 20.7 | 25.3 | m | 12 | -27.7 | 2.7 | 8.7 | 2.1 | 111 | -23.7 | 6.1 | 0.5 | 9.5 | -10.8 | -77.8 |
| SR @ Isleton | 16.6 | 29.4 | m | 23 | -27.3 | 2.7 | 8.6 | 1.4 | 90 | -24.8 | 5.0 | -2.6 | 10.2 | -10.8 | -78.1 |
| Miner Slough @ Hwy 84 Br. | 14.1 | 17.9 | d | 10 | -28.1 | 2.8 | 9.0 | 0.9 | 115 | 6.2 | -2.6 | 9.7 | |||
| Steamboat Slough @ Ryer Br. | 14.1 | 19.2 | d | 10 | -28.0 | 4.2 | 8.7 | 0.9 | 111 | 6.1 | -2.2 | 10.3 | |||
| Miner Slough near mouth | 14.1 | 23.2 | d | 12 | -28.1 | 3.7 | 8.8 | 0.5 | 109 | 5.8 | -2.0 | 10.4 | |||
| Steamboat Sl. near mouth | 14.1 | 24.3 | d | 13 | -27.7 | 3.1 | 9.2 | 1.1 | 105 | 5.9 | -3.1 | 10.2 | |||
| Cache Slough @ DWSC | 14.1 | 36.6 | s | 21 | -29.0 | 3.8 | 8.4 | 0.9 | 114 | -25.4 | 5.5 | -3.6 | 11.8 | -9.8 | -76.0 |
| Liberty Island | 14.1 | 38.0 | s | 17 | -29.0 | 3.7 | 8.1 | 0.7 | 111 | -26.2 | 5.7 | -4.5 | 11.9 | -9.6 | -75.9 |
| Cache Slough @ Ryer Island | 14.1 | 38.0 | s | 2 | -29.6 | 6.2 | 7.6 | -0.9 | -24.6 | 6.2 | 0.2 | 10.3 | -8.9 | -65.6 | |
| Cache Slough @ Hastings Br. | 14.1 | 38.2 | s | 2 | -28.9 | 4.5 | 8.3 | -1.0 | -26.9 | 6.5 | 0.3 | 12.1 | -9.2 | -67.2 | |
| Cache Slough @ pumphouse | 14.1 | 39.2 | s | 5 | -29.0 | 3.7 | 8.1 | -0.5 | 111 | -26.2 | 5.7 | -4.5 | 11.9 | -9.6 | -75.9 |
| Lindsey Slough | 14.1 | 40.1 | s | 21 | -29.9 | 6.4 | 7.7 | 2.0 | 125 | -25.9 | 6.0 | -2.6 | 11.3 | -9.4 | -73.4 |
| Toe Drain @ Dredger | 14.1 | 44.9 | s | 21 | -29.5 | 6.0 | 7.5 | -0.4 | 102 | -25.7 | 7.8 | 1.6 | 8.1 | -7.5 | -65.3 |
Table 3. continued.
| Sampling Location | RM (SR) | RM downstr. of SRWTP | site type | # samples | POM δ13C | POM δ15N | POM C:N Ratio (at.) | POM δ34S | POM C:S Ratio (at.) | DOC δ13C | NO3 δ15N | NO3 δ18O | NH4 δ15N | H2O δ18O | H2O δ2H |
|---|---|---|---|---|---|---|---|---|---|---|---|---|---|---|---|
| SR @ Rio Vista | 12.0 | 34.0 | m | 15 | -27.4 | 2.6 | 8.8 | -0.3 | 99 | -25.8 | 4.9 | -3.8 | 12.0 | -10.3 | -75.2 |
| USGS 655 | 9.8 | 36.2 | m | 3 | -27.5 | 2.9 | 9.6 | 2.3 | -26.3 | 4.5 | -2.8 | 11.3 | -10.3 | -74.2 | |
| SR @ Three Mile Slough | 9.4 | 36.6 | m | 11 | -27.7 | 4.1 | 8.8 | 3.7 | 100 | 5.7 | -4.2 | 12.5 | |||
| USGS 653 | 8.4 | 37.6 | m | 2 | -26.7 | 3.5 | 9.3 | 0.6 | -25.5 | 4.5 | -3.7 | 11.7 | -10.2 | -74.9 | |
| Sacramento River | 3.0 | 43.0 | m | 2 | -27.1 | 5.2 | 8.6 | 4.3 | -24.7 | 4.4 | -1.6 | 12.4 | -9.9 | -73.8 | |
| SR @ Chain Island | 0.0 | 46.0 | m | 2 | -27.2 | 4.1 | 8.8 | 4.9 | -25.0 | 5.2 | -0.2 | 13.1 | -9.8 | -72.5 | |
| SR @ Pt. Sacramento | -0.3 | 46.3 | m | 11 | -26.8 | 4.0 | 9.4 | 7.2 | 51 | 6.0 | -4.1 | 13.8 | |||
| Pittsburg | -1.5 | 47.5 | m | 2 | -27.2 | 4.1 | 8.6 | 5.6 | -25.7 | 5.4 | -3.1 | 14.2 | -9.6 | -72.6 | |
| Chipps Island | -3.9 | 49.9 | m | 11 | -26.5 | 4.6 | 9.5 | 8.5 | 34 | 6.2 | -3.8 | 14.2 | |||
| Simmons Point | -4.7 | 50.7 | m | 2 | -27.4 | 4.5 | 8.9 | 6.0 | -25.0 | 5.1 | -2.7 | 14.4 | -9.7 | -71.9 | |
| Middle Ground | -7.3 | 53.3 | m | 2 | -26.9 | 4.5 | 8.7 | 7.6 | -25.0 | 5.5 | -1.1 | 14.2 | -9.6 | -70.0 | |
| Roe Island | -10.3 | 56.3 | m | 2 | -26.7 | 5.1 | 8.5 | 7.9 | -24.5 | 5.4 | -0.1 | 15.6 | -9.3 | -67.5 | |
| Avon Pier | -14.0 | 60.0 | m | 2 | -26.6 | 5.2 | 8.2 | 9.6 | -24.5 | 4.8 | -0.7 | 15.2 | -8.1 | -60.4 | |
| North of Pinole Point | -30.5 | 76.5 | m | 2 | -25.8 | 5.1 | 7.2 | 13.6 | -23.7 | 6.2 | 4.2 | 16.3 | -3.6 | -26.4 | |
| Paradise Cay | -35.7 | 81.7 | m | 1 | -27.9 | 3.9 | 8.1 | 21.2 | -25.3 | 7.2 | 11.7 | 10.6 | -2.8 | -21.7 |
Table 4a
Unpaired t-tests for Isleton vs all Cache Slough “tributary” sites. NS= non-significant differences. For significant differences, T>R or T<R indicate whether the T (tributary) is significantly higher or lower than the R (river) value.
| Parameter | # River | # Trib | P value | River vs. Trib |
|---|---|---|---|---|
| δ15N-NO3 | 18 | 79 | 1.8E-03 | T>R |
| δ18O-NO3 | 18 | 79 | 6.2E-01 | NS |
| δ15N-NH4 | 21 | 66 | 1.7E-01 | NS |
| POM-C:N (at) | 21 | 85 | 2.4E-03 | T<R |
| δ13C-POM | 20 | 85 | 1.3E-11 | T<R |
| δ15N-POM | 20 | 84 | 7.6E-05 | T>R |
| δ34S-POM | 16 | 76 | 1.2E-01 | NS |
| DOC | 21 | 85 | 9.8E-05 | T>R |
| DON | 10 | 41 | 1.6E-03 | T>R |
| NO3+NO2 | 21 | 85 | 9.4E-09 | T>R |
| NO2 | 21 | 85 | 4.8E-02 | T>R |
| PO4 | 21 | 85 | 7.2E-10 | T>R |
| NH4 | 21 | 85 | 5.8E-07 | T<R |
| Chl a | 21 | 85 | 2.8E-11 | T>R |
| Sp. Cond | 17 | 69 | 7.1E-08 | T>R |
Table 4b
Date-paired t-tests for Isleton vs all Cache Slough “tributary” sites.
| Parameter | # River | # Trib. | # Pairs | P value | River vs. Trib. |
| δ15N-NO3 | 18 | 79 | 79 | 1.8E-03 | T>R |
| δ18O-NO3 | 18 | 79 | 79 | 6.2E-01 | NS |
| δ15N-NH4 | 21 | 66 | 66 | 1.7E-01 | NS |
| POM-C:N (at) | 21 | 85 | 85 | 2.4E-03 | T<R |
| δ13C-POM | 20 | 85 | 85 | 1.3E-11 | T<R |
| δ15N-POM | 20 | 84 | 84 | 7.6E-05 | T>R |
| δ34S-POM | 16 | 76 | 16 | 6.4E-03 | T<R |
| DOC | 21 | 85 | 85 | 9.8E-05 | T>R |
| DON | 10 | 41 | 41 | 1.6E-03 | T>R |
| NO3+NO2 | 21 | 85 | 85 | 9.4E-09 | T>R |
| NO2 | 21 | 85 | 85 | 4.8E-02 | T>R |
| PO4 | 21 | 85 | 85 | 7.2E-10 | T>R |
| NH4 | 21 | 85 | 85 | 5.8E-07 | T<R |
| Chl a | 21 | 85 | 85 | 2.8E-11 | T>R |
| Sp. Cond | 17 | 69 | 69 | 7.1E-08 | T>R |
Table 5a
Date-paired t-tests for Isleton vs. Liberty Island site.
| Parameter | # River | # Trib. | # Pairs | P value | River vs. Trib. |
| δ15N-NO3 | 14 | 15 | 14 | 3.9E-04 | T>R |
| δ18O-NO3 | 14 | 15 | 14 | 1.3E-01 | NS |
| δ15N-NH4 | 17 | 15 | 15 | 2.7E-02 | T>R |
| POM-C:N (at) | 17 | 17 | 17 | 2.9E-01 | NS |
| δ13C-POM | 16 | 17 | 16 | 4.9E-05 | T<R |
| δ15N-POM | 16 | 17 | 16 | 1.9E-02 | T>R |
| δ34S-POM | 12 | 15 | 12 | 5.4E-01 | NS |
| DOC | 17 | 17 | 17 | 7.0E-02 | NS |
| DON | 6 | 6 | 6 | 1.0E-01 | NS |
| NO3+NO2 | 17 | 17 | 17 | 1.4E-03 | T>R |
| NO2 | 17 | 17 | 17 | 2.3E-01 | NS |
| PO4 | 17 | 17 | 17 | 3.4E-02 | T>R |
| NH4 | 17 | 17 | 17 | 2.3E-05 | T<R |
| Chl a | 17 | 17 | 17 | 2.5E-02 | T>R |
| Sp. Cond | 16 | 15 | 15 | 3.2E-06 | T>R |
Table 5b
Date-paired t-tests for Isleton vs. Cache Slough @ DWSC site.
| Parameter | # River | # Trib. | # Pairs | P value | River vs. Trib. |
| δ15N-NO3 | 18 | 20 | 18 | 1.8E-01 | NS |
| δ18O-NO3 | 18 | 20 | 18 | 1.9E-01 | NS |
| δ15N-NH4 | 21 | 20 | 20 | 1.3E-05 | T>R |
| POM-C:N (at) | 21 | 21 | 21 | 4.2E-01 | NS |
| δ13C-POM | 20 | 21 | 20 | 2.3E-03 | T<R |
| δ15N-POM | 20 | 21 | 20 | 6.3E-02 | NS |
| δ34S-POM | 16 | 19 | 16 | 5.1E-01 | NS |
| DOC | 21 | 21 | 21 | 9.6E-04 | T>R |
| DON | 10 | 10 | 10 | 3.2E-01 | NS |
| NO3+NO2 | 21 | 21 | 21 | 4.5E-07 | T>R |
| NO2 | 21 | 21 | 21 | 4.0E-07 | T>R |
| PO4 | 21 | 21 | 21 | 5.0E-05 | T>R |
| NH4 | 21 | 21 | 21 | 4.9E-06 | T<R |
| Chl a | 21 | 21 | 21 | 1.8E-02 | T>R |
| Sp. Cond | 17 | 17 | 17 | 5.1E-06 | T>R |
Table 5c
Date-paired t-tests for Isleton vs. Lindsey Slough site.
| Parameter | # River | # Trib. | # Pairs | P value | River vs. Trib. |
| δ15N-NO3 | 18 | 18 | 18 | 7.4E-05 | T>R |
| δ18O-NO3 | 18 | 18 | 18 | 7.6E-01 | NS |
| δ15N-NH4 | 21 | 14 | 14 | 2.7E-01 | NS |
| POM-C:N (at) | 21 | 21 | 21 | 1.3E-02 | T<R |
| δ13C-POM | 20 | 21 | 20 | 3.2E-07 | T<R |
| δ15N-POM | 20 | 20 | 20 | 9.8E-07 | T>R |
| δ34S-POM | 16 | 18 | 16 | 7.8E-01 | NS |
| DOC | 21 | 21 | 21 | 3.3E-05 | T>R |
| DON | 10 | 10 | 10 | 3.1E-03 | T>R |
| NO3+NO2 | 21 | 21 | 21 | 2.7E-05 | T>R |
| NO2 | 21 | 21 | 21 | 8.3E-04 | T>R |
| PO4 | 21 | 21 | 21 | 5.4E-05 | T>R |
| NH4 | 21 | 21 | 21 | 2.6E-08 | T<R |
| Chl a | 21 | 21 | 21 | 9.8E-06 | T>R |
| Sp. Cond | 17 | 17 | 17 | 1.1E-07 | T>R |
Table 5d
Date-paired t-tests for Isleton vs. Toe Drain site.
| Parameter | # River | # Trib. | # Pairs | P value | River vs. Trib. |
| δ15N-NO3 | 18 | 21 | 18 | 5.2E-06 | T>R |
| δ18O-NO3 | 18 | 21 | 18 | 4.7E-03 | T>R |
| δ15N-NH4 | 21 | 15 | 15 | 3.0E-02 | T<R |
| POM-C:N (at) | 21 | 21 | 21 | 2.0E-03 | T<R |
| δ13C-POM | 20 | 21 | 20 | 5.6E-08 | T<R |
| δ15N-POM | 20 | 21 | 20 | 2.4E-05 | T>R |
| δ34S-POM | 16 | 19 | 16 | 5.8E-03 | T<R |
| DOC | 21 | 21 | 21 | 1.1E-06 | T>R |
| DON | 10 | 10 | 10 | 5.2E-06 | T>R |
| NO3+NO2 | 21 | 21 | 21 | 3.0E-04 | T>R |
| NO2 | 21 | 21 | 21 | 2.6E-01 | NS |
| PO4 | 21 | 21 | 21 | 1.6E-10 | T>R |
| NH4 | 21 | 21 | 21 | 3.7E-08 | T<R |
| Chl a | 21 | 21 | 21 | 5.9E-06 | T>R |
| Sp. Cond | 17 | 16 | 16 | 3.2E-05 | T>R |
Table 6a
T-tests for both Miner Slough vs. both Steamboat Slough sites.
| Parameter | # River | # Trib. | P value | Miner vs. Steamboat |
| δ15N-NO3 | 16 | 18 | 0.98 | NS |
| δ18O-NO3 | 16 | 18 | 0.74 | NS |
| δ15N-NH4 | 22 | 23 | 0.72 | NS |
| POM-C:N (at) | 22 | 22 | 0.79 | NS |
| δ13C-POM | 21 | 20 | 0.41 | NS |
| δ15N-POM | 21 | 20 | 0.60 | NS |
| δ34S-POM | 19 | 22 | 0.42 | NS |
| DOC | 22 | 23 | 0.51 | NS |
| DON | 20 | 21 | 0.95 | NS |
| NO3+NO2 | 22 | 23 | 0.52 | NS |
| NO2 | 22 | 23 | 0.67 | NS |
| PO4 | 22 | 23 | 0.39 | NS |
| NH4 | 22 | 23 | 0.89 | NS |
| Chl a | 22 | 23 | 0.24 | NS |
| Sp. Cond | 14 | 14 | 0.34 | NS |
Table 6b
T-tests for lower Miner Slough vs. lower Steamboat Slough sites.
| Parameter | # River | # Trib. | P value | Miner vs. Steamboat |
| δ15N-NO3 | 9 | 10 | 0.89 | NS |
| δ18O-NO3 | 9 | 10 | 0.59 | NS |
| δ15N-NH4 | 12 | 13 | 0.66 | NS |
| POM-C:N (at) | 12 | 12 | 0.33 | NS |
| δ13C-POM | 11 | 12 | 0.41 | NS |
| δ15N-POM | 11 | 12 | 0.51 | NS |
| δ34S-POM | 12 | 11 | 0.35 | NS |
| DOC | 12 | 13 | 0.87 | NS |
| DON | 10 | 11 | 0.89 | NS |
| NO3+NO2 | 12 | 13 | 0.62 | NS |
| NO2 | 12 | 13 | 0.57 | NS |
| PO4 | 12 | 13 | 0.43 | NS |
| NH4 | 12 | 13 | 0.89 | NS |
| Chl a | 12 | 13 | 0.22 | NS |
| Sp. Cond | 8 | 8 | 0.92 | NS |
Table 7a
T-tests for Isleton vs. both Steamboat Slough sites.
| Parameter | # River | # Trib. | P value | River vs. Trib. |
| δ15N-NO3 | 18 | 18 | 0.07 | NS |
| δ18O-NO3 | 18 | 18 | 0.89 | NS |
| δ15N-NH4 | 21 | 23 | 0.66 | NS |
| POM-C:N (at) | 21 | 22 | 0.41 | NS |
| δ13C-POM | 20 | 20 | 0.19 | NS |
| δ15N-POM | 20 | 20 | 0.25 | NS |
| δ34S-POM | 16 | 22 | 0.67 | NS |
| DOC | 21 | 23 | 0.40 | NS |
| DON | 10 | 21 | 0.99 | NS |
| NO3+NO2 | 21 | 23 | 0.51 | NS |
| NO2 | 21 | 23 | 0.14 | NS |
| PO4 | 21 | 23 | 0.02 | T<R |
| NH4 | 21 | 23 | 0.02 | T<R |
| Chl a | 21 | 23 | 0.93 | NS |
| Sp. Cond | 17 | 14 | 0.36 | NS |
Table 7b
T-tests for Isleton vs. both Miner Slough sites.
| Parameter | # River | # Trib. | P value | River vs. Trib. |
| δ15N-NO3 | 18 | 16 | 0.06 | NS |
| δ18O-NO3 | 18 | 16 | 0.84 | NS |
| δ15N-NH4 | 21 | 22 | 0.40 | NS |
| POM-C:N (at) | 21 | 22 | 0.54 | NS |
| δ13C-POM | 20 | 21 | 0.01 | T<R |
| δ15N-POM | 20 | 21 | 0.53 | NS |
| δ34S-POM | 16 | 19 | 0.24 | NS |
| DOC | 21 | 22 | 0.79 | NS |
| DON | 10 | 20 | 0.96 | NS |
| NO3+NO2 | 21 | 22 | 0.22 | NS |
| NO2 | 21 | 22 | 0.07 | NS |
| PO4 | 21 | 22 | 0.00 | T<R |
| NH4 | 21 | 22 | 0.03 | T<R |
| Chl a | 21 | 22 | 0.35 | NS |
| Sp. Cond | 17 | 14 | 0.76 | NS |
Table 7c
T-tests for Isleton vs. lower Steamboat Slough site.
| Parameter | # River | # Trib. | P value | River vs. Trib. |
| δ15N-NO3 | 18 | 10 | 0.19 | NS |
| δ18O-NO3 | 18 | 10 | 0.72 | NS |
| δ15N-NH4 | 21 | 13 | 0.66 | NS |
| POM-C:N (at) | 21 | 12 | 0.15 | NS |
| δ13C-POM | 20 | 12 | 0.46 | NS |
| δ15N-POM | 20 | 12 | 0.73 | NS |
| δ34S-POM | 16 | 12 | 0.84 | NS |
| DOC | 21 | 13 | 0.48 | NS |
| DON | 10 | 11 | 0.85 | NS |
| NO3+NO2 | 21 | 13 | 0.74 | NS |
| NO2 | 21 | 13 | 0.51 | NS |
| PO4 | 21 | 13 | 0.09 | NS |
| NH4 | 21 | 13 | 0.02 | T<R |
| Chl a | 21 | 13 | 0.94 | NS |
| Sp. Cond | 17 | 8 | 0.89 | NS |
Table 7d
T-tests for Isleton vs. lower Miner Slough site.
| Parameter | # River | # Trib. | P value | River vs. Trib. |
| δ15N-NO3 | 18 | 9 | 0.24 | NS |
| δ18O-NO3 | 18 | 9 | 0.77 | NS |
| δ15N-NH4 | 21 | 12 | 0.91 | NS |
| POM-C:N (at) | 21 | 12 | 0.76 | NS |
| δ13C-POM | 20 | 11 | 0.07 | NS |
| δ15N-POM | 20 | 11 | 0.31 | NS |
| δ34S-POM | 16 | 11 | 0.22 | NS |
| DOC | 21 | 12 | 0.45 | NS |
| DON | 10 | 10 | 0.77 | NS |
| NO3+NO2 | 21 | 12 | 0.81 | NS |
| NO2 | 21 | 12 | 0.21 | NS |
| PO4 | 21 | 12 | 0.02 | T<R |
| NH4 | 21 | 12 | 0.06 | NS |
| Chl a | 21 | 12 | 0.31 | NS |
| Sp. Cond | 17 | 8 | 0.81 | NS |
Table 8a
Date-paired t-tests for Isleton vs. lower Steamboat Slough site.
| Parameter | # River | # Trib | # Pairs | P value | River vs. Trib. |
| δ15N-NO3 | 10 | 10 | 10 | 0.28 | NS |
| δ18O-NO3 | 10 | 10 | 10 | 0.44 | NS |
| δ15N-NH4 | 12 | 12 | 12 | 0.74 | NS |
| POM-C:N (at) | 12 | 12 | 12 | 0.16 | NS |
| δ13C-POM | 11 | 11 | 11 | 1.00 | NS |
| δ15N-POM | 11 | 11 | 11 | 0.95 | NS |
| δ34S-POM | 11 | 12 | 11 | 0.91 | NS |
| DOC | 12 | 12 | 12 | 0.66 | NS |
| DON | 10 | 10 | 10 | 0.72 | NS |
| NO3+NO2 | 12 | 12 | 12 | 0.03 | T>R |
| NO2 | 12 | 12 | 12 | 0.10 | NS |
| PO4 | 12 | 12 | 12 | 0.98 | NS |
| NH4 | 12 | 12 | 12 | 0.04 | T<R |
| Chl a | 12 | 12 | 12 | 0.05 | T<R |
| Sp. Cond | 8 | 8 | 8 | 0.03 | T>R |
Table 8b
Date-paired t-tests for Isleton vs. lower Miner Slough site.
| Parameter | # River | # Trib | # Pairs | P value | River vs. Trib. |
| δ15N-NO3 | 7 | 7 | 7 | 0.85 | NS |
| δ18O-NO3 | 7 | 7 | 7 | 0.13 | NS |
| δ15N-NH4 | 10 | 10 | 10 | 0.22 | NS |
| POM-C:N (at) | 10 | 10 | 10 | 0.28 | NS |
| δ13C-POM | 10 | 10 | 10 | 0.002 | T<R |
| δ15N-POM | 10 | 10 | 10 | 0.61 | NS |
| δ34S-POM | 8 | 8 | 8 | 0.22 | NS |
| DOC | 10 | 10 | 10 | 0.33 | NS |
| DON | 10 | 10 | 10 | 0.43 | NS |
| NO3+NO2 | 10 | 10 | 10 | 0.01 | T>R |
| NO2 | 10 | 10 | 10 | 0.003 | T>R |
| PO4 | 10 | 10 | 10 | 0.46 | NS |
| NH4 | 10 | 10 | 10 | 0.97 | NS |
| Chl a | 10 | 10 | 10 | 0.10 | NS |
| Sp. Cond | 6 | 6 | 6 | 0.06 | NS |
http://www.usbr.gov/mp/cvo/vungvari/xcgtxt.html this link gives a general explanation of the constraints on DCC gate operation.↩