National Water-Quality Assessment (NAWQA) Program
Go to:
By Bernard T. Nolan, Barbara C. Ruddy, Kerie J. Hitt, and Dennis R. Helsel
[Water Conditioning and Purification, January 1998, v. 39, no. 12, pages 76-79.]This article has been superseded by Probability of nitrate contamination of recently recharged groundwaters in the conterminous United States.
Ground water provides drinking water for more than one-half of the Nation's population (Solley and others, 1993), and is the sole source of drinking water for many rural communities and some large cities. In 1990, ground water accounted for 39 percent of water withdrawn for public supply for cities and towns and 96 percent of water withdrawn by self-supplied systems for domestic use.
A variety of chemicals, including nitrate, can pass through the soil and potentially contaminate ground water. Nitrate comes from nitrogen, a plant nutrient supplied by inorganic fertilizer and animal manure. Additionally, airborne nitrogen compounds given off by industry and automobiles are deposited on the land in precipitation and dry particles. Other nonagricultural sources of nitrate include lawn fertilizers, septic systems, and domestic animals in residential areas.
Beneath agricultural lands, nitrate is the primary form of nitrogen. It is soluble in water and can easily pass through soil to the ground-water table. Nitrate can persist in ground water for decades and accumulate to high levels as more nitrogen is applied to the land surface every year.
Knowing where and what type of risks to ground water exist can alert water-resource managers and private users of the need to protect water supplies. Although nitrate generally is not an adult public-health threat, ingestion in drinking water by infants can cause low oxygen levels in the blood, a potentially fatal condition (Spalding and Exner, 1993). For this reason, the U.S. Environmental Protection Agency (EPA) has established a drinking-water standard of 10 milligrams per liter (mg/L) nitrate as nitrogen (U.S. Environmental Protection Agency, 1995). Nitrate concentrations in natural ground waters are usually less than 2 mg/L (Mueller and others, 1995).
Risk of ground-water contamination by nitrate varies across the United States
The risk of ground-water contamination by nitrate depends both on the nitrogen input to the land surface and the degree to which an aquifer is vulnerable to nitrate leaching and accumulation. Variables describing nitrogen input and aquifer vulnerability were estimated and compiled in a national map (figure 1) using procedures described by Nolan and others (1997).
Figure 1. Areas in the United States with the highest risk of nitrate contamination of shallow ground water (shown in red on the map) generally have high nitrogen input, well-drained soils, and less extensive woodland relative to cropland.
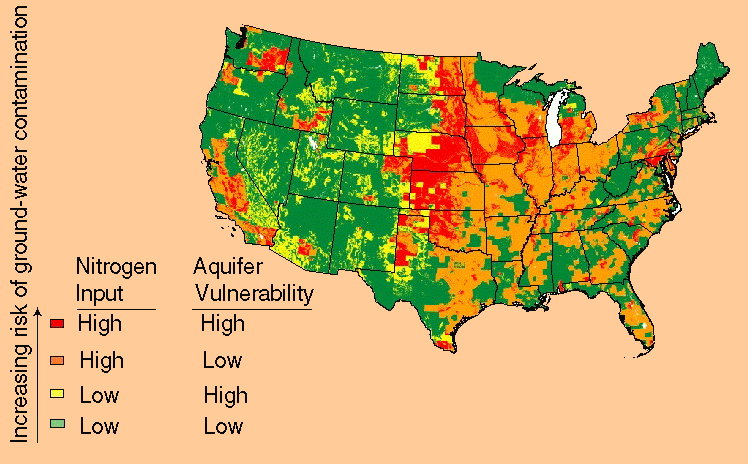
The map shows four levels of contamination risk of shallow ground water (less than 100 feet deep):
(1) low nitrogen input and low
aquifer vulnerability (green area on the map);
(2) low nitrogen input
and high aquifer vulnerability (yellow area);
(3) high nitrogen input
and low aquifer vulnerability (orange area); and
(4) high nitrogen
input and high aquifer vulnerability (red area).
"Nitrogen input" refers to nitrogen deposited on the land surface, and "aquifer vulnerability" indicates the likelihood that nitrate from a nitrogen source at the land surface will reach the water table.
Nitrogen inputs comprise the following two factors: "loadings" from agricultural and nonagricultural sources; and "population density," a variable used to indicate additional nonagricultural sources of nitrogen in urban areas (table 1). Nitrogen loadings are contributed by inorganic fertilizers, animal manure, and atmospheric deposition of airborne nitrogen compounds. Population density represents nitrogen sources such as residential fertilizers, septic systems, and domestic animal waste in urban areas.
Table 1: Factors used to map risk of nitrate contamination of ground water
| Magnitude of Risk | Nitrogen-Input Factors | Aquifer-Vulnerability Factors |
|---|---|---|
| High (red areas on map--fig. 1) | High nitrogen loadinga or high population densityb | Well-drained soil and low woodland-to-cropland ratio |
| Moderately High (orange areas) | High nitrogen loadinga or high population densityb | Poorly drained soil or high woodland-to-cropland ratio |
| Moderately Low (yellow areas) | Low nitrogen loadinga and low population densityb | Well-drained soil and low woodland-to-cropland ratio |
| Low (green areas) | Low nitrogen loadinga and low population densityb | Poorly drained soil or high woodland-to-cropland ratio |
aNitrogen loading refers to nitrogen inputs from
inorganic fertilizer, animal manure, and atmospheric deposition.
bPopulation density is used to indicate additional
nonagricultural sources of nitrogen such as residential fertilizers,
septic systems, and domestic animals.
Aquifer vulnerability depends on soil-drainage characteristics--the ease with which water and chemicals can seep to ground water--and the extent of cropland versus woodland in agricultural areas. Denitrification and plant uptake can occur beneath forests bordering streams near cropland (Lowrance, 1992), and precipitation seeping through forest soils to ground water contains less nitrogen than seepage beneath an agricultural field. Areas with a high risk of ground-water contamination by nitrate generally have high nitrogen loading or high population density, well-drained soils, and less extensive woodland relative to cropland.
The Midwest has a high risk of ground-water contamination by nitrate, but parts of the western and northeastern United States also are high-risk (figure 1). These areas--like others shown in red on the national map--have high nitrogen input and vulnerable aquifers. In contrast, the green, yellow, and orange areas (low to moderate risk) have low nitrogen input and/or less vulnerable aquifers.
The national risk map indicates contamination potential, but does not show actual nitrate contamination of ground water. Water-quality testing is necessary to determine actual nitrate concentration. Compared with public-supply wells, most privately owned wells are not routinely monitored for water quality.
Nitrate in ground water generally follows the risk map
Ground-water nitrate data collected by the U.S. Geological Survey's National Water-Quality Assessment (NAWQA) Program were analyzed to verify the four risk groups shown on the national map. The NAWQA Program was begun in 1991 to describe the quality of the Nation's water resources, using nationally consistent methods. Whereas prior verification work (Nolan and others, 1997) used historical nitrate data, the current analysis used data from more than 1,400 wells sampled by the NAWQA Program during 1993 - 1995.
Nitrate concentration in ground water generally increases with higher nitrogen input and higher aquifer vulnerability. People who live in areas shown in red on the national map and who consume shallow ground water are more likely to drink high-nitrate water. The bar chart in figure 2 shows the median concentration of nitrate in water from shallow wells and the percent of wells in which the concentration of nitrate exceeds the EPA drinking-water standard (10 mg/L) for each of the four risk groups. Each bar in figure 2 represents a risk group with the same color on the national map. Median nitrate concentration and percent of wells from which water exceeds the EPA drinking-water standard for nitrate are highest in areas with high nitrogen input and high aquifer vulnerability (red areas).
Figure 2. Nitrate concentration in shallow ground water (less than 100 feet deep) and percent of wells in which the concentration of nitrate exceeds the drinking-water standard (10 milligrams per liter) generally increase with increasing risk of contamination.
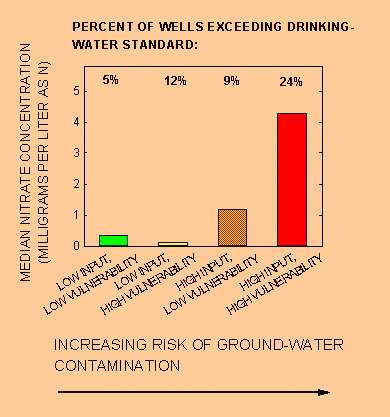
Data for specific locations give examples of the difference in risk. Ground water in areas shown in red in southeastern Washington State has a median nitrate concentration of 9.3 mg/L. In contrast, ground water in areas shown in green and yellow in western New Mexico, where nitrogen input is low, has a median nitrate concentration of 0.17 mg/L.
Poorly drained soils can reduce the risk of ground-water contamination, even in areas with high nitrogen input. For example, ground water in areas shown in orange in southern Indiana has a median nitrate concentration of < 0.05 mg/L. Although nitrogen input is high, most soils in the area are poorly drained, which restricts the movement of nitrate to the water table (Mueller and others, 1995). Additionally, drains and ditches carry water off to streams rather than letting it seep to ground water.
Large amounts of woodland interspersed among cropland can decrease the likelihood of ground-water contamination, even in areas with high nitrogen input and, in some cases, well-drained soils. Ground water in areas shown in orange in southern Georgia and northern Florida has a median nitrate concentration of only 1.2 mg/L, despite the extensive use of fertilizers in these areas. Proposed explanations for low nitrate in shallow ground waters of the Southeast include dilution, denitrification, and uptake by plants (Hubbard and Sheridan, 1989).
Ground-water nitrate data in some areas did not conform to risk patterns shown in figure 1. For example, median nitrate concentration in ground-water samples from eastern North Dakota (shown in red on the national map) was < 0.05 mg/L, even though the map indicates high contamination potential. The undulating, hilly landscape might be a factor. Although soils in the area are fine-textured, they are classified as well-drained because of their position and slope on the landscape. Water quickly runs off the hills and collects in low-lying areas, where denitrification can occur. Other factors not used to create the national map but which can affect nitrate concentration in ground water include land use, aquifer type, and rainfall and irrigation amounts.
Who is most likely to drink high-nitrate ground water?
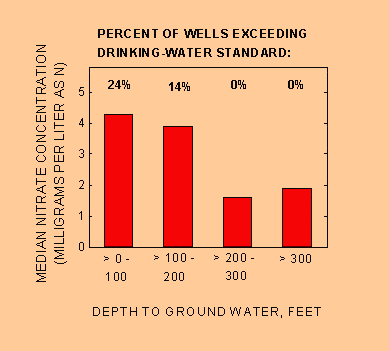
Where people live and the depth of their ground-water supply determine the quality of the water they drink. In figure 3, four ranges of depth to ground water are shown for the high-risk (red) areas on the national map. Nitrate contamination generally decreases with increasing depth to ground water. Median nitrate concentration and percent of wells from which water exceeds the EPA drinking-water standard for nitrate (10 mg/L) are highest for shallow ground water (up to 100 feet deep). The water table in shallow wells is closer to the land surface and to potential sources of contamination, such as fertilizers and septic systems. In contrast, contamination is less likely to occur in deeper ground-water reservoirs because contaminants have farther to travel (Mueller and others, 1995).
Figure 3. Nitrate concentration in ground water and percent of wells in which the nitrate concentration exceeds the drinking-water standard (10 milligrams per liter) generally decrease with increasing depth to ground water. (Data shown are for the high-risk group.)
Conclusion
By determining the characteristics that influence ground-water contamination by nitrate, USGS scientists have been able to map high- and low-risk areas of the Nation. Areas with the highest risk have high nitrogen input, well-drained soils, and less extensive forested areas relative to cropland. Although local variations from regional patterns of contamination risk occur, data generally support the risk patterns shown on the national map. Continued development of this predictive tool, both nationally and locally, will help water resource managers develop more effective and economical approaches to protect the quality of the Nation's ground waters.
References
1. Hubbard, R.K., and J.M. Sheridan, "Nitrate Movement to Groundwater in the Southeastern Coastal Plain," Journal of Soil and Water Conservation, 44, January-February 1989, pp. 20-27.
2. Lowrance, Richard, "Groundwater Nitrate and Denitrification in a Coastal Plain Riparian Forest," Journal of Environmental Quality, 21, July-September 1992, pp. 401-405.
3. Mueller, David K., Hamilton, Pixie A., Helsel, Dennis R., Hitt, Kerie J., and Barbara C. Ruddy, "Nutrients in Ground Water and Surface Water of the United States--An Analysis of Data Through 1992," U.S. Geological Survey Water Resources Investigations Report 95-4031, 1995.
4. Nolan, Bernard T., Ruddy, Barbara C., Hitt, Kerie J., and Dennis R. Helsel, "Risk of Nitrate in Groundwaters of the United States--A National Perspective," Environmental Science and Technology, 31, August 1997, pp. 2229-2236.
6. Spalding, R.F., and M.E. Exner, "Occurrence of Nitrate in Groundwater--A Review," Journal of Environmental Quality, 22, July-September 1993, pp. 392-402.
7. U.S. Environmental Protection Agency, "Drinking Water Regulations and Health Advisories," Office of Water, Washington, D.C., 1995.

![]() U.S. Department of the Interior |
U.S. Geological Survey
U.S. Department of the Interior |
U.S. Geological Survey
URL: http://water.usgs.gov/nawqa/nutrients/pubs/wcp_v39_no12/index.html
Page Contact Information: gs-w_nawqa_whq@usgs.gov
Page Last Modified: Tuesday, 15-Sep-2015 09:41:52 EDT
