National Water-Quality Assessment (NAWQA) Project
The USGS National Water-Quality Assessment (NAWQA) program assessed total nitrogen and total phosphorus yields in over 8,000 stream reaches throughout the southeastern United States using the USGS watershed model SPARROW (Spatially Referenced Regression On Watershed Attributes). The southeast regional SPARROW model integrates Federal, State, and local agency monitoring data at over 300 stations with geospatial data describing nutrient inputs from fertilizer or agricultural land use, animal waste, urban land use, atmospheric deposition (nitrogen only), weathering or mining of rock (phosphorus only), and wastewater discharges, as well as physical characteristics of the watershed properties such as soil properties and precipitation). The combination of more calibration sites and refined geospatial data provides significant improvement over previous SPARROW models in prediction accuracy and the identification of regional nutrient sources and transport factors.
Results from the southeast regional models can be used to assess:
Description of maps showing nutrient delivery to outlets, estuaries, bays, and sounds in the southeastern U.S.
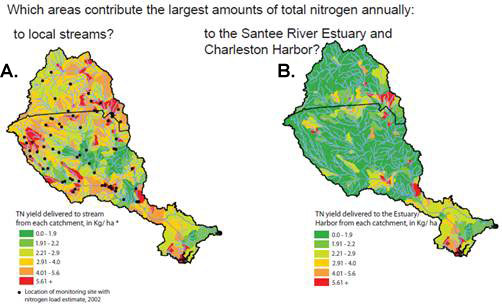
Total nitrogen or phosphorus yields from incremental watersheds to the local stream channel are shown in map A of each series. Total nitrogen or phosphorus yields from each incremental watershed that are delivered to receiving water bodies along the coast (or, in the case of the Tennessee River Basin, to the basin outlet) are shown in map B. The contrast between yields shown in each map pair A and B reflects processing and removal of nitrogen or phosphorus during transport in streams or reservoirs. For example, the map pair for nitrogen loading and delivery to the Santee River Estuary and Charleston Harbor show several watersheds in the upper part of the basin with relatively high rates of nitrogen loading (> 4 kilograms per hectare, shown as orange and red) ) to the local stream channel; the yield from most of these watersheds that is delivered to the Santee River Estuary and Charleston Harbor is much lower(< 2.2 kilograms per hectare), however, due to processing and removal of nitrogen processing in several large reservoirs.
Description of barcharts showing nutrient delivery to outlets, estuaries, bays, and sounds in the southeastern U.S.
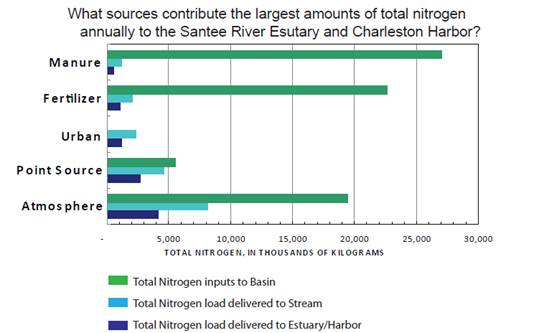
Estimates of mass of nutrient inputs to watersheds and SPARROW model estimates of mass delivered to the local stream and to the receiving water bodies along the coast are shown as a barchart for each series. The methods used to estimate nutrient inputs are described in Hoos and others, 2008. Nutrient inputs from urban areas are not graphed as they are estimated from area in urban land (square kilometers), rather than as units of mass. The relative contributions of nitrogen or phosphorus from the different sources in the Basin to the coastal receiving water bodies can be assessed by comparing the relative lengths of the dark blue bars. The contrast in the length of the light blue and dark blue bar for each source reflects processing and removal of nitrogen or phosphorus during transport to the coast in streams or reservoirs. For example, the barchart for nitrogen delivery to the Santee River Estuary and Charleston Harbor shows that atmospheric deposition contributes the largest share of nitrogen to these water bodies (4.3 X 10⁶ kilograms), followed by point source discharges of wastewater (2.7 X 10⁶ kilograms) and urban areas (1.3 X 10⁶ kilograms).
For more information on total nitrogen yield information for over 8,000 stream reaches throughout the South Atlantic-Gulf and Tennessee Major River Basins, see the report:
Hoos, A.B. and McMahon, G., 2009, Spatial analysis of instream nitrogen loads and factors controlling delivery to streams in the southeastern United States using spatially referenced regression on watershed attributes (SPARROW) and regional classification frameworks, Hydrological Processes, 23. Available online at: http://water.usgs.gov/nawqa/pubs/nitrogen_loads/
For more information on total phosphorus yield information for over 8,000 stream reaches throughout the South Atlantic-Gulf and Tennessee Major River Basins, see the report:
Garcia, A.M., Hoos, A.B., and Terziotti, Silvia., 2010, A regional framework of phosphorus transport for the southeastern United States, Journal of American Water Resources Association. Available online at: http://water.usgs.gov/nawqa/pubs/phosphorus_streams/
For more information on nutrient sources, including fertilizer applied, manure, atmospheric deposition, and wastewater discharge, incorporated into the regional SPARROW model see the report:
Hoos, A.B., Terziotti, Silvia, McMahon, Gerard, Savvas, Katerina, Tighe, K.C., and Alkons-Wolinsky, Ruth, 2008, Data to support statistical modeling of instream nutrient load based on watershed attributes, southeastern United States, 2002, U.S. Geological Survey Open-File Report 2008-1163, 50 p. Available online at: http://pubs.usgs.gov/of/2008/1163/
A general description of the SPARROW model can be accessed at: http://pubs.usgs.gov/fs/2009/3019/
For additional information on the southeastern regional SPARROW models,
contact Anne Hoos, abhoos@usgs.gov, or Ana Garcia, agarcia@usgs.gov

![]() U.S. Department of the Interior | U.S. Geological Survey
U.S. Department of the Interior | U.S. Geological Survey
URL: http://water.usgs.gov/nawqa/pubs/nitrogen_loads/map_explanation.html
Page Contact Information: gs-w_nawqa_whq@usgs.gov
Page Last Modified: Tuesday, 04-Mar-2014 14:45:00 EST
