National Water-Quality Assessment (NAWQA) Project
Go to:
U.S. GEOLOGICAL SURVEY
Water-Resources Investigations Report 98-4222
Sacramento, California, 1999
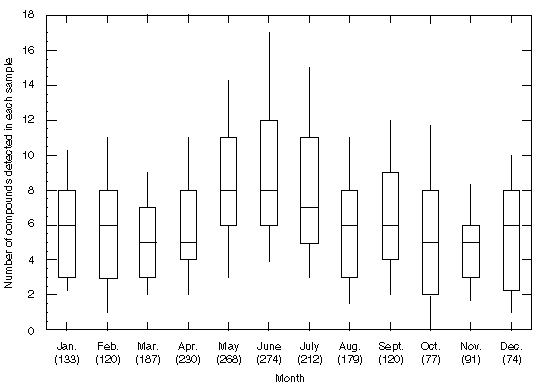
Figure 10. Distribution of the number of different compounds
detected in each sample collected from the 58 sites each month during 1993-95.
All reported detections were counted (a common reporting level was not used).
The total number of samples that were collected during each month is shown in
parenthesis. (See figure 5A and associated text for an
explanation of boxplots.)

![]() U.S. Department of the Interior | U.S. Geological Survey
U.S. Department of the Interior | U.S. Geological Survey
URL: http://water.usgs.gov/nawqa/pnsp/pubs/wrir984222/fig10.html
Page Contact Information: gs-w_nawqa_whq@usgs.gov
Page Last Modified: Tuesday, 04-Mar-2014 14:44:35 EST
