National Water-Quality Assessment (NAWQA) Project
Go to:
U.S. Geological Survey Open-File Report 96-627

Ages were determined from scales taken above the lateral line and slightly anterior to the middle of the fish using methods described in Jearld (1983). The ages of some fish could not be determined because regeneration caused scales to be unreadable. Scales from 10 percent of fish at each site were later reaged to assess variability, with at least 90 percent agreement between measurements.
Cross-reactivities of 17ß-estradiol antiserum (produced and characterized by Dr. T.S. Gross, University of Florida) with other steroids were as follows: 11.2 percent for estrone, 1.7 percent for estriol, less than 1.0 percent for 17a-estradiol and androstenedione, and less than 0.1 percent for all other steroids examined. Cross-reactivities of the 11-ketotestosterone antiserum (also produced and characterized by Dr. Gross) with other steroids were, 9.7 percent for testosterone, 3.7 percent for a-dihydrotestosterone, less than 1.0 percent for androstenedione, and less than 0.1 percent for all other steroids examined. A pooled sample (approximately 275 pg of 17ß-estradiol/mL and 220 pg 11-ketotestosterone/mL) was assayed serially in 10, 20, 30, 40, and 50 µL volumes (final volume of 50 µL with charcoalstripped plasma). The resulting inhibition curves were parallel to the respective standard curve, and the tests for homogeneity of regression indicated the curves did not differ.
Further characterization of the assays involved measurement of known amounts (1, 2, 5, 10, 25, 50, 100, 250, and 500 pg) of 17ß-estradiol or 11-ketotestosterone in 50 µL of charcoalstripped plasma. Values of R2 for correlations between actual and measured amounts were 0.93 for 17ß-estradiol and 0.88 for 11-ketotestosterone. Interassay and intra-assay coefficients of variation were 7.3 and 9.5 percent, respectively, for plasma 17ß-estradiol; and 9.1 and 8.7 percent, respectively, for plasma 11-ketotestosterone.
Purified antibody was diluted to 10 µg/mL in phosphate-buffer saline and coated onto 96well microtitre plates (50 µg/well), and stored overnight at 4°C. Plates then were washed with tris-buffered saline Tween (TBST), blocked with 360 µL per well of 0.1 percent bovine serum albumin in TBST for 2 hours at room temperature, and thoroughly washed again three times with TBST. Plasma samples were diluted from 1:500 to 1:5,000 in 0.1 percent bovine serum albumin in TBST and 50 µL was added in duplicate to microtitre plate wells and incubated overnight.
Standard curves were constructed by adding serial dilutions of purified carp vitellogenin (0.0001 mg/mL to 0.002 mg/mL) to male control plasma and processed the same way as samples. Male control plasma was made from a pool of plasma from fish collected at an uncontaminated site, which was shown by Western Blot assay to have no vitellogenin. The next day plates were washed with TBST, incubated with 50 uL per well rabbit anti-vitellogenin polyclonal antibody OF114 (produced and characterized by Dr. N.S. Denslow, University of Florida), diluted to 1:500, and incubated for 2 hours at room temperature. This discloses the vitellogenin captured by the monoclonal antibody in the first step. The polyclonal antibody was in turn disclosed by a goat antirabbit immunoglobulin class G, which was diluted 1:1,000, linked to alkaline phosphatase, and incubated for 2 hours at room temperature.
After a final series of washes with TBST, 100 µL of p-nitro phenyl phosphate in carbonate buffer (pH 9.6) was added to each well and incubated for 30 minutes. The intensity of yellow color that developed was quantified at 405 nm with an automated ELISA reader. Vitellogenin concentrations were calculated from standard curves after subtracting the small value (around 0.2 A405 nm) of a nonspecific color reaction with male control plasma.
The ELISA assay used in this study can detect between 10 and 100 ng of vitellogenin per well, resulting in a sensitivity of about 0.001 mg/mL. Each ELISA assay included a positive control, which was plasma with a known vitellogenin concentration, to test for interassay and intra-assay variation. The coefficient of variation was calculated for each duplicate sample and, if it exceeded 10 percent, samples were rerun. Standard curves fit by linear regression were used to calculate vitellogenin concentration, with R2 values usually between 0.95 and 0.99.
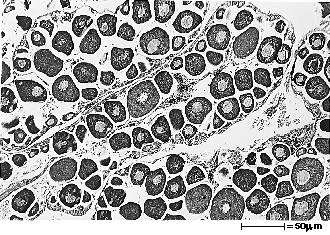
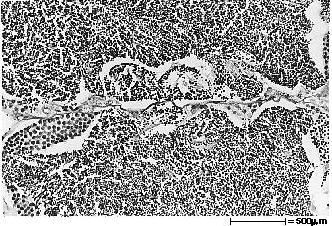
Gonads of female fish were classified according to four stages of sexual maturation, based on evaluation of histological slides (fig. 2A,B,C,D). Ovaries containing mostly perinucleolar oocytes at various stages of previtellogenic growth were classified as undeveloped (stage 0). Ovaries showing a mixture of both perinucleolar and cortical alveoli oocytes were classified as previtellogenic (stage 1). Ovaries classified as early vitellogenic (stage 2) had some vitellogenic oocytes of various sizes and development, with few to moderate numbers of vitelline granules, and no (or only a few) fully developed oocytes. The latest stage of sexual development for females, classified as late vitellogenic (stage 3), had ovaries in which most oocytes were at or near maximum size and contained numerous, densely packed vitelline granules.
Male gonads were classified according to three stages of sexual maturation (fig. 2E,F,G). Testes that were classified as early spermatogenic (stage 1) had thick germinal epithelium, with diffuse pronounced proliteration and maturation of spermatozoa. Mid-spermatogenic (stage 2) testes had germinal epithelium of moderate thickness, with diffuse moderate proliferation and maturation of sperm. Testes classified as late spermatogenic (stage 3) had mostly thin germinal epithelium, with only scattered spermatogenic activity characteristic of full-grown testes and the latest stage of maturity.
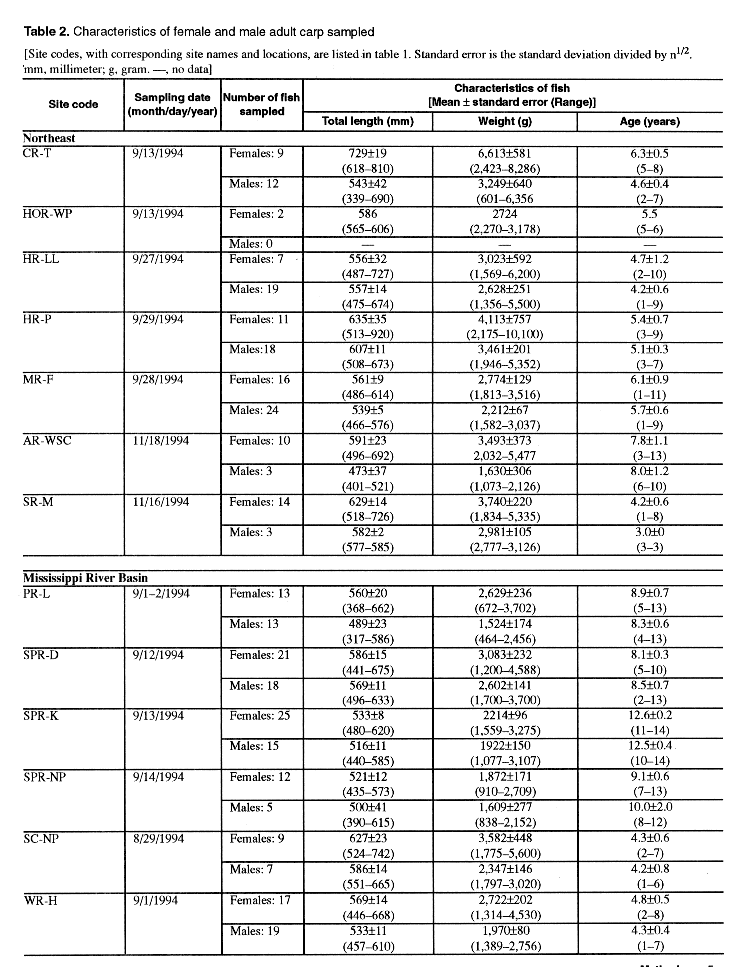
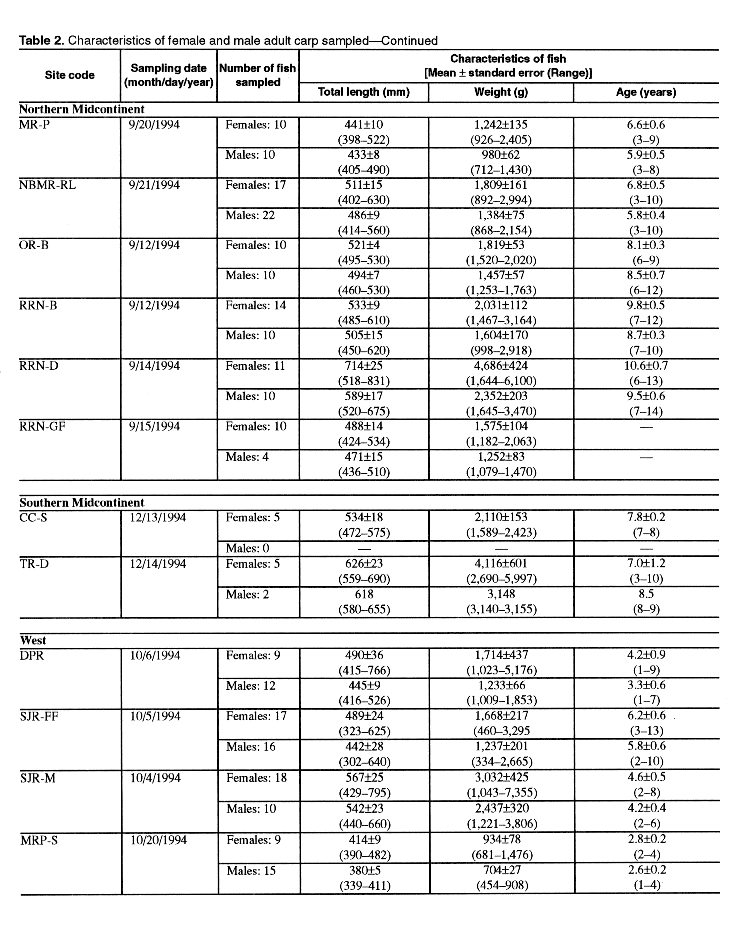
Potential complications to the large-scale reconnaissance approach taken in this study include geographic variation in biomarkers that are associated with stages of sexual maturation and variation because of environmental factors, such as photoperiod and water temperature. To be conservative in defining significant differences in biomarkers between sites, the biomarkers were evaluated and controlled for varia-tion from stages of sexual maturation, geographical region, and age.
Excluding vitellogenin in males, significant differences were detected in all biomarkers measured in both males and females using stage of sexual maturation as the classification variable. Fish with unknown stage of maturation (because gonads were not available) were treated as a distinct category. Age was not a significant factor, and the interaction between age and stage of maturation was not significant for any biomarker tested. The results of Tukey's HSD test for female carp showed no differences between stages 0 and 1 or between stages 2 and 3 and the unknowns, but these two groups were significantly different from each other. Therefore, female carp with ovaries in stages 2 and 3 (vitellogenic) and unknowns were combined for all subsequent analyses. Only 20 female carp in sexual maturation stages 0 and 1 were eliminated. Similar analyses for males showed no significant differences between stages 1 and 2 (early and midspermatogenic) and unknowns, but this group was significantly different from stage 3. Male carp with stages 1, 2, or unknown were combined for further analyses. Forty-nine male carp in the late spermatogenic stage were eliminated.



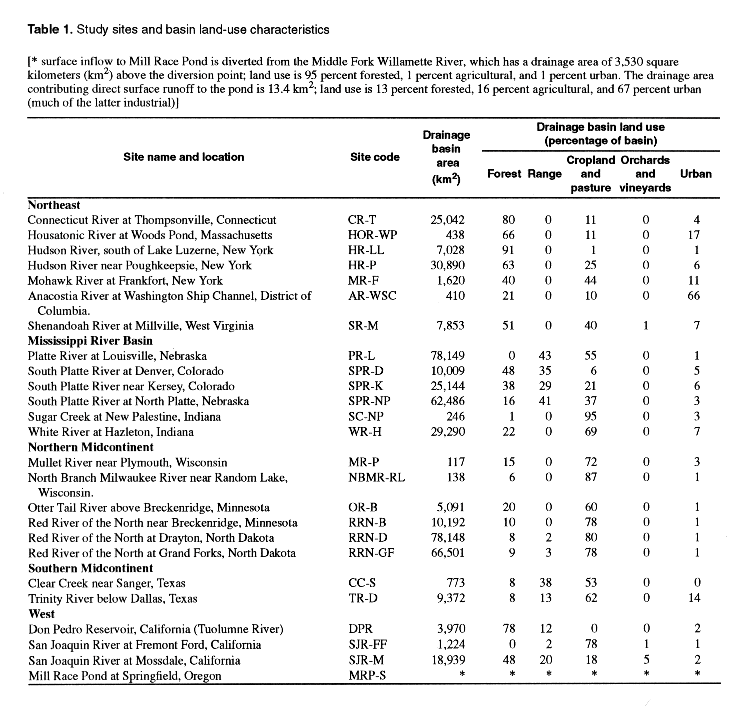
The potential influence of regionally varying conditions, such as temperature and photoperiod, was investigated in an aggregated manner by grouping sites into major regions (fig. 1) and testing for significant differences in biomarkers between regions. Analysis of covariance showed significant differences between regions by some measures, but not others. There were no consistent patterns in differences of biomarkers among regions. For males, the only significant differences were for E2/11-KT ratio, with the Northern Midcontinent found different (higher) than the Northeast and Mississippi River Basin regions. For females, excluding the Southern Midcontinent (with only two sites), there were significant differences between regions in 11-ketotestosterone (less in the Northern Midcontinent than in the Mississippi River Basin or the West) and in E2/11-KT ratio (less in the Mississippi River Basin and West than in the Northast or the Northern Midcontinent). Because differences were apparent in some of the biomarkers between some regions, and because of the potential for natural regional differences in biomarkers, site-to-site differences were tested only within each region.
Specifically, three primary types of contaminant data were used to characterize exposure: (1) analyses of organochlorine pesticides and PCBs in tissue; (2) analyses of polycyclic aromatic hydrocarbons (PAHs), phenols, and phthalates in bed sediment; and (3) analyses of dissolved pesticides in water. Not all types of data were available for all sites. Though each type of contaminant data was managed somewhat differently before analysis, as described below, the general approach was to attain a balance between logical, relatively homogeneous groupings of contaminants and a small enough number of contaminant parameters to evaluate the 25-site data set. Tables 3, 4, and 5 summarize the individual compounds included in each contaminant group. Generally, there was a high degree of intercorrelation among the most detected individual contaminants within each group. This intercorrelation, combined with the small data set and the reconnaissance-level nature of the study design, supported a grouped analysis rather than an approach based on individual contaminants.
[Data reporting limits for most compounds were 5-10 micrograms per kilogram (ug/kg) wet weight for most samples, except for toxaphene, which was 200 ug/kg]
--------------------------------------------------------
Aldrin           p,p'-DDT             Hexachlorobenzene
alpha-Chlordane  Dieldrin              o,p'-Methoxychlor
gamma-Chlordane  Endrin                p,p'-Methoxychlor
Dacthal (DCPA)   alpha-HCH            Mirex
o,p'-DDD         beta-HCH             cis-Nonachlor
p,p'-DDD         delta-HCH            trans-Nonachlor
o,p'-DDE         gamma-HCH (Lindane)  Oxychlordane
p,p'-DDE         Heptachlor           Pentachloroanisole
o,p'-DDT         Heptachlor epoxide   Toxaphene
--------------------------------------------------------
Twenty-seven organochlorine pesticides (table 3), total PCBs, and lipid content were analyzed in 20 tissue samples by the U.S. Geological Survey's National Water Quality Laboratory (NWQL), with five tissue samples analyzed by the Mississippi State Chemical Laboratory, under contract with the U.S. Fish and Wildlife Service. The basic methods used at the NWQL included Soxhlet extraction, gel permetation and adsorption chromatographic fractionation, and analysis by dual capillary-column gas chromatography with electron capture detection. Detailed analytical methods for NWQL tissue analysis are described by Leiker and others (1995).
Methods for analyzing organochlorine pesticides and PCBs in tissue at the Mississippi State Chemical Laboratory included soxhlet extract with hexane for 7 hours, concentration by rotary evaporation dissolution in petroleum ether, and extraction four times with acetonitrile. Residues were partitioned into petroleum ether, washed, concentrated, and transferred to a glass chromatographic column with florisil. The column was eluted with 5 percent diethyl ether and 94 percent petroleum ether into Fraction I, and with 15 percent diethyl ether and 85 percent petroleum ether into Fraction II. Fraction II is concentrated by packed or capillary column and quantified by electron-capture gas chromatography. Fraction I is concentrated and transferred to a silicic and acid chromatographic column to separate PCBs into three fractions and quantified by electron-capture gas chromatography.
Total organochlorine pesticides in tissue from each site were calculated by summing concentrations of all individual analytes listed in table 3, with zero concentration assigned to all nondetections. This approach results in a comparatively low approximation of the actual concentration. To minimize effects of different species, total organochlorine pesticide and PCB values were normalized by dividing the values by the lipid concentration for each composite sample. Both total organochlorine pesticides and PCBs were significantly (a=0.05) correlated with lipid concentration for the complete, multispecies national data set. Except for carp, data on individual species are too limited to individually evaluate correlations with lipid concentration. By dividing each composite sample value by its respective lipid concentration, all species were treated similarly, and the resulting values showed no remaining correlation with lipid concentration. In addition, analysis of correlations between contaminants and biomarkers showed no major differences (based on p values and direction of correlation) between results for lipid-normalized and non-normalized data.
At sites for which tissues were analyzed, but no PCBs or organochlorine pesticides detected, one-half of the lowest detected lipid-normalized value for the respective total was used for further data analyses. This procedure ensured that the few sites with no detections had the lowest lipid-normalized concentrations compared to the other study sites. All values were then log10 transformed for correlation analysis.

Fifty-two PAHs, 6 phenols, 6 phthalates, and organic-carbon content were analyzed by the NWQL. PAH, phenol, and phthalate compounds were extracted from the sediment with dichloromethane, followed by partial isolation using high-performance gel permeation chromatography and elution with dichloromethane. Compounds were then identified and quantified using dual capillary-column gas chromatography with electron-capture detection. Details on methods are reported in Furlong and others (1996).

Total concentrations of PAHs, phenols, and phthalates for each site were calculated by summing concentrations of all individual analytes listed for each group in table 4, with zero concentration assigned to all nondetections. This approach results in a comparatively low approximation of the actual concentration. Total concentration values were normalized by dividing the values by the organic carbon content of the sample to minimize affects of different site sediment characteristics in the results. Concentrations of PAHs, phenols, and phthalates in bed sediment were not significantly correlated with organic carbon concentrations for the complete national data set (21 sites), but p values for the three regressions ranged from 0.15 to 0.26, with positive slope coefficients of 0.14 to 0.17. Removal of two sites (NBMR-RL in the Northern Midcontinent and MRP-S in the West) with particularly high organic carbon levels resulted in a significant correlation between PAHs and organic carbon. Organic carbon normalization of bed-sediment data, similar to lipid normalization, probably results in the most comparable contaminant data possible for all sites. Analysis of relations between contaminants and biomarkers, however, showed no major differences (based on p values and directions of correlation) in results for carbon normalized and non-normalized data.
For any site where bed sediments were analyzed, but where no PAHs, phenols, or phthalates were detected, one half of the lowest detected organic carbon- normalized value for the respective group total was assigned for further data analysis. This procedure ensured that the sites with no detections had the lowest organic-carbon normalized concentrations compared to the other study sites. All values were log10 transformed for correlation analysis.
A potential weakness of the bed sediment contaminant data, as with tissue data, is that most samples were collected during a different year than that of the biomarkers. For reconnaissance purposes, however, the relative stability of these contaminants over time, the summation of contaminants by major groups, and the averaging accomplished by compositing, should result in a robust indication of overall site conditions. Nevertheless, the differences in timing of sample collection may be an important source of unexplained variation in data analysis.
For each site, a time-weighted annual mean concentration of dissolved pesticides was computed by summing all detected pesticides from each sample, weighting each sample total by the number of days it represents within the year, summing the time-weighted concentrations over the year, and dividing by 365 days. Nondetections were treated as zero concentrations, resulting in a comparatively low estimate of the total pesticide concentration. Annual medians, which were considered but not used in final analyses, yielded the same overall findings as timeweighted means. Time-weighted means were log 10 transformed for correlation analysis.
The most relevant measure of exposure of fish to dissolved pesticides for assessing potential endocrine disruption is difficult to determine. Dissolved pesticides vary over time within and between seasons in different ways for different chemicals and in different regions. The time-weighted annual mean was chosen as a relatively stable measure of average exposure. One potential weakness of the dissolved pesticide values is that pesticide sampling was done in a different year than when fish were sampled for biomarker analysis. However, year-to-year seasonal patterns and overall levels tend to repeat annually at a site, as shown by data in Richards and Baker (1993) and Coupe and others (1995). Nevertheless, important potential sources of unexplained variation in data analysis are temporal variability and, in particular, the uncertainty in which temporal measure of pesticide concentrations (for example seasonal mean or annual mean) is most relevant to endocrine effects.