National Water-Quality Assessment (NAWQA) Program
Go to:
Transport and Fate of Nitrate in a Glacial Outwash Aquifer in Relation to Ground-Water Age, Land Use Practices and Redox Processes
By Larry J. Puckett and Timothy K. Cowdery
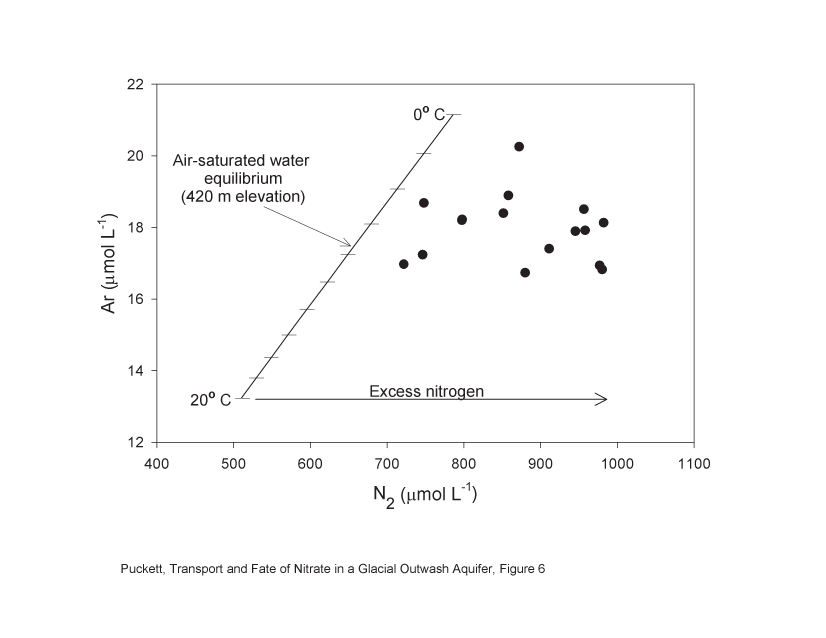
[Journal of Environmental Quality, vol. 31, no. 3, p. 782-796 ]Figure 6. Argon and nitrogen gas concentrations for samples collected during 1994, 1995, and 1997 and their theoretical values. Values to the right of the air-saturated water equilibrium line represent excess nitrogen concentrations. Horizontal tick marks on the equilibrium line indicate Ar and N2 equilibrium concentrations from 0 degrees to 20 degrees C in 2-degree increments.
Return to main report.

![]() U.S. Department of the Interior |
U.S. Geological Survey
U.S. Department of the Interior |
U.S. Geological Survey
URL: http://water.usgs.gov/nawqa/nutrients/pubs/jeq_v31_no3/fig6.html
Page Contact Information: gs-w_nawqa_whq@usgs.gov
Page Last Modified: Tuesday, 04-Mar-2014 14:44:11 EST
