National Water-Quality Assessment (NAWQA) Program
Go to:
BERNARD T. NOLAN,* ,† KERIE J. HITT, † AND BARBARA C. RUDDY ‡
[Environmental Science and Technology, v. 36, no. 10, p. 2138-2145.]* Corresponding author phone: (703) 648-4000; fax: (703) 6486693; e-mail: btnolan@usgs.gov.
† U.S. Geological Survey, 413 National Center, Reston, VA 20192.
‡ U.S. Geological Survey, Denver Federal Center, Mail Stop 415, Box 25046, Lakewood, CO 80225.
A new logistic regression (LR) model was used to predict the probability of nitrate contamination exceeding 4 mg/L in predominantly shallow, recently recharged groundwaters of the United States. The new model contains variables representing (1) N fertilizer loading (p < 0.001), (2) percent cropland-pasture (p < 0.001), (3) natural log of human population density (p < 0.001), (4) percent well-drained soils (p < 0.001), (5) depth to the seasonally high water table (p < 0.001), and (6) presence or absence of unconsolidated sand and gravel aquifers (p ) 0.002). Observed and average predicted probabilities associated with deciles of risk are well correlated (r2 ) 0.875), indicating that the LR model fits the data well. The likelihood of nitrate contamination is greater in areas with high N loading and well-drained surficial soils over unconsolidated sand and gravels. The LR model correctly predicted the status of nitrate contamination in 75% of wells in a validation data set. Considering all wells used in both calibration and validation, observed median nitrate concentration increased from 0.24 to 8.30 mg/L as the mapped probability of nitrate exceeding 4 mg/L increased from <= 0.17 to >0.83.
Groundwater is an important national resource that provides drinking water for more than half of the people in the United States (1). Unfortunately, shallow groundwater (typically less than about 5m in this study) is susceptible to contamination by chemicals derived from the land surface. Nitrate, from both natural and anthropogenic sources, is possibly the most widespread contaminant in groundwater (2). Because nitrate is both soluble and mobile, it is prone to leaching through soil with infiltrating water. Nitrate in watersheds is derived primarily from inorganic fertilizer, animal manure, and atmospheric deposition (3) and can persist in shallow groundwater for years. Natural sources of nitrate include organic N in plant matter and fixed ammonium in till and loess deposits (4, 5).
Contamination of shallow groundwater is a public-health concern in areas where it is used for drinking. Even if the shallow groundwater in an area is not used for drinking, contaminants can migrate to deeper groundwater supplies. Shallow groundwater is more susceptible to nitrate contamination than deep groundwater, and privately owned domestic wells typically are shallower than public-supply wells and are not routinely monitored for water quality. Nine percent of domestic wells sampled by the U.S. Geological Survey's National Water-Quality Assessment (NAWQA) program during 1993-2000 had nitrate concentrations exceeding the U.S. Environmental Protection Agency's (USEPA's) maximum contaminant level (MCL) of 10 mg/L as N (6), compared with 2% of public-supply wells. These exceedances are based on 1710 domestic wells and 264 public-supply wells, irrespective of depth to groundwater.
Elevated concentrations of nitrate (greater than 2 mg/L) in drinking water have been associated with adverse health effects. Ingestion of nitrate by infants can cause low oxygen levels in the blood, a potentially fatal condition known as methemoglobinemia or "blue baby" disorder (7). For this reason, the USEPA established the MCL of 10 mg/L nitrate as N. Nitrate concentrations of 19-29 mg/L in rural, domestic wells in Indiana might have caused eight spontaneous abortions among four women during 1991-1994 (8). Nitrate in drinking water also might increase cancer risk through production of N-nitroso compounds in the body, which are highly carcinogenic (9). A study of cancer incidence in Iowa women 55-69 years old found that the risk of bladder cancer was 2.83 times higher and the risk of ovarian cancer was 1.84 times higher when nitrate concentration in municipal water supplies exceeded 2.46 mg/L. In another study, nitrate concentrations of 4 mg/L or more in water from community wells in Nebraska increased the risk of non-Hodgkin's lymphoma (10). Shallow groundwater unaffected by human activities commonly contains less than 2 mg/L of nitrate (11).
Determining where shallow groundwater is at risk of nitrate contamination can help managers decide where to allocate scarce resources for cleanup, monitoring, or implementation of alternative management practices. Logistic regression (LR) has been used extensively in epidemiological studies to predict risk and is becoming more commonplace in environmental applications. Logistic regression differs from classical, linear regression in that the modeled response is the probability of being in a category, rather than the observed quantity of a response variable (12)
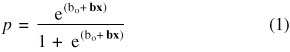
where bo = constant and bx = vector of slope coefficients and explanatory variables.
Logistic regression is well-suited to analysis of nondetects because a threshold value is specified to define the response categories and has been successfully applied in prior studies on the risk of groundwater contamination (13-22). Readers may consult Hosmer and Lemeshow (23) and Kleinbaum (24) for a detailed discussion of logistic regression.
Logistic regression is an improvement over earlier aquifer vulnerability studies involving geographic information systems (GIS). Prior researchers (25) used GIS overlays to estimate the likelihood of nitrate contamination of shallow groundwater in the United States, with statistical verification of resulting risk groups. In ranking and overlay methods, the independent variables are weighted equally. In contrast, logistic regression assigns weights to independent variables by way of slope coefficients estimated using the observed data.
The current study is a follow-up to previous LR work that related variables representing N sources and aquifer susceptibility to elevated nitrate concentration in shallow groundwaters of the United States (20). The previous model was developed using data collected from 1230 wells by the first 20 NAWQA study units that began in 1991 and contained the following variables: (1) N fertilizer loading to the land surface, (2) percent cropland-pasture, (3) natural log of human population density, (4) percent well-drained soils, (5) depth to the seasonally high water table, and (6) presence or absence of a fracture zone within a surficial aquifer. All variables were highly significant at the 0.05 level, and the model fits the data well. A linear regression fit of observed and predicted probabilities of nitrate exceeding 4 mg/L yielded a coefficient of determination (r2) value of 0.971.
The previous model was refined and used in the current study to predict the probability of nitrate contamination of predominantly shallow, recently recharged (within 10-20 years) groundwaters in unsampled areas of the nation. The previous model had been calibrated to groundwater nitrate data but was not validated with an independent data set. It was used to identify variables that significantly influence nitrate contamination of shallow groundwater but was not used in prediction. The new model was recalibrated with three updated variables that represent improved sources of data and validated using data collected by a different set of NAWQA study units that began in 1994. For example, land-use data in the new model represent the 1990s and are more current than the 1970s data used in the previous model.
A threshold of 4 mg/L nitrate was used to indicate anthropogenic effects relative to the 2 mg/L background level reported by Mueller and Helsel (11). Additionally, nitrate concentrations greater than 2 mg/L but less than the MCL of 10 mg/L have been associated with adverse health effects (9, 10). A modeling threshold based on the MCL of 10 mg/L was not used because it is considered too high to adequately protect drinking-water source areas. It is likely that groundwater in highly susceptible areas already has been contaminated, and groundwater with nitrate concentration greater than 10 mg/L is nearly impossible to remediate. In this paper, a groundwater nitrate concentration greater than 4 mg/L is designated an "event" and concentrations of 4 mg/L or less are designated "nonevents."
The calibration data set used in this study comprises 1280 wells that were sampled during 1992-1995 as part of land-use studies conducted by the first 20 NAWQA study units that began in 1991 (Figure 1). Springs and agricultural drains were excluded from analysis because of uncertainties in the source of water or contributing land-use area, and only one sample per well was used to preclude undue influence by wells that were sampled several times. Clustered wells were excluded to preclude over-representation of small areas. NAWQA land-use studies commonly have 20-30 wells and are designed to evaluate the quality of predominantly shallow, recently recharged groundwater beneath selected land uses in an aquifer of interest. The median depth to water for the calibration data set is 4.5 m. A few wells in the data set have depths to water approaching 200 m, but these are in fractured basalt in the Upper Snake River Basin. The fractured basalt aquifer is hydraulically connected to irrigation recharge and, therefore, is affected by overlying land use. The validation data set comprises 736 wells sampled during 1996-1999 as part of land-use studies conducted by 16 additional NAWQA study units that began in 1994 (Figure 1).
All wells were sampled according to procedures described by Koterba et al. (26). Nitrite-plus-nitrate was analyzed by the USGS National Water-Quality Laboratory based on procedures described in Fishman (27), and concentrations are reported as elemental N. Nitrite-plus-nitrate concentration is referred to as "nitrate" in the current study because nitrite concentration in groundwaters sampled by NAWQA generally is negligible (28).
In the current study, we updated three variables in the previous LR model (20): N loading from inorganic fertilizer, percent cropland-pasture, and the presence or absence of rock fractures. Whereas the previous model had assumed an equal allocation of N fertilizer to agricultural and urban areas, the new model uses separate estimates of farm and nonfarm N loading from inorganic fertilizer. Farm and nonfarm N loadings were estimated by David L. Lorenz (USGS. Unpublished data, 2001) using data from the Association of American Plant Food Control (29). Estimated N loadings in counties subsequently were allocated by Landsat-derived National Land Cover Data (NLCD) (30) for 500-m radius circular areas around sampled wells. Farm fertilizer N was allocated equally to NLCD categories comprising orchards/vineyards, row crops, and small grains, and nonfarm fertilizer N was allocated equally to low-intensity residential and urban/recreational grasses. Assumption of equal N application rate to different crop types is reasonable because crops in a given area commonly are rotated. Although the fertilizer application rate varies from year to year, groundwater movement is slow and chemicals accumulate over several growing seasons. Effects of changing N loadings are integrated and averaged over time. Using a single farm application rate of N for a county is reasonable also because the range of crop types in a given county is fairly limited.
The following individual NLCD categories were aggregated for consistency with the combined cropland-pasture variable in the previous model (20): pasture/hay, row crops, small grains, and fallow land. The NLCD represent early to mid 1990s land use, which is consistent with the 1992-1995 nitrate data used to calibrate the LR model. Cropland-pasture data used in the previous model were compiled by Anderson et al. (31), but these data (1970s) are not current. The previous model used Anderson data updated with 1990 Census population data to reflect recent conversion of agricultural land to new residential land (32).
Nitrogen loads from animal manure and septic systems are not explicitly represented in the new LR model. A variable representing animal manure, based on animal population in counties, was tested with these data but found statistically insignificant in regression. Although manure contributes lesser amounts of N than inorganic fertilizer nationally, it is an important regional source. Confined feeding operations are not explicitly represented in the model because a current, national coverage of such operations is unavailable. The cropland-pasture variable in the new LR model, however, contains information on N sources such as animal manure and septic systems. Population density is a surrogate for nonagricultural sources of nitrogen in urban areas, such as septic tanks, sewer exfiltration, and domestic animals.
The previous model (20) included a variable for the presence or absence of rock fractures, which had been compiled locally by NAWQA study-unit personnel. Because these data are not present outside of the NAWQA land-use study areas, a geology variable of national scope was needed to facilitate prediction in unsampled areas of the nation. To determine the uppermost susceptible aquifer, a binary indicator variable representing the presence or absence of unconsolidated sand and gravel aquifers was substituted for the former variable in the new model. The data sources are (1) a 1/2 500 000-scale principal aquifers map in the National Atlas of the United States (33), and (2) a 1/1 000 000-scale map of glaciated sediments east of the Rocky Mountains (34). The principal aquifer map shows the surface outcrop or near-surface (shallow subcrop) locations of aquifers but excludes glaciated sediments and alluvial aquifers along major rivers. The glaciated geology map comprises coarse-grained and fine-grained stratified sediments, till, and other materials in quaternary sediments (including river alluvium) of glaciated regions. The glaciated geology map complements the principal aquifer map because glaciogenic and alluvial aquifers (not shown on the principal aquifers map) are important sources of water in the northern and midwestern United States. Wells in areas shown as unconsolidated sand and gravel aquifers on the principal aquifer map or as coarse-grained stratified sediment on the glaciated geology map were coded "1", and wells in all other areas were coded as "0" to create the binary indicator variable.
State Soil Geographic (STATSGO) data describing the infiltration characteristics of the upper 1.8 m of soil were used in conjunction with the principal aquifer and glaciated geology maps to describe the overall susceptibility of near-surface aquifers to surface-derived contaminants. This accounts for the possibility that overlying materials (e.g., loess) might have infiltration characteristics different from unconsolidated sand and gravel comprising a near-surface aquifer.
The remaining variables in the new LR model are the same as used previously (20): natural log of 1990 human population density (35), percent well-drained soils or hydrologic groups A and B from the STATSGO database (36), and STATSGO depth to the seasonally high water table. STATSGO data represent spatial patterns of soil properties on the landscape and cover the nation at the 1/250 000 scale. The STATSGO variables were compiled as weighted averages within land-use study areas because STATSGO attributes vary little within 500 m of sampled wells. Nitrogen fertilizer loading, percent cropland-pasture, and population density are more variable and were compiled as weighted averages within 500 m of wells.
Variables in the new LR model were checked for statistical significance using the Wald statistic, which is the ratio of the maximum likelihood estimate of the slope coefficient to its standard error (23). The Wald statistic p value indicates whether slope coefficients are significantly different from zero. Linear regression was used to evaluate goodness-of-fit by comparing observed and predicted probabilities associated with deciles of risk. Deciles of risk are obtained by ranking predicted probabilities from low to high and creating 10 groups or bins, each with n/10 observations. The r2 value was computed for the observed and average predicted probabilities, with higher values indicating better fit. The Hosmer-Lemeshow (HL) goodness-of-fit test statistic was used to evaluate observed and expected probabilities in bins. Forty bins were used to increase the ability of the test to detect potential departures from model fit caused by a few individual observations in a bin. Higher HL p values indicate a better fit because the null hypothesis is that the model fits the data. Logistic regression modeling and related diagnostics used SAS and SYSTAT software (brand names in this paper do not constitute endorsement by the U.S. Geological Survey).
All of the variables in the new model were recompiled within 1-km grid cells to predict nitrate contamination risk at the national scale. Equation 1 was used with model inputs corresponding to over 7 million 1-km grid cells to calculate the probability for each that nitrate concentration in shallow groundwater exceeds 4 mg/L.
Recalibration of Multivariate Logistic Regression Model. Variables in the new LR model were checked for statistical significance using Wald statistic p values. The new model contains variables representing (1) N fertilizer loading (p < 0.001), (2) NLCD percent cropland-pasture (p < 0.001), (3) natural log of human population density (p < 0.001), (4) percent well-drained soils (p < 0.001), (5) depth to the seasonally high water table (p < 0.001), and (6) presence or absence of unconsolidated sand and gravel aquifers (p = 0.002). The Wald p values indicate that all six variables are highly significant at the 0.05 level, and all slope coefficients are positive (Table 1).
| variable | estimated coefficient | Wald p value |
|---|---|---|
| constant | -5.541 | <0.001 |
| 1992 fertilizer N (kg/ha) | 0.004 | <0.001 |
| NLCD cropland-pasture (%) | 0.016 | <0.001 |
| ln (1990 population density), ln (people/km2) | 0.229 | <0.001 |
| well-drained soils (%)a | 0.025 | <0.001 |
| depth to seasonally high water table (m) | 1.088 | <0.001 |
| presence or absence of unconsolidated sand and gravel aquifers | 0.424 | 0.002 |
a Sum of percentages of STATSGO soil hydrologic groups A and B in area.
Average predicted probabilities were compared with observed probabilities for deciles of risk to assess the fit of the new model. Each decile or bin yields an average predicted probability and an observed probability based on the number of observed values in the group that are greater than the threshold value. The observed and average predicted probabilities are well-correlated (r2 = 0.875), indicating that the new LR model fits the data well (Figure 2). The HL p value is 0.224, indicating that the fit of the new model is acceptable (higher HL p values indicate better fit). These results generally agree with those obtained with the previous model (20).
The slope coefficients indicate that the probability of nitrate contamination of shallow groundwater increases with increasing N fertilizer loading, percent cropland-pasture, population density, percent well-drained soils, depth to the seasonally high water table, and with the presence of unconsolidated sand and gravel aquifers (Table 1). Relations between groundwater nitrate concentration and N fertilizer or agricultural land use are well-documented (2, 13, 21, 37, 38). Relations among percent population density, percent well-drained soils, and depth to the seasonally high water table are consistent with the previous model (20). The positive sign of the slope coefficient for seasonally high water-table depth is consistent with the findings of Burkart et al. (17), who observed a positive correlation between this STATSGO variable and nitrate concentration in shallow aquifers. Whereas very shallow depth to water indicates waterlogged conditions conducive to denitrification, increasing depth to water lessens denitrification potential and increases the likelihood that nitrate exceeds 4 mg/L. Deep wells, which might have yielded anoxic samples with low nitrate concentration, generally were not considered in this analysis of predominantly shallow groundwaters.
The likelihood of nitrate contamination increases with the presence of unconsolidated sand and gravel aquifers, which comprise coarse-grained deposits that facilitate leaching of water and chemicals to the water table. Other aquifer types from the principal aquifer map that were tested but found ineffective in LR include semiconsolidated sand aquifers, sandstone aquifers, sandstone and carbonate-rock aquifers, carbonate-rock aquifers, and basaltic and volcanic-rock aquifers. Unconsolidated sands and gravels commonly have high effective porosity compared with other types of sediments and rock. Consolidated rocks have less interconnected pore space available for fluid flow, so the degree of fracturing affects water and chemical movement. Some of the above rocks (e.g., carbonate rocks and fractured basalt) inherently are susceptible to contamination because of solution channels and fractures. The reason for the ineffectiveness of these aquifer variables in LR is unclear. However, the principal aquifer map represents rock subcrops as well as outcrops, which might be deeper than some sampled wells in the shallow groundwater data set and, therefore, unrelated to the water-quality measurement. Median well depth in the calibration data set is 11.5 m. Although the NAWQA program characterizes geologic formations in which sampled wells are completed, these data are unavailable outside of NAWQA study areas. The principal aquifer and glaciated geology maps were used to characterize geology outside of NAWQA study areas to enable LR predictions in unsampled areas of the nation.
Some of the variables in the LR model (e.g., N fertilizer and percent cropland-pasture; percent well-drained soils and the presence or absence of unconsolidated sand and gravel aquifers) are related and therefore raise multicollinearity concerns. These variables, however, are not strongly related. Nitrogen fertilizer represents applications in urban areas as well as agricultural areas. Percent cropland-pasture contains information on additional N sources besides inorganic fertilizer, such as manure, septic systems, and atmospheric deposition; and although cropland-pasture indicates where inorganic fertilizer likely is applied, it does not indicate the rate of actual application. The rate and timing of N fertilizer application depend on regional and local factors such as crop type, tillage practice, soil type, and climate. If multicollinearity were present, the p values corresponding to both N fertilizer and cropland-pasture would be very large (e.g., 0.7 or greater) because the model would be unable to select from among the competing variables. Rather, both p values are highly significant (<0.001) (Table 1). Similarly, the binary indicator variable for unconsolidated sand and gravel aquifers complements the 1/250 000 STATSGO data representing well-drained soils. Whereas STATSGO data represent the upper 1.8 m of surficial soils, the binary indicator variable represents the underlying sediments and rocks composing the principal aquifer. Both p values associated with these variables are highly significant at the 0.05 level (Table 1).
Groundwater Nitrate in Specific Areas Follows Predicted Probabilities. Equation 1 was used with model coefficients in Table 1 to predict the probability of nitrate exceeding 4 mg/L for 1-km grid cells, resulting in a national map of the likelihood of nitrate contamination of shallow groundwater (Figure 3). Mapped probabilities reflect regional patterns of N sources and aquifer-susceptibility characteristics. High probabilities are most extensive in the High Plains, which can have high N fertilizer loading and well-drained soils overlying unconsolidated, coarse-grained deposits.
In most NAWQA study units, the exceedance probability predicted with the LR model reasonably approximates the observed proportion of wells with nitrate exceeding 4 mg/L, indicating that the model adequately simulates regional N loading and aquifer susceptibility in these areas. The observed probability of nitrate exceedances is 0.031 for wells in land-use studies of the Albemarle-Pamlico Drainage Basin (ALBE) in northeastern North Carolina and southeastern Virginia. The median predicted probability in the area (based on probabilities predicted with eq 1 for each well in ALBE land-use studies) is 0.085. Denitrification resulting from large amounts of organic carbon in poorly drained sediments contributes to low nitrate concentration in shallow groundwater of the outer Coastal Plain in the region (39).
The observed probability of nitrate exceeding 4 mg/L is 0.333 in shallow groundwaters of the Las Vegas Valley area and Carson and Truckee River Basins in western Nevada, and the median predicted probability is 0.309. Nitrogen loading is comparatively low in the Carson Desert, where alfalfa is the major crop. Alfalfa, a legume that fixes atmospheric N, does not need additional fertilizer after the plants are established. However, excess application of residential fertilizers, septic systems, and leakage from sewer pipes can lead to nitrate contamination of groundwater in the Las Vegas area (40).
In contrast to this, the probability of nitrate contamination in shallow groundwaters of the Central Columbia Plateau (CCPT) in eastern Washington is high. The observed probability that nitrate exceeds 4 mg/L is 0.703 for wells in land-use studies of the area, and the median predicted probability is 0.641. Irrigation and high rates of fertilizer application are major contributors to the high nitrate concentration in groundwaters of the area (41). Almost all of the water in the Plateau supports irrigation in arid agricultural areas, greatly increasing the recharge of water and nitrate to shallow groundwater. Although irrigation was not explicitly considered in model calibration, fertilizer might be a useful surrogate for irrigation in the region because arid areas that are fertilized commonly are irrigated.
The model inaccurately predicts the probability of contamination in some locales, such as the Rio Grande Valley of southern Colorado and western New Mexico. The observed probability that nitrate exceeds 4 mg/L only is 0.270 for wells in land-use studies of the area, but the median predicted probability 0.539. Diagnostic tests were used to evaluate changes in the Pearson chi-square statistic and estimated model coefficients resulting from poorly fitted, individual observations in the calibration data set. Three of four observations that fit the LR model poorly and that have large effect (high leverage) on the values of the estimated parameters are in the San Luis Valley, which is in the northern (Colorado) portion of the Rio Grande Valley. The three wells are in areas with high estimated fertilizer loading (396-434 kg/ha) and high percent cropland-pasture (94.6-96.7%), yet observed nitrate concentration is <4 mg/L in all three cases (0.1-3.7 mg/L). Leaching of fertilizer is variable in the Rio Grande Valley and depends on additional factors such as the timing of fertilizer and irrigation and recharge rate to the aquifer (42).
| data set | classification criteria (%) | observed "events" (nitrate > 4 mg/L) (%) | ||
|---|---|---|---|---|
| total correct responses | model sensitivity | model specificity | ||
| 1991 study units calibration data set (1280 observations) | 67.6 | 50.9 | 78.5 | 39.6 |
| 1994 study units validation data set (736 observations) | 75.0 | 12.4 | 96.0 | 25.1 |
In the Albuquerque area of the Rio Grande Valley, no samples had nitrate concentration greater than 4 mg/L. Relatively large dissolved organic carbon concentrations in shallow groundwaters of the area increase the potential for denitrification. High evapotranspiration in the southern part of the study area also might limit nitrate leaching. Annual potential evaporation may exceed 1000% of annual precipitation in the Rincon Valley area. A variable representing mean annual precipitation minus potential evapotranspiration was tested with the new logistic regression model to evaluate climate effects but did not significantly improve the model (p ) 0.19). Mean annual precipitation was evaluated previously during LR model calibration (20) but was statistically insignificant.
Logistic Regression Model Validation. The new LR model was validated with an independent data set comprising 736 wells that were sampled during 1996-1999 (Figure 1). The probability of nitrate exceeding 4 mg/L was calculated for each well using model parameters in Table 1, and average predicted probabilities and observed probabilities were determined for deciles of risk to assess the fit of the model. The observed and average predicted probabilities are reasonably well correlated (r2 = 0.793), indicating that model fit is acceptable (Figure 4). The degree of correlation is somewhat less than for the calibration data set (r2 = 0.875), and observed and predicted probabilities of exceeding 4 mg/L nitrate concentration all are less than 0.6. Compared with the calibration data set, the validation data set has fewer agricultural sites relative to urban sites and fewer incidences of nitrate exceeding 4 mg/L (Table 2).
Considering both events (nitrate > 4 mg/L) and nonevents (nitrate <= 4 mg/L), the new LR model correctly predicted nitrate status in three out of four wells in the validation data set (Table 2). Although model capability to correctly predict nonevents ("specificity") increased to 96% with the validation data set, the capability to correctly predict events ("sensitivity") decreased to 12%. Only about 25% of wells in the validation data set have nitrate > 4 mg/L, compared with about 40% of wells in the calibration data set. This likely is because the 1994 NAWQA study units sampled fewer wells in agricultural areas. The 16 NAWQA study units that began in 1994 conducted 11 shallow groundwater land-use studies in agricultural areas and 12 in urban areas. In contrast, the 20 NAWQA study units that began in 1991 conducted 36 shallow groundwater land-use studies in agricultural areas and 13 in urban areas. Nitrate concentration typically is lower in shallow groundwater beneath urban land, compared with that beneath agricultural land (28).
General Verification of Logistic Regression Model. As an additional verification step, wells from both the calibration and validation data sets were intersected with the national probability map and assigned probabilities predicted with the new model. Box plots associated with wells grouped by mapped probability ranges are shown in Figure 5. Tukey's multiple comparison test on the ranks was performed to determine which groups are different, and test results were evaluated at the 0.05 level of significance. Box plots labeled with different letters (e.g., A and B in Figure 5) have medians that are significantly different at the 0.05 level. As the mapped probability of nitrate exceeding 4 mg/L increases, the observed median nitrate concentration increases from 0.24 to 8.30 mg/L. The strong relation between observed median nitrate concentration and mapped probability indicates that the overall fit of the LR model is good.
Uses and Limitations. The national probability map can help assess the vulnerability of source-water areas as mandated by amendments to the Safe Drinking Water Act (SDWA) (43), for scenarios where predominantly shallow groundwater is used as public supply. Aquifer vulnerability assessment is an integral component of the amended SDWA. The map also can help managers prioritize areas for monitoring, cleanup, or implementation of alternative management practices.
The national probability map is intended for regional (multicounty) use and has several limitations. Areas of high probability on the map have high potential for nitrate contamination but are not necessarily contaminated. Variables not significant in national-scale regression (such as percent artificially drained soils) or not considered or available during model calibration (such as irrigation) can affect nitrate leaching locally, so the map should not be used for local management decisions. Also, variations in local hydrogeologic conditions can cause variations in water quality that are inconsistent with mapped probabilities. For example, sinkholes in karst areas can facilitate nitrate leaching to groundwater, but karst features could not be mapped at the national scale.
The authors thank the many NAWQA personnel who collected the data used in this study. We also thank David L. Lorenz, Curtis V. Price, and David M. Wolock for compiling data used in this study.
(1) Solley, W. B.; Pierce, R. R.; Perlman, H. A. Estimated Use of Water in the United States in 1990; U.S. Geological Survey Circular 1081, 1993.
(2) Hallberg, G. R.; Keeney, D. R. Nitrate. In Regional Ground-Water Quality; Alley, W. M., Ed.; Van Nostrand Reinhold: New York, 1993.
(3) Puckett, L. J. Nonpoint and Point Sources of Nitrogen in Major Watersheds of the United States; U.S. Geological Survey Water-Resources Investigations Report 94-4001, 1994.
(4) Boyce, J. S.; Muir, J.; Edwards, A. P.; Seim, E. C.; Olson, R. A. J. Environ. Qual. 1976, 5,93-96.
(5) Hendry, M. J.; McCready, R. G. L.; Gould, W. D. J. Hydrol. 1984, 70, 177-198.
(6) U.S. Environmental Protection Agency. Drinking Water Regulations and Health Advisories; Office of Water: Washington DC, 1995.
(7) Spalding, R. F.; Exner, M. E. J. Environ. Qual. 1993, 22, 392-402.
(8) Centers for Disease Control and Prevention. Morb. Mort. Weekly Rep. 1996, 45, 569-572.
(9) Weyer, P. J.; Cerhan, J. R.; Kross, B. C.; Hallberg, G. R.; Kantamneni, J.; Breuer, G.; Jones, M. P.; Zheng, W.; Lynch, C. F. Epidemiol. 2001, 11, 327-338.
(10) Ward, M. H.; Mark, S. D.; Cantor, K. P.; Weisenburger, D. D.; Correa-Villasenor, A.; Zahm, S. H. Epidemiol. 1996, 7, 465-471.
(11) Mueller, D. K.; Helsel, D. R. Nutrients in the Nation's Waters-Too Much of a Good Thing?; U.S. Geological Survey Circular 1136, 1996.
(12) Helsel, D. R.; Hirsch, R. M. Statistical Methods in Water Resources; Elsevier: New York, 1992.
(13) Eckhardt, D. A. V.; Stackelberg, P. E. Ground Water 1995, 33, 1019-1033.
(14) Teso, R. R.; Poe, M. P.; Younglove, T.; McCool, P. M. J. Environ. Qual. 1996, 25, 425-432.
(15) Nolan, B. T.; Clark, M. L. J. Environ. Qual. 1997, 26, 849-857.
(16) Rupert, M. G. Probability of Detecting Atrazine/Desethyl-Atrazine and Elevated Concentrations of Nitrate (NO2 + NO3 -N) in Ground Water in the Idaho Part of the Upper Snake River Basin; U.S. Geological Survey Water-Resources Investigations Report 98-4203, 1998.
(17) Burkart, M. R.; Kolpin, D. W.; Jaquis, R. J.; Cole, K. J. J. Environ. Qual. 1999, 28, 1908-1915.
(18) Squillace, P. J.; Moran, M. J.; Lapham, W. L.; Price, C. V.; Clawges, R. M.; Zogorski, J. S. Environ. Sci. Technol. 1999, 33, 4176-4187.
(19) Squillace, P. J.; Moran, M. J. Estimating the Likelihood of MTBE Occurrence in Drinking Water Supplied by Ground-Water Sources in the Northeast and Mid-Atlantic Regions of the United States; U.S. Geological Survey Open-File Report 00-343, 2000.
(20) Nolan, B. T. Ground Water 2001, 39, 290-299.
(21) Tesoriero, A. J.; Voss, F. D. Ground Water 1997, 35, 1029-1039.
(22) Tesoriero, A. J.; Inkpen, E. L.; Voss, F. D. Assessing Groundwater Vulnerability using Logistic Regression. In Proceedings of the Source Water Assessment and Protection Conference, Dallas, TX, April 28-30, 1998.
(23) Hosmer, D. W.; Lemeshow, S. Applied Logistic Regression; John Wiley and Sons: New York, 1989.
(24) Kleinbaum, D. G. Logistic RegressionsA Self-Learning Text; Springer-Verlag: New York, 1994.
(25) Nolan, B. T.; Ruddy, B. C.; Hitt, K. J.; Helsel, D. R. Environ. Sci. Technol. 1997, 31, 2229-2236.
(26) Koterba, M. T.; Wilde, F. D.; Lapham, W. W. Ground-Water Data-Collection Protocols and Procedures for the National Water-Quality Assessment Program: Collection and Documentation of Water-Quality Samples and Related Data; U.S. Geological Survey Open-File Report 95-399, 1995.
(27) Fishman, M. J., Ed. Methods of Analysis by the U.S. Geological Survey National Water Quality LaboratorysDetermination of Inorganic and Organic Constituents in Water and Fluvial Sediments; U.S. Geological Survey Open-File Report 93-125, 1993.
(28) Nolan, B. T.; Stoner, J. D. Environ. Sci. Technol. 2000, 34, 11561165.
(29) Association of American Plant Food Control. University of Kentucky, Lexington, KY, 2000.
(30) Vogelmann, J. E.; Howard, S. M.; Yang, L.; Larson, C. R.; Wylie, B. K.; Van Driel, N. Photogram. Engin. Remote Sens. 2001, 67, 650-662.
(31) Anderson, J. R.; Hardy, E. E.; Roach, J. T.; Witmer, R. E. A Land Use and Land Cover Classification System for Use with Remote Sensor Data; U.S. Geological Survey Professional Paper 964, 1976.
(32) Hitt, K. J. Refining 1970's Land-Use Data with 1990 Population Data to Indicate New Residential Development; U.S. Geological Survey Water-Resources Investigations Report 94-4250, 1994.
(33) U.S. Geological Survey. The National Atlas of the United States of America. Reston, Virginia, 1998. http://www.nationalatlas.gov.
(34) Soller, D. R.; Packard, P. H. Digital Representation of a Map Showing the Thickness and Character of Quaternary Sediments in the Glaciated United States East of the Rocky Mountains; U.S. Geological Survey Digital Data Series DDS-38, 1998.
(35) U.S. Bureau of the Census. 1990 Census of Population and Housing, Public Law 94-171 Data (United States); Washington DC, 1991.
(36) Soil Conservation Service. State Soil Geographic (STATSGO) Data Base for the United States and Puerto Rico (CDROM). U.S. Department of Agriculture, Soil Conservation Service, Ft. Worth, Texas, 1994. http://www.ftw.nrcs.usda.gov/stat_data.html.
(37) Hall, D. W. Ground Water 1992, 30, 720-730.
(38) Bohlke, J. K.; Denver, J. M. Water Resour. Res. 1995, 31, 23192339.
(39) Spruill, T. B.; Harned, D. A.; Ruhl, P. M.; Eimers, J. L.; McMahon, G.; Smith, K. E.; Galeone, D. R.; Woodside, M. D. Water Quality in the Albemarle-Pamlico Drainage Basin, North Carolina and Virginia, 1992-95; U.S. Geological Survey Circular 1157, 1998.
(40) Bevins, H. E.; Lico, M. S.; Lawrence, S. J. Water Quality in the Las Vegas Valley Area and the Carson and Truckee River Basins, Nevada and California, 1992-96; U.S. Geological Survey Circular 1170, 1998.
(41) Williamson, A. K.; Munn, M. D.; Ryker, S. J.; Wagner, R. J.; Ebbert, J. C.; Vanderpool, A. M. Water Quality in the Central Columbia Plateau, Washington and Idaho, 1992-95; U.S. Geological Survey Circular 1144, 1998.
(42) Levings, G. W.; Healy, D. F.; Richey, S. F.; Carter, L. F. Water Quality in the Rio Grande Valley, Colorado, New Mexico, and Texas, 1992-95; U.S. Geological Survey Circular 1162, 1998.
(43) U.S. Environmental Protection Agency. Safe Drinking Water Act Amendments of 1996. Office of Ground Water and Drinking Water: Washington, DC, 1996.
Received for review October 24, 2001. Revised manuscript received February 4, 2002. Accepted February 19, 2002.
ES0113854

![]() U.S. Department of the Interior |
U.S. Geological Survey
U.S. Department of the Interior |
U.S. Geological Survey
URL: http://water.usgs.gov/nawqa/nutrients/pubs/est_v36_no10/est_v36_no10.html
Page Contact Information: gs-w_nawqa_whq@usgs.gov
Page Last Modified: Tuesday, 04-Mar-2014 14:44:09 EST
