National Water-Quality Assessment (NAWQA) Project
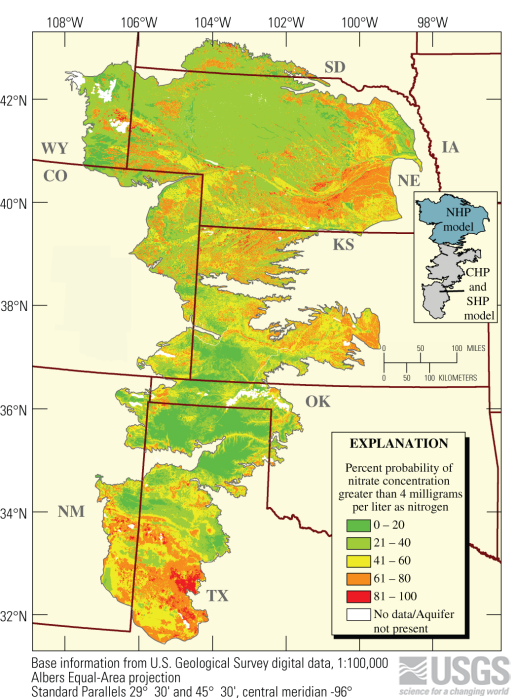
This map illustrates the percent probability of the nitrate concentration in recently recharged ground water exceeding the natural background concentration of 4 milligrams per liter as nitrogen. Areas in orange or red have a high (>60%) probability of having elevated nitrate concentrations and tend to be locations that have greater percentages of agricultural land and shallower depths to the water table. The analysis used to produce this map showed that factors affecting the aquifer's vulnerability to nitrate concentrations higher than background levels included non-irrigated agriculture, irrigated agriculture, soil organic matter, the percentage of clay in the unsaturated zone, and depth to water. Output from these types of predictive models can be used to identify parts of the aquifer susceptible to nitrate contamination, which in turn, can be used to better focus monitoring and protection efforts.
To access the report that accompanies this map please see: http://pubs.usgs.gov/circ/1337/
For further information on the High Plains Aquifer study please see: http://co.water.usgs.gov/nawqa/hpgw/HPGW_home.html

![]() U.S. Department of the Interior | U.S. Geological Survey
U.S. Department of the Interior | U.S. Geological Survey
URL: http://water.usgs.gov/nawqa/home_maps/figure_4-5.html
Page Contact Information: gs-w_nawqa_whq@usgs.gov
Page Last Modified: Tuesday, 04-Mar-2014 14:43:57 EST
