USGS 01480870 East Branch Brandywine Creek below Downingtown, PA

PROVISIONAL DATA SUBJECT TO REVISION

Click to hidestation-specific text


Station gage imageSTATION.--01480870 East Branch Brandywine Creek Below Downingtown, PA
LOCATION.--Lat 39`58'07", long 75`40'25", Chester County, Hydrologic Unit 02040205, on left bank at downstream side of Sugars Bridge (U.S. Highway 322), 2,000 ft upstream from Valley Creek, 1.5 mi north of Marshallton, and 3.3 mi southeast of Downingtown.
DRAINAGE AREA.--89.9 square miles.
PERIOD OF RECORD.--February 1972 to current year.
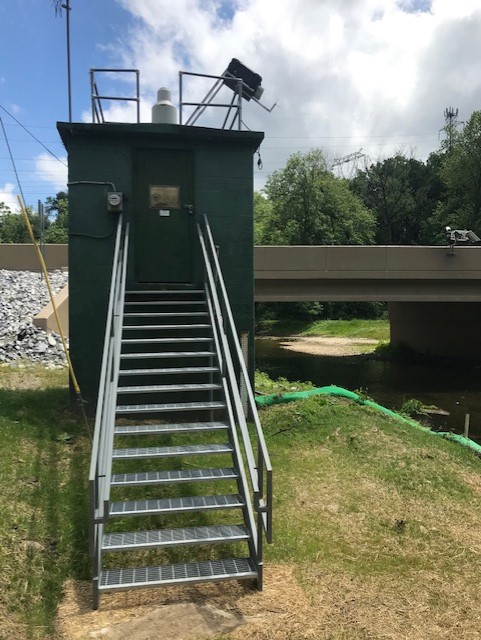
GAGE.--Water-stage recorder, crest-stage gage, water-quality monitor, and Pluvio precipitation gage. Datum of gage is 195 ft above National Geodetic Vertical Datum of 1929, from topographic map. Feb 1 to Apr 10, and Jun 25 to Nov 17, 1972, non-recording gage at same site and datum. Satellite telemetry at station.
COOPERATION.--Station established and maintained by the U.S. Geological Survey. Funding for the operation of this station is provided by Chester County Water Resources Authority and the U.S. Geological Survey.
REMARKS.--Flow regulated since November 1973 by Marsh Creek Reservoir (station 01480684), about 7.5 mi upstream. Select water-quality data collection discontinued during winter months since the 1981 water year. Other interruptions in the record were due to malfunctions of the equipment.
GAGE HEIGHTS OF IMPORTANCE.-
Supplied by NWS: Action stage-6 ft; Flood stage-7 ft; Moderate flood stage-9 ft; Major flood stage-11 ft.
This station managed by the PAWSC Downingtown Field Office.

Available Parameters Available Period
  
2007-10-01  2024-04-16
2009-10-02  2024-04-16
1986-02-15  2024-04-16
2007-10-01  2024-04-16
2007-10-01  2024-04-16
2007-10-01  2024-04-16
2007-10-01  2024-04-16
2007-10-01  2024-04-16
2021-04-17  2024-04-16
2021-04-17  2024-04-16


 (7)
 

  -- or --


Summary of all available data for this site
Instantaneous-data availability statement


Temperature, water, degrees Celsius

Most recent instantaneous value: 16.2 04-16-2024   13:45 EDT
Graph of

Add up to 2 more sites and replot for "Temperature, water, degrees Celsius"

?


Create presentation-quality / stand-alone graph.   Subscribe to WaterAlert      

See this graph on the Monitoring Location Pages


Precipitation, total, inches

Most recent instantaneous value: 0.00 04-16-2024   13:45 EDT
Graph of

Add up to 2 more sites and replot for "Precipitation, total, inches"

?


Create presentation-quality / stand-alone graph.   Subscribe to WaterAlert      

See this graph on the Monitoring Location Pages


Discharge, cubic feet per second

Most recent instantaneous value: 234 04-16-2024   14:15 EDT
Graph of

Add up to 2 more sites and replot for "Discharge, cubic feet per second"

?


Create presentation-quality / stand-alone graph.   Subscribe to WaterAlert      

See this graph on the Monitoring Location Pages


Daily discharge, cubic feet per second -- statistics for Apr 16 based on 48 water years of record more
Min
(1985)
25th
percen-
tile
Median 75th
percen-
tile
Most Recent
Instantaneous
Value Apr 16
Mean Max
(2007)
52.0 104 173 230 234 306 1970


Gage height, feet

Most recent instantaneous value: 3.84 04-16-2024   14:15 EDT
Graph of

Add up to 2 more sites and replot for "Gage height, feet"

?


Create presentation-quality / stand-alone graph.   Subscribe to WaterAlert      

See this graph on the Monitoring Location Pages


Specific conductance, water, unfiltered, microsiemens per centimeter at 25 degrees Celsius

Most recent instantaneous value: 314 04-16-2024   13:45 EDT
Graph of

Add up to 2 more sites and replot for "Specific conductance, water, unfiltered, microsiemens per centimeter at 25 degrees Celsius"

?


Create presentation-quality / stand-alone graph.   Subscribe to WaterAlert      

See this graph on the Monitoring Location Pages


Dissolved oxygen, water, unfiltered, milligrams per liter

Most recent instantaneous value: 13.4 04-16-2024   13:45 EDT
Graph of

Add up to 2 more sites and replot for "Dissolved oxygen, water, unfiltered, milligrams per liter"

?


Create presentation-quality / stand-alone graph.   Subscribe to WaterAlert      

See this graph on the Monitoring Location Pages


pH, water, unfiltered, field, standard units

Most recent instantaneous value: 8.1 04-16-2024   13:45 EDT
Graph of

Add up to 2 more sites and replot for "pH, water, unfiltered, field, standard units"

?


Create presentation-quality / stand-alone graph.   Subscribe to WaterAlert      

See this graph on the Monitoring Location Pages


Turbidity, water, unfiltered, monochrome near infra-red LED light, 780-900 nm, detection angle 90 +-2.5 degrees, formazin nephelometric units (FNU)

Most recent instantaneous value: 1.6 04-16-2024   13:45 EDT
Graph of

Add up to 2 more sites and replot for "Turbidity, water, unfiltered, monochrome near infra-red LED light, 780-900 nm, detection angle 90 +-2.5 degrees, formazin nephelometric units (FNU)"

?


Create presentation-quality / stand-alone graph.   Subscribe to WaterAlert      

See this graph on the Monitoring Location Pages


Suspended sediment load, water, unfiltered, computed, the product of regression-computed suspended sediment concentration and streamflow, short tons per day

Most recent instantaneous value: 2.29 04-16-2024   13:45 EDT
Graph of

Add up to 2 more sites and replot for "Suspended sediment load, water, unfiltered, computed, the product of regression-computed suspended sediment concentration and streamflow, short tons per day"

?


Create presentation-quality / stand-alone graph.   Subscribe to WaterAlert      

See this graph on the Monitoring Location Pages


Suspended sediment concentration, water, unfiltered, estimated by regression equation, milligrams per liter

Most recent instantaneous value: 3.6 04-16-2024   13:45 EDT
Graph of

Add up to 2 more sites and replot for "Suspended sediment concentration, water, unfiltered, estimated by regression equation, milligrams per liter"

?


Create presentation-quality / stand-alone graph.   Subscribe to WaterAlert      

See this graph on the Monitoring Location Pages